New Roles of Glycosaminoglycans in
α
-Synuclein Aggregation in a Cellular Model
of Parkinson Disease
Sonia Lehri-Boufala1, Mohand-Ouidir Ouidja1, Véronique Barbier-Chassefière1, Emilie Hénault1, Rita Raisman-Vozari2, Laure Garrigue-Antar1, Dulce Papy-Garcia1, Christophe Morin1*
1Université Paris-Est Créteil, Laboratoire CRRET-EAC CNRS 7149, 61 Avenue de Général de Gaulle, 94010, Créteil, France,2CNRS UMR 7225, Hôpital de la Salpêtrière-Bâtiment, ICM (Centre de Recherche de l’Institut du Cerveau et de la Moelle épinière), CRICM, Thérapeutique Expérimentale de la
Neurodégénérescence, Université Pierre et Marie Curie, UPMC, 75651, Paris, France
Abstract
The causes of Parkinson disease (PD) remain mysterious, although some evidence supports mitochondrial dysfunctions andα-synuclein accumulation in Lewy bodies as major events. The abnormal accumulation ofα-synuclein has been associated with a deficiency in the ubiquitin-proteasome system and the autophagy-lysosomal pathway. Cathepsin D (cathD), the major lysosomal protease responsible ofα-synuclein degradation was described to be up-regulated in PD model. As glycosaminoglycans (GAGs) regulate cathD activity, and have been recently suggested to participate in PD physiopathology, we investigated their role in
α-synuclein accumulation by their intracellular regulation of cathD activity. In a classical neu-roblastoma cell model of PD induced by MPP+, the genetic expression of GAGs-biosynthetic enzymes was modified, leading to an increase of GAGs amounts whereas intracellular level ofα-synuclein increased. The absence of sulfated GAGs increased intracellular cathD activi-ty and limitedα-synuclein accumulation. GAGs effects on cathD further suggested that spe-cific sequences or sulfation patterns could be responsible for this regulation. The present study identifies, for the first time, GAGs as new regulators of the lysosome degradation path-way, regulating cathD activity and affecting two main biological processes,α-synuclein ag-gregation and apoptosis. Finally, this opens new insights into intracellular GAGs functions and new fields of investigation for glycobiological approaches in PD and neurobiology.
INTRODUCTION
Parkinson’s disease (PD) is one of the most common neurodegenerative diseases affecting al-most 1% of the population worldwide and is mainly characterized by the death of dopaminer-gic neurons in thesubstantia nigra. Even though the cause of PD remains mysterious, several lines of evidence support mitochondrial dysfunctions [1] andα-synuclein accumulation in
a11111
OPEN ACCESS
Citation:Lehri-Boufala S, Ouidja M-O, Barbier-Chassefière V, Hénault E, Raisman-Vozari R, Garrigue-Antar L, et al. (2015) New Roles of Glycosaminoglycans inα-Synuclein Aggregation in a Cellular Model of Parkinson Disease. PLoS ONE 10(1): e0116641. doi:10.1371/journal.pone.0116641
Academic Editor:Thomas Arendt, University of Leipzig, GERMANY
Received:June 14, 2014
Accepted:December 11, 2014
Published:January 24, 2015
Copyright:© 2015 Lehri-Boufala et al. This is an open access article distributed under the terms of the
Creative Commons Attribution License, which permits unrestricted use, distribution, and reproduction in any medium, provided the original author and source are credited.
Data Availability Statement:All relevant data are within the paper and its Supporting Information files.
Funding:The authors have no support or funding to report.
Lewy bodies (LB) as major disease events. Although the formation of LB and their role in dopa-minergic neuron death remain elusive [2,3], the biological function ofα-synuclein is not fully understood. However, this protein is abundantly expressed in pre-synaptic terminals and seems to be involved in the regulation and the maintenance of dopaminergic cells homeostasis. Importantly,α-synuclein over-expression has been associated to several traits of PD in animal models with mitochondrial complex I dysfunctions, whereasα-synuclein null mice display striking resistance to the degeneration of dopaminergic neurons and dopamine release induced by the neurotoxin MPTP [4,5]. The central adverse feature ofα-synuclein over-expression is its tendency to misfold and to subsequently aggregate in oligomers suspected to induce toxicity in neurons, as described with other proteins aggregates [6]. Once accumulated,α-synuclein spontaneously aggregates and promotes inclusion formation which is suggested to lead to LB. The accumulation ofα-synuclein and its subsequent aggregation have been associated with a deficiency in protein processing considered as one of the potential starting point of the disease [7]. While this remains to be confirmed and the precise mechanism ofα-synuclein degradation is not yet fully understood, several studies have suggested that all major cellular degradation pathways are involved in its catabolism [8,9]. In PD, dysfunctions of the ubiquitin-proteasome system (UPS) could lead to the accumulation of the ubiquitinylatedα-synuclein with its con-comitant aggregation into inclusion bodies, which would finally induce neuronal death [10]. Beside this, the autophagy-lysosomal pathway (ALP) is progressively diminished with age and the impairment of its protein processing capacity is associated with a higher risk of neurode-generation [11,12,13]. Interestingly, recent studies suggest that under normal conditions, the UPS is the main degradation pathway forα-synuclein, while the ALP is recruited when the α-synuclein expression increases, such as in pathologic conditions [11]. Among the ALP path-way protagonists, the lysosomal aspartic protease cathepsin D (cathD) was described as the mainα-synuclein degrading enzyme [14], able to preventα-synuclein aggregation and toxicity [15,16]. Thus, in a rhesus monkey model of PD, over-expression of cathD and the increased number of lysosomes were correlated with apoptotic processes [17]. However, these findings highlighted the discrepancy between the presence of cathD and its inefficiency to prevent α-synuclein accumulation, suggesting the presence of unidentified endogenous inhibitor(s). It has long been known that cathD activity is inhibited by endogenous sulfated polysaccharides, i.e. glycosaminoglycans (GAGs), which are present in lysosomes where they are processed after endocytosis [18,19]. In previous studies, we showed that GAGs and their synthetic mimetics can effectively modulate cathD activity, protect mitochondria, and inhibit apoptosis-induced oxidative stress [19,20]. This suggests the potential role of GAGs in pathologies where such processes occur. Interestingly, a typical mucopolysaccharidosis mutation in α-N-acetylglucosa-minidase (NAGLU) gene, leading to lysosomal impairment, GAGs accumulation, with con-comitantα-synuclein aggregation, was recently described in PD patients [21]. Heparan sulfates (HS), the most structurally diverse sub-family of GAGs processed by NAGLU, have been in-volved in the aggregation processes of proteins including Aβpeptide, Tau, PrP andα-synuclein [6]. Furthermore, we recently demonstrated that GAGs involvement is not limited to the classi-cal aggregation process, but are needed in the cell uptake and propagation for tauopathy and synucleinopathy [22]. Tau andα-synuclein enter cells via macropinocytosis in which GAGs serve as primary receptor [23]. Then macropinosomes undergo traditional maturation and fuse with the lysosome [24].
chondroïtin sulfate (CS), are modified by MPP+stress and that changes are associated with dif-ferential expression of some specific GAGs biosynthetic enzymes. We show that the cellular GAGs regulate cathD activity, and importantly, that their presence is required forα-synuclein intracellular accumulation. Altogether, these results suggest important regulatory roles for GAGs in protein degradation/accumulation, which may thus involve them in the physiopa-thology of neurodegenerative diseases.
EXPERIMENTAL
Chemicals and reagents
Dulbecco’s Minimal Essential medium (DME), foetal bovine serum (FBS), penicillin/streptomy-cin, trypsin-EDTA solution and phosphate buffered saline (PBS) were from GibcoBRL (France). 1-Methyl-4-phenylpyridinium (MPP+), 3-(4,5-Dimethylthiazol-2-yl)-2,5-diphenyltetrazolium bromide (MTT), chondroitin sulfate (CS) heparan sulfate (HS), heparin (Hep) and CS anti-body were from Sigma (France). Anti Bax and cathD antibodies were from Santa Cruz (USA). Caspase substrates Ac-DEVD-AFC, Ac-IETD-AFC and Ac-LEHD-AFC were purchased from Calbiochem (France). CathD substrate MCA-Gly-Lys-Pro-lle-Leu-Phe-Phe-Arg-Leu-Lys(DNP)-D-Arg-NH2was purchased from Tebu-bio (France). Antiα-synuclein antibody was from
Milli-pore (France) and anti HS 10E4 from Seikagaku (Japan). Fluorescent based enzymatic assays were performed in a micro-plate reader (TECAN infinite M1000).
In vitro
α
-synuclein oligomerisation
In vitro, the spontaneous aggregation ofα-synuclein (25μg/mL) was evaluated by incubating
the protein at 37°C during 24 h in the presence or not of commercial GAGs. Then the amounts of monomeric, oligomeric and aggregated forms ofα-synuclein were estimated by western blot [5]. Briefly, samples were resolved on a 10% SDS-polyacrylamide gel and blotted onto PVDF blotting membranes. Membranes were washed with Tris-glycin buffer (25 mM Tris-HCl, 192mM glycin, pH 8) containing 0.2% Tween 20 and 5% bovine serum albumin to block the nonspecific protein binding. Membranes were incubated with monoclonal antibodies raised against humanα-synuclein antibody in Tris-buffered saline containing 0.2% Tween 20 and 0.5% nonfat dry milk for 2h at room temperature), washed five times, and then incubated with horseradish peroxidase-conjugated rabbit anti-mouse IgG (1:5000) for 1.5 h at room tempera-ture.α-synuclein was detected using the ECL method (Amersham Biosciences). Immunoblots were quantified by ImageJ software.
Cell culture and treatment
Human neuroblastoma cells SH-SY5Y (ATCC CRL2266) were cultured in DMEM containing 4.5 g/L glucose, 10% heat FBS and 100 IU/mL penicillin/streptomycin, at 37°C in humidified 95% air with 7% CO2. For stress experiments, neuroblastoma cells were plated at a density of
2.5x10⁴cells/mL. After 24 h incubation, stress was induced in the cells by treatment at 37°C for 6 h with 0.5 mM MPP+. Then, the medium was discarded and replaced by fresh medium sup-plemented or not with commercial GAGs (CS, HS or Hep). 24 h later, cells were subjected to morphological and biochemical evaluation. The synthesis of sulfated GAGs in cultured cells was inhibited with the metabolic inhibitor of sulfation, sodium chlorate (75 mM, 24 h) [22]. Medium was then discarded to induce the stress with MPP+as previously described [25]. En-dogenous cathD activity was inhibited by its specific inhibitor, pepstatin A (peps, 100μM) by
Protein extraction
Cytosolic and mitochondrial protein extracts were performed for assessing cathD and Bax lev-els after washing cells with PBS. Extracts were prepared by an incubation of 5 min at 4°C in a buffer containing 250 mM sucrose, 70 mM KCl, 137 mM NaCl, 4.3 mM NaH2PO4, 1.4 mM
KH2PO4, pH 7.2 and 100 mg/mL of digitonin. After centrifugation (10 min at 12 000 g), the
su-pernatant corresponded to the cytosolic extract and the pellet to mitochondria fraction [19]. All western blot experiments were normalized with number of cells counted by MACSQuant flow cytometer Miltenyi as described in previous studies [19]. Succinate dehydrogenase-A (SDHA) and GAPDH were used as loading controls for mitochondrial and cytosolic protein extracts in western blots.
Cathepsin D activity
Cathepsin D activity was assessed by measuring the hydrolysis of the fluorescent substrate MCA-Gly-Lys-Pro-lle-Leu-Phe-Phe-Arg-Leu-Lys(DNP)-D-Arg-NH2(20 mM) atλex 328 nm
andλem 393 nm, as previously described [19]. Endogenous cathD activity was measured in cell extracts subjected or not to MPP+stress during 6 h followed by a treatment or not with commercial GAGs. CathD activity was normalized by cell number in each sample and express-ed as percentage of the activity in normal cells. For chlorate experiments, total cell lysate frac-tions were used. In apoptosis experiments, cytosolic proteins were extracted 24 h after stress and used for the enzymatic cathD assay as previously described [19]. Briefly, the activity of ca-thepsin D was measured in cytosolic extracts obtained by incubating cells 5 min at 4°C in a buffer (250 mM sucrose, 70 mM KCl, 137 mM NaCl, 4.3 mM NaH2PO4,1.4 mM KH2PO4,
pH 7.2) containing 100mg/ml of digitonin [26]. After a centrifugation of 10 min at 12 000g, su-pernatant and the pellet corresponding to the cytosolic extract and the mitochondrial fraction were stored at -20°C until use. GAGs extracted from stressed by MPP+ or normal neuroblasto-ma cells were incubated with commercial cathD (0.5 mM) during 1 h at 37°C in presence of specific substrate and then the fluorescence was measured as previously described. In all exper-iments, pepstatin A (peps, 0.3 mM), a specific cathD inhibitor, was used to estimate specific contributions of cathD to the monitored reaction.
The capacity of catD (50 mU/mL) to processα-synuclein was measured by incubating α-synuclein (25μg/mL) at 37°C during 30 min, in the presence or not of different HS, CS and Hep
quantities. The amount of the remaining non-degradatedα-synuclein was estimated by western blot analysis and the effects of the different GAGs on the enzymatic degradation were compared.
Assessment of respiratory chain function
Oxidative phosphorylation of intact cells and oxidation of mitochondrial substrate were esti-mated by polarography in a DW1 Clark oxygen electrode (Hansatech Instruments; Norfolk, UK) using 0.006% digitonin-permeabilized cells as previously described [26]. In this system, ADP addition causes a sudden burst of oxygen uptake when the ADP is converted into ATP, characterized by an actively respiring state (state 3) followed by a slower rate when total ADP has been phosphorylated to form ATP (state 4). The ratio [state 3 rate] / [state 4 rate], called the respiratory control index (RCI), indicates the tightness of the oxidative phosphorylation, referring to the respiratory chain functionality.
Immunocytology
Triton X-100 in 1X PBS, 10% FBS. Then, cells were immunostained for 1 h 30 at RT with a pri-mary antibody againstα-synuclein (1: 500), 10E4 antibody against HS (1: 200), antibody against CS (1: 200) or antibody against cathD (1: 200). After 3 washing in PBS, immunostain-ing was revealed by 1 h incubation with an anti-rabbit Fluo 546-conjugated secondary antibody (Molecular Probes, 1:200), an anti-goat Fluo 546-conjugated secondary antibody (Interchim, 1: 200) or anti-goat Fluo 488 or an anti-mouse Fluo 488-conjugated secondary antibody (Molecu-lar Probes, 1: 200) depending on the first antibody and the second antibody for double staining. Cells were observed under confocal microscope (Zeiss Axio Observer Z.1). Negative control omitting the first antibody but in the presence of the second one did not show any signal for all the experiments.
Extraction and characterization of GAGs
Cellular GAGs were extracted, isolated and characterized from SH-SY5Y cells subjected or not to MPP+stress. At specified times, cells were treated with proteinase K (100μg/mL) during
24 h at 56°C. The enzyme was then inactivated by increasing the temperature to 90°C during 30 min. DNA was eliminated by DNase digestion (7.5 U, 24 h at 37°C). Samples were diluted 1:1 with NaCl 4 M to abolish remaining GAG-peptides interactions. Then, samples were treat-ed with cold trichloroacetic acid to 10% final concentration and lipids were removtreat-ed by chloro-form extraction (1:1). Samples were then dialyzed in buffer (50 mM Tris, 50 mM CH3COONa,
2 mM CaCl2, pH 8) twice during 3 h and then in water. After extraction, the sulfated
polysac-charides were quantified by using the cationic dye 1, 9-dimethylmethylene blue (DMMB) as previously described [27]. Then, the amount of total GAGs per 106cells and the ratio CS/HS were measured using specific enzymatic or chemical degradation as already described [28]. Briefly, HS was quantified by DMMB assay after digesting CS with chondroitinase ABC (20 mU, 37°C, 1 h 30). For CS quantification, a nitrous acid treatment was used to selectively depolymerized HS from total GAGs samples. This treatment consisted in adding 0.25 M NaNO2(100μL) and acetic acid 33% (100μL) to the samples, in order to carry out chemical
di-gestion for 1 h at RT, followed by the addition of ammonium sulfamate (100μL, 14%) to stop
the reaction. After HS digestion, the DMMB assay was performed, then remaining CS were quantified and expressed as percentage of total GAG amount per 106cells.
For HS or CS disaccharides analysis, after the selected digestion, the degraded GAGs were eliminated by dialysis in buffer (50 mM Tris, 50 mM CH3COONa, 2 mM CaCl2, pH 8) twice
during 6 h and then in water. After lyophilization, specific disaccharides were obtained by sam-ple treatment with either heparinase I, II, and III (AMSBio, U.K.) cocktail (0.25 mU each, 24 h, 37°C) for HS disaccharides analysis or chondroitinase ABC (Sigma-Aldrich) (20 mU, 90 min, 37°C) for CS disaccharides analysis. Samples were analyzed by HPLC as previously described [29] with some modifications. Briefly, 50μL of sample was loaded onto a Propac PA-1 (Dionex)
strong-anion exchange column eluted by a NaCl-solvent gradient (0.1 to 1 M). Post-column in-line modification was realized by mixing 2-cyanoacetamide solution (2% v/v) and 250 mmol/L NaOH supplied both at 0.25 mL/min. The mixture passed through a reaction coil set in an oven at 120°C, followed by a cooling coil and then fluorescence was monitored (λ= 346 nm excita-tion,λ= 410 nm emission). Areas under curve were measured and the percentage of each disac-charide in sample was calculated relative to external standards.
Real time RT-PCR
concentration of 40 mg/mL of total RNA. Then, the reverse transcription reaction was per-formed on 1μg of total RNA by using oligo dT primers and the Superscript III preamplification
system (Invitrogen, France) according to the manufacturer’s instructions. Gene expression was quantified by real-time PCR using the LightCycler Fast DNA Master (Roche, France) with 2μL
cDNA corresponding to 200 ng total RNA, 4 mM magnesium chloride and 0.5μM primer
(final concentration,S1 Table). Briefly, quantitative PCR was performed for 45 cycles at 95°C for 15 sec, at the specific annealing temperature for 25 sec and at 72°C for 30 sec. Amplification specificity was checked using a melting curve following the manufacturer’s instructions. Results were analyzed with the LightCycler software v3.5 (Roche, France) using the second derivative maximum method to set the threshold cycle (Ct). As we previously described [28], the quanti-tative analysis was carried out using standard curves and were normalized using GeNorm soft-ware and methodology [30]. Three different housekeeping genes were used (Glutamine synthetase, GAPDH andα-tubulin).
Data analysis
Group data are expressed as mean ± S.E.M. Comparisons among groups were made by ANOVA (F-test), Bonferroni adjusted t-tests were used for multiple group comparisons, and unpaired t-test was used for single comparisons. A two-tailed p<0.05 was selected to indicate a statistical
significant difference. All values were calculated using GraphPad Prism 5.00 (GraphPad Soft-ware, San Diego, CA).
RESULTS
In vitro
interaction of glycosaminoglycans with
α
-synuclein and
cathepsin D
Glycosaminoglycans modulation ofα-synuclein oligomerisation in vitro. The ability of
GAGs to increase oligomerisation ofα-synucleinin vitrowas investigated using commercial GAGs (Fig. 1a). After 24 h of incubation,α-synuclein was detected as monomers (9±1.1%), di-mers (47±3.5%) and oligodi-mers (44±2.4%). In the presence of 1μg/mL of Hep, most of the
α-synuclein was monomeric (75%) and 25%, oligomeric. In contrast, co-incubation ofα -synu-clein with HS or CS did not increase the proportion of dimers, while monomers represented only 25% and oligomers 20 to 35% ofα-synuclein forms. Increasing Hep concentrations (10 and 100μg/mL) rose the percentage ofα-synuclein dimers, whereas the oligomers formation was
greater at higher CS concentrations. Interestingly, in the presence of 10 and 100μg/mL HS, the
percentage of dimers and monomers was amplified whereas the oligomeric forms ofα-synuclein tended to decrease.
Glycosaminoglycans modulation ofα-synuclein degradation by cathepsin Din vitro.In
vitro, cathD degraded recombinantα-synuclein in a dose-dependent manner with an EC50of
1.97 mU/mL (S1 Fig.) whereas this degradation activity was totally inhibited by its specific in-hibitor pepstatin A (peps, 0.3mM,Fig. 1b). Interestingly, thein vitrodegradation ofα-synuclein by cathD was inhibited by 100μg/mL Hep and CS but not by HS. These results suggest that
GAGs, depending on their chemical structure, differentially regulate cathD activity.
Cellular model characterization
the localization of cathD by confocal microscopy (Fig. 2b) in MPP+-treated cells compared to unstressed control cells. In MPP+-stressed cells, cathD seemed to be more present in the cyto-solic compartment whereas in control cells, staining appeared more punctuated, consistent with the lysosomal storage of the protease. CathD release into the cytosol leads, by an unknown mechanism, to Bax activation and to its relocation into mitochondria, which mediates apopto-sis [19,31]. Bax relocation in the mitochondrial membrane was detected by western blot at the end of the stress period induced by MPP+treatment (Fig. 2c). The significant increase of Bax in the mitochondrial membrane of stressed cells indicated that MPP+exposure effectively in-duced Bax activation, leading to a 50% inhibition of the respiratory control index compared to
Figure 1. Glycosaminoglycans modulation ofα-synuclein aggregation and degradation by cathepsin Din vitro.a)In vitroα-synuclein aggregation in the presence of different GAGs. Commercialα-synuclein
(25μg/mL) was incubated 24 h at 37°C in the presence of 1, 10 or 100μg/mL of commercial Hep, CS or HS.
Monomeric, dimeric and oligomeric forms ofα-synuclein were detected by western blot and quantified with ImageJ software. b)Inhibition of cathD degradation ofα-synuclein by different commercial GAGs.α-synuclein was incubated in the presence of cathD (50 mU/mL) and pepstatin A, Hep, HS or CS (100μg/mL) during 30 min at 37°C. Residualα-synuclein was detected by western blot and quantified with ImageJ software. Results are presented as the mean±S.E.M.***p<0.01 compared to control.
unstressed control cells (Fig. 2d). These events are typical markers of the intrinsic pathway of apoptosis that were confirmed by caspase-9 and -3 activation (S2 Fig.).
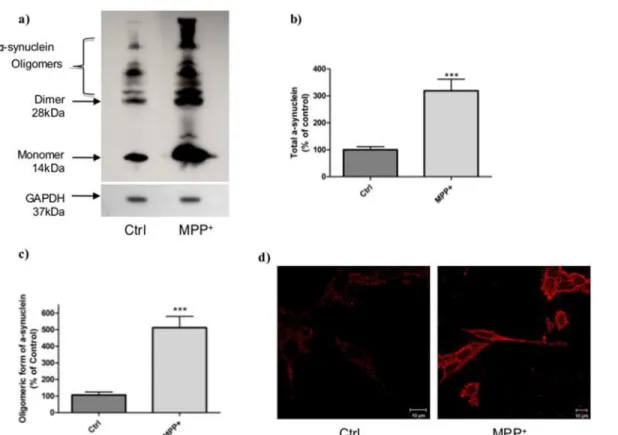
MPP+induction of intracellularα-synuclein accumulation.To determine whether MPP+
treatment could induce other modifications, we comparedα-synuclein levels by Western Blot (Fig. 3a). A significant 3-fold increase in totalα-synuclein (Fig. 3b) and 5-fold increase in oligo-meric forms were observed in stressed cells compared to control cells (Fig. 3c). Intracellular α-synuclein, assessed by immunostaining (Fig. 3d), was also modified in controlvs. stressed cells. Indeed, in control cells,α-synuclein was localized in punctuated forms distributed in the cytosol whereas in stressed cells, the protein was clearly more expressed and everywhere at the intracellular level.
Consequences of MPP+stress on glycosaminoglycans and their biosynthesis.In order to test whether MPP+affected GAGs amounts, species and structure in our stress cell model, GAGs were extracted and characterized. Total GAGs and HS/CS amounts were quantified by using selective enzymatic treatments and the cationic dye DMMB assay [27,28]. After treat-ment by MPP+, total sulfated GAGs raised to 1.85±0.27μg/106cells (Table 1) compared to
Figure 2. Characterization of MPP+-induced apoptosis.Total, mitochondrial and cytosolic extracts were obtained from normal and MPP+
-stressed SHSY5Y cells (0.5 mM, 6 h).a) CathD activity in cytosolic extracts. CathD activity was normalized by cell number in each sample and expressed as percentage of the activity in normal cells. Results are expressed in percentage of normal cell extract levels and presented as mean±S.E.M. of four
independent experiments in triplicate.***p<0.01 compared to control cells. b) Immunofluorescence detection of total cathD in cells. Left: unstressed control
cells (Ctrl), right: MPP+-stressed cells (6 h). Cells were observed with a confocal microscope Zeiss Axio Observer Z.1. Scale bar represents 10μm. Negative control omitting the first antibody but in the presence of the second one (anti-goat Fluo 546) did not show any signal. c) Analysis by western blot of Bax relocation in mitochondrial membranes at 6 h, just after the end of stress. The amount of protein was normalized by the number of cells to avoid taking into account the increase of protein amount induced by the MPP+stress. Succinate dehydrogenase-A (SDHA) was used as the loading control. This immunoblot
is representative of three independent experiments in duplicate. d) Assessment of respiratory chain function 24 h after MPP+treatment. The respiratory control index (RCI) i.e. ratio [state 3 rate] / [state 4 rate] was calculated. Results are expressed as percentage of unstressed control group and represent three independent experiments in triplicate. Results are presented as the mean±S.E.M.***p<0.01 compared to control cells.
1.26±0.14μg/106cells in control unstressed cells, corresponding to 1.5 fold increase. Among
these, HS increased from 55 to 67%, whereas CS decreased from 45 to 33% in MPP+-stressed cells (Table 1). Moreover, the disaccharide composition of HS and CS was modified by MPP+ treatment. In HS extracted from MPP+-stressed cells, the percentage of non-sulfated GAGs sig-nificantly decreased by 8%, whereas the proportion of Mono-D and Di-S increased. In CS, the non-sulfated disaccharides decreased significantly from 58.3±6.9% to 39.1±5.5%, while Mono, Di and Tri-sulfated disaccharides percentages were increased.
Figure 3. Characterization ofα-synuclein aggregation in cells after MPP+stress.a) Typical immunoblot ofα-synuclein in stressed (MPP+, 6h)) and
unstressed (Ctrl) cells. b) Total and c) oligomeric forms ofα-synuclein measured on stressed (MPP+) and unstressed (Ctrl) cells by Western Blot and
quantified by ImageJ software. This immunoblot represents three independent experiments and is expressed as the mean±S.E.M.***p<0.01 compared to
control cells. GAPDH was used as loading control. d)α-synuclein aggregation immunostaining withα-synuclein antibody in unstressed cells (Ctrl) and MPP+
-stressed cells. Cells were observed with a confocal microscope Zeiss Axio Observer Z.1.
doi:10.1371/journal.pone.0116641.g003
Table 1. Glycosaminoglycans in control and MPP+-stressed cells.
Total GAGs (μg/106cells) HS/CS (% of total GAGs)
Disaccharides (% of total amount)
Non-Sulfated MonoSulfated DiSulfated TriSulfated
Control 1.26±0.14 HS 55±4.7 89.15±5.31 - 9.15±4.50
-CS 45±3.8 58.33±6.99 8.72±1.44 29.50±3.88 3.20±2.00 MPP+ 1.85±0.27
** HS 67±5.1* 81.10±5.32* 1.57±0.54 14.13±4.71* 0.08±0.02
CS 33±4.0* 39.13±5.56** 12.30±2.39* 43.45±1.04** 5.10±2.10
*p<0.01,
In the same conditions of stress, the gene expression of enzymes involved in GAGs biosyn-thesis was studied (Fig. 4). Among the 24 genes screened, only Hs2st, Hs6st1, Chst8 and Chst8 var3, were significantly increased compared to control cells whereas Hs3st5, Chst12 and Chst14 remained unchanged. The expression levels of all the other genes encoding GAGs bio-synthetic enzymes were decreased by less than 2 fold, except Hs3st6 and Chst10, which expres-sion decreased over 4-fold. Interestingly, the expresexpres-sion level of HS degrading enzyme, heparanase, was also decreased by 2 fold. Thus, the stress induced by MPP+modified both HS and CS structure and quantity, partly through the regulation of GAGs biosynthetic
enzymes expression.
Glycosaminoglycans roles in MPP
+cellular model
Regulation of cathepsin D activity by glycosaminoglycans. At the end of sodium chlorate treatment (0 h,Fig. 5a), by which cell viability was shown unaffected, the absence of sulfated GAGs obtained by the inhibition of the sulfate donor PAPS was confirmed by quantification using the DMMB test [22]. Thus, neo-synthesis of sulfated GAGs occurred and their amounts showed a remarkable 4-fold increase, from 20% at 3 h reaching to 80% of the normal amount in control cells after 6 h (Fig. 5a). The sodium chlorate treatment did not induce caspase-9 and -3 activations, but increased total cathD activity in cells from 160% at 0 h, to 250% at 3 h, which then decreased to 180% after 6 h (Fig. 5b). The ability of GAGs extracted from cells to inhibit cathD activity was investigated in various experimental conditions, i.e. control,
Figure 4. GAGs metabolism in normal and MPP+-stressed cells.Analysis of enzymes involved in GAGs
metabolism by Real Time PCR. Real time PCR of Hs2st, Hs3st1, Hs3st2, Hs3st3, Hs3st3A1, Hs3st3B1, Hs3st4, Hs3st5, Hs3st6, Hs6st1, Hs6st2vL, Hs6st2vS, Hs6st3, NDTS1, NDST2, NDST3, NDST4, Chst8 v1 and v2, Chst8 v3, Chst10, Chst11, Chst12, Chst14, epimerase and heparanase were performed with RNA extracts from MPP+-stressed (24 h) and normal cells. Values were normalized using geNorm software, an
accurate normalisation of gene expression with multiple references genes [30]. The following reference genes glyceraldehyde 3-phosphate dehydrogenase (GAPDH), glutamine synthetase and alpha-tubulin were used. Each measure is the mean +/- S.E.M. from measurements performed on 3 independent cultures.
*p<0.01 compared to control cells. Light grey bars: HS biosynthesis enzymes; dark grey bars: CS
biosynthesis enzymes; white bar: HS degradation enzyme.
MPP+-stressed and 3 or 6 h after sodium chlorate treatment (Fig. 5c). CathD activity was not significantly modified by the presence of GAGs extracted from stressed and unstressed cells at doses up to 1μg/mL in the reaction media. However, at higher amounts of GAGs, an important
decrease of cathD activity was induced, from 19–23% at 2μg/mL reaching 28–35% at 7μg/mL
Figure 5. Regulation of cathepsin D activity by glycosaminoglycans.a) SH-SY5Y cells were treated with sodium chlorate (75 mM) during 24 h and sample were extracted at different times after sodium chlorate removal. GAGs amounts were measured in cells after 0, 1, 3 and 6 h after the end of the chlorate treatment. Results are presented as mean±S.E.M. of three independent experiments in triplicate.***p<0.001 compared to control. b) Total cathD activity
was measured at different times after sodium chlorate removal (75 mM, 24h). Results are expressed in percentage of cathD in normal cell extract and presented as mean±S.E.M. of three independent experiments in triplicate.***p<0.001 compared to control cells. c) GAGs were extracted from control,
MPP+-stressed cells, chlorate treated cells 3 and 6 h after chlorate removalas described in Material and Methods. GAG amounts were measured by DMMB
assay [27]. The activity of cathD was measured in the presence of various concentrations of these extracted GAGs (white bars: 1μg/mL; light grey2μg/mL, medium grey:5μg/mL and dark grey: 7μg/mL) and expressed as the percentage of the specific CathD activity. Results are mean±S.E.M. of three independent experiments in duplicate.**p<0.005;***p<0.001 compared to control cathD activity,ψp<0.01;ψψp<0.005;ψψψp<0.001 compared to results obtained
with 1μg/mL of GAGs,ΦΦp<0.005 comparison between 3 and 6 h extracted GAGs. d) Total cathD activity was measured after different times (0, 1, 3 and 6 h)
of treatment with MPP+(0.5 mM) with or without pre-treatement of cell with chlorate (75 mM, 24h). CathD activity was normalized by cell number in each
sample and expressed as percentage of the activity in normal cells.**p<0.005;***p<0.001 compared to control. e) CathD activity in cells subjected or not to
MPP+stress (6 h) and followed by commercial GAGs treatment (Hep, HS and CS, 1μg/mL). After 24 h, GAGs effects were compared to the complete inhibition of cathepsin activity by pepstatin A (peps), a specific inhibitor of this enzyme and expressed as percentage of cathD activity in control cells.
(Fig. 5c). Surprisingly, 1μg/mL of GAGs extracted after chlorate withdrawal, induced a
dra-matic 1.3-fold increase of cathD activity between 3 and 6 h. The increase in concentration of these particular GAGs induced a dose-dependent reduction of cathD activity, reaching 113% and 133% at 7μg/mL of GAGs at 3 and 6 h, respectively (Fig. 5d). This puts forward for
consid-eration a fine structure activity relationship, where both sulfation and concentration of these sulfated GAGs, seem to play an important role. Cell treatment with MPP+increased time-dependently intracellular cathD activity, with a maximum effect of 372% at 6 h (Fig. 5d). Pre-treatment of cells by sodium chlorate before MPP+exposure, maintained cathD activity at low levels for up to 3 h, whereas an important increase (306%) was observed at 6 h.
In order to evaluate the effect of the sulfation level and patterns, we tested the effect of cell exposure to different natural GAGs after MPP+stress on cellular cytosolic cathD (Fig. 5e). The increase of cathD activity induced by MPP+can be efficiently inhibited by cell treatment with HS, and to a lesser extent by CS and Hep. Taken together, these data put forward the impor-tance of the intracellular sulfated GAGs for the regulation of cathD activity.
Importance of glycosaminoglycans sulfation onα-synuclein accumulation. As
exogenous-ly added GAGs modulated CathD activity in MPP+-stressed cells (Fig. 5e), we examined the im-portance of GAGs sulfation onα-synuclein accumulation. In sodium chlorate-treated cells, α-synuclein was almost completely undetectable by immunostaining and western blot (Fig. 6a– -b). In contrast, 6 h of MPP+stress induced an important increase of intracellularα-synuclein as seen by western blot (170%), and by immunostaining. Pre-treatment with sodium chlorate be-fore MPP+stress caused a significant reduction ofα-synuclein amount (from 170 to 130%) compared with MPP+-treated cells, without restoring the level of unstressed cells. Interestingly, the inhibition of endogenous cathD activity by pepstatin A preventedα-synuclein degradation (Fig. 6b) leading to dimers and oligomers amounts close to those observed with the MPP+ treat-ment. Moreover, thisα-synuclein accumulation induced by MPP+was increased 4 fold (400%) after 24 h, but could be reduced to 174% by Hep treatment just after MPP+-stressed period (Fig. 6c). In these experimental conditions, HS and CS were unable to interfere on the increase ofα-synuclein induced by MPP+, whereas all these GAGs had no effect onα-synuclein in nor-mal unstressed cells.
Co-localization of cathepsin D, glycosaminoglycans andα-synuclein in MPP+-stressed cells.As regulation of cathD by GAGs through their sulfation pattern was suggested to modu-lateα-synuclein accumulation/degradation (Figs.2,5,6) we investigated whether they could co-localize in cells.
Whereas the double labeling showed distinct localizations for cathD andα-synuclein in nor-mal cells (Fig. 7a), in contrast, cathD andα-synuclein partly co-localized in MPP+-stressed cells. Concerning GAGs, the double labeling revealed that cathD did not co-localize with HS and CS in normal cells, whereas in MPP+-treated cells, in which the amounts of both GAGs and cathD were enhanced, an important co-localization appeared (S3 Fig.). Interestingly, the poor labeling of CS in normal cells and the peri-nuclear location of CS in MPP+-stressed-cells, did not colocalize withα-synuclein whatever the cell status (Fig. 7b). By contrast, HS only colo-calized withα-synuclein in MPP+-stressed cells (Fig. 7c), suggesting the presence of HS in the cytosol and the existence of a complex HS-α-synuclein.
DISCUSSION
presence of GAGs in LB, where they can interact withα-synuclein, notably at an early stage of aggregation, prior to fibrillation [34]. With the aim of studying early stage of PD, characterized by the presence of mono-, di- and oligomericα-synuclein forms, we used a semi-quantitative western-blot method, able to detect very low amount ofα-synucleinoligomers compared to other classical methods [35].In vitro, using this method, we confirmed that GAGs can modu-late theα-synuclein transition between these forms that are resistant to SDS exposure during
Figure 6. Effect of glycosaminoglycans sulfation onα-synuclein accumulation.a) Totalα-synuclein accumulation was detected after 6 h in normal (Ctrl) or MPP+-treated cells and after chlorate treatment (75 mM, 24h).α-synuclein aggregation was visualized by immunostaining. Cells were observed with
a confocal microscope Zeiss Axio Observer Z.1. b) Western blot analysis of totalα-synuclein in lysate of cells subjected or not to MPP+stress (6 h) after
treatment with sodium chlorate (75 mM, 24h) or the specific inhibitor of cathD, pepstatin A (Peps) (100μM, 24h). Intensities of the bands obtained by western blot were quantified by ImageJ software and represent three independent experiments and are expressed as the mean±S.E.M.***p<0.001 compared to
control cells. GAPDH was used as the loading control. c) Amounts of totalα-synuclein in cells subjected or not to MPP+stress (6 h) and followed by
commercial GAGs treatment (Hep, HS and CS, 1μg/mL). After 24 h,α-synuclein was detected by western blot and quantified with ImageJ software.
Figure 7. Co-localization of cathepsin D, glycosaminoglycans andα-synuclein in MPP+-stressed cells.a) Immunofluorescence detection of CathD (green) andα-synuclein (red) in unstressed (Ctrl) and MPP+-stressed cells (6 h). b) Immunofluorescence co-labeling of CS (green) andα-synuclein (red) in normal
(Ctrl) and MPP+-stressed cells (6 h). c) Immunofluorescence co-labeling of HS (green) andα-synuclein (red)
in normal (Ctrl) and MPP+-stressed cells (6 h). Observations were done with a confocal microscope Zeiss
Axio Observer Z.1. Stars and arrows indicate areas where co-localization is observed.
Western-blot.In vitro, increasing concentrations of Hep and HS, to a lesser extent, both aug-ment the proportion of dimers, whereas CS induces the increase of oligomers. Thus, thein vitro ability ofα-synuclein to form dimers/oligomers, appears to be differently regulated by GAGs compositions and concentrations.In vivo, oligomerisation and aggregation ofα-synuclein are more complex, probably involving unknown enhancers/processes of aggregation and an im-pairment of its clearance that may be caused by alterations in the UPS or the ALP [9]. Recently, studies suggested that the UPS is the main degradation pathway forα-synuclein under normal conditions, while the ALP is recruited when theα-synuclein expression is increased [11]. Among the most powerful hydrolytic enzymes in lysosomes is cathD, a major intracellular as-partic protease, described as the mainα-synuclein degrading enzyme [14].
In vivo, cathD is classically involved in apoptosis through its release from lysosome and its activation of the pro-apoptotic protein Bax in the cytosol. In this study, we used the gold stan-dard of toxin-based PD models by treating neuroblastoma cells with the MPTP metabolite MPP+, a potent mitochondrial complex I inhibitor. For the first time, we demonstrate that a time-dependent increase of cathD activity and expression occurs in MPP+-stressed cells. A 6 hour MPP+treatment is sufficient to activate the intrinsic pathway of apoptosis characterized by cytosolic cathD release, Bax translocation and caspase-9 and -3 activation. The mitochon-drial dysfunction observed after MPP+treatment, with the decrease of the respiratory control index (RCI), also suggests the inhibition of complex I and the overproduction of reactive oxy-gen species [36] leading to lysosomal membrane disruption and release of cathD [19]. This in-crease of lysosomal membrane permeabilization, resulting in the collapse of lysosomal
function, was suggested to end up with the impairment of cytoprotective autophagy and neuro-nal cell death in a model of PD [37]. In the cytosol, cathD activates Bax by an unknown mecha-nism that can induce, in a vicious circle, the collapse of mitochondrial membrane potential and the release of cytochrome c. Similarly, the up-regulation of cathD recently observed in the cau-date nucleus of rhesus monkeys treated chronically by MPTP, correlated with cellular damages leading to typical caspases activation of apoptosis [17] and thus corroborates our results. Re-markably, we observed the concomitant and significant increase ofα-synuclein accumulation at the intracellular level. This highlights the discrepancy between the presence of cathD and its inefficiency to preventα-synuclein accumulation, and suggests the existence of a fine control of the protease activity by endogenous systems, including natural inhibitors. Interestingly, western-blotting assay ofα-synuclein was performed in the presence of SDS, which cannot dis-sociate oligomers ofα-synuclein as previously described by Tsika et al [38]. Furthermore, the molecular weight bands patterns corresponding to dimers, trimers, and multimers ofα -synu-clein and resistant to SDS detected in our cellular study, were similar to those described in α-synuclein sample extracted from different mouse brain areas [38]. This strengthens the inter-est of our cellular model induced by MPP+cell exposure to study the regulation ofα-synuclein accumulation and early stage of oligomerisation processes.
the expression of Hs2st1 and Hs6st1, two genes involved in the first steps of sulfation in HS biosynthesis and HS disaccharide analysis after MPP+stress period, whereas all the others genes were down-regulated, clearly supports the modification of the sulfation patterns in HS. Indeed, Hs2st1 transfers the sulfo group to the 2-OH position of iduronic acid (IdoA) or glucu-ronic acid (GlcA) within HS, whereas Hs6st1 catalyzes a 6-Osulfation ofN-acetylglucosamine (GlcNAc). Interestingly, the expression of these two genes that was shown to be regulated by oxidative stress in a skin keratinocyte cell line [40], correlated with the increase of Di and Tri-sulfated HS-disaccharides measured after MPP+exposure. Thus, the increase of HS amount can be associated with a modification of HS sulfation pattern.
In contrast, after MPP+stress, enzymes of CS biosynthesis were down-regulated, correlating with CS amount measurement, except Chst8 that was over-expressed suggesting a modification of sulfation pattern reinforced by the variation of Mono, Di and Tri-sulfated disaccharides mea-sured in MPP+-stressed extracted GAGs. The full-length Chst8 protein classically has a GalNAc-4-sulfotransferase activity and transfers a sulfate group to the carbon 4 ofN-acetylgalactosamine (GalNAc) residues ofN-glycoproteins, whereas the truncated form of Chst8 does so to the car-bon 4 of GalNAc residues of CS chains [41]. This could be of importance if we consider that these 4-sulfated CS-A, mainly present in adulthood, [42] are described to inhibit axon regenera-tion [43]. Moreover, the down-regularegenera-tion of this 4-O-sulfaregenera-tion was suggested to be linked with PrP(sc) accumulation in Creutzfeldt-Jacob disease [44]. However, in our experiment, extracted GAGs from both normal and MPP+-stressed cells did not modify cathD activityin vitrowhen they were used at 1μg/mL (although the nature of these GAGs is likely different), whereas at
higher concentrations, they inhibited cathD activity. Noteworthily, neo-synthesized GAGs after complete unsulfation with sodium chlorate treatment, markedly increased cathD activity at 1μg/mL, while higher concentrations of GAGs were less efficient to stimulate cathD activity.
Consequently, the increase of GAGs amount induced by MPP+stress or the neosynthesis of GAGs after chlorate treatment suggest a complex and sophisticated balance between the exis-tence of specific sulfation pattern in GAGs and the importance of intracellular GAGs amount to explain their specificity of effects at the intracellular level.
We recently described heparan sulfate proteoglycans as critical mediators of cell uptake by macropinocytosis and seeding of tau aggregate andα-synuclein fibrils [22]. The mature macro-pinosomes containing both heparan sulfate proteoglycan, i.e. GAGs, andα-synuclein, were de-graded afterwards in the late endosomes lysosomes. Thus, the presence of GAGs and cathD together in lysosomes supports the hypothesis that cathD activity andα-synuclein accumula-tion could be regulated by GAGs. This idea is reinforced by the recent discovery of mutaaccumula-tions in the NAGLU gene in Sanfilippo syndrome and PD [21], resulting in the accumulation of par-tial HS chains within the lysosomes as a consequence of the disruption of their degradation. Re-markably, in our cellular model, sulfated GAGs amount dramatically increased after MPP+ stress, probably, and partly, through the inhibition of heparanase expression. The abolition of sulfation in GAGs increased cathD activity and abolished almost completely intracellular α-synuclein amount, which reinforces the potential regulation of these events by GAGs. The colocalization studies in MPP+-stressed cells suggest a potential association of GAGs with cathD orα-synuclein, resulting inα-synuclein detection, whereas in the absence of GAGs/ cathD co-localization i.e. in normal cells,α-synuclein is not detected, probably due to its degra-dation by cathD. Moreover, the co-labelling of HS withα-synuclein on the one hand, the co-localization ofα-synuclein and CathD on the other hand, and the increase of CathD activity in cytosolic extract of MPP+-stressed-cells suggests the presence of HS in cytosolic compartment associated with cathD andα-synuclein.
mainly sulfation patterns, bothα-synuclein accumulation in lysosomes and pro-apoptotic cathD activity in cytosol. These results are of interest to understand the pathological processes of spreading in synucleinopathies, considering the role of GAGs, mainly HS, in cell uptake of α-synuclein [22]. MPP+exposure increasing the sulfation of HS, which delays pro-apoptotic activity of cathD and reduces theα-synuclein degradation, leads to an increase ofα-synuclein accumulation and facilitates the spreading from cell to cell.
In conclusion, this study describes cathD and GAGs as new molecular actors in MPP+ toxici-ty. Furthermore, GAGs are proposed for the first time, as new and major actors in the lysosome degradation pathway, by regulating cathD activity and affecting two main biological processes, protein aggregation/degradation—in our caseα-synuclein—and apoptosis (Fig. 8). These find-ings strengthen the interest on the regulation of lysosomal biogenesis and functions occurring in neurodegenerative disorders, particularly those withα-synuclein accumulation and aggrega-tion, or with GAGs degradation and storage impairment [21]. Indeed, the demonstration that cathD activity is regulated by endogenous GAGs and the consequences of this regulation on α-synuclein accumulation highlight the importance of glycobiology in neurodegenerative disor-ders such as PD, and potential developments of new therapeutic strategies.
Supporting Information
S1 Table. Primers sequences used in Real time RT-PCR.
(TIF)
S1 Fig.α-synuclein degradation by cathepsin D.α-synuclein degradationin vitroin the
pres-ence of different concentrations of cathD during 30 min at 37°C. The residual amount of α-synuclein was detected by western blot and quantified with ImageJ software. Results were represented as percentage of control (100% was obtained in the presence of pepstatin A (peps), a specific inhibitor of cathD). Results are presented as the mean ± S.E.M.
(TIF)
Figure 8. Interplay between CathD, glycosaminoglycans (heparan sulfate (HS), chondroitin sulfate (CS)) andα-synuclein on MPP+-stressed cells.
See details in the text.
S2 Fig. Caspase-3 and -9 activities.Caspase-9 and -3 activities were measured at 6 and 24 h, respectively after the end of MPP+treatment, using a specific fluorescent substrate, Ac-LEHD-AFC for caspase-9 (a) and Ac-DEVD-Ac-LEHD-AFC as substrate for caspase-3 (b). Results are expressed as percentage of unstressed control group and represent three independent experiments in trip-licate. Results are the mean ± S.E.M.p<0.01 compared to control cells. Cells treated under
various conditions were harvested through trypsinization and washed with PBS. The cell pellet was gently suspended in buffer containing 30 mM HEPES, 0.3 mM EDTA, 100 mM NaCl, 0.15% Triton X-100 and 10 mM DTT and centrifuged. The supernatant was used for the assay. Caspases substrates were added to a final concentration of 100 mM. The plate was covered, gently mixed and incubated at 37°C for 1 h. Then samples were measured atλex400 nm and λem505 nm in a fluorescent microplate reader (TECAN infinite M1000).
(TIF)
S3 Fig. Co-localization of cathepsin D and glycosaminoglycans in MPP+-stressed cells.
Immunofluorescence co-labeling of cathD (green) and endogenous HS-CS (red) in normal (Ctrl) and MPP+-stressed cells (6 h). Observations were done with a confocal microscope Zeiss Axio Observer Z.1. Stars and arrows indicate areas where co-localization is observed.
(TIF)
Acknowledgments
We thank Dr. Pierre Rustin (INSERM U676, Robert Debré, Paris France) for his helpful discus-sion on mitochondrial and apoptosis investigations.
Author Contributions
Conceived and designed the experiments: SLB CM DPG. Performed the experiments: SLB CM EH MOO VBC. Analyzed the data: SLB CM LGA. Contributed reagents/materials/analysis tools: RRV CM SLB LGA DPG. Wrote the paper: SLB CM LGA.
References
1. Henchcliffe C, Beal MF (2008) Mitochondrial biology and oxidative stress in Parkinson disease patho-genesis. Nat Clin Pract Neurol 4: 600–609. doi:10.1038/ncpneuro0924PMID:18978800
2. Dawson TM, Ko HS, Dawson VL (2010) Genetic animal models of Parkinson’s disease. Neuron 66: 646–661. doi:10.1016/j.neuron.2010.04.034PMID:20547124
3. Engelender S (2008) Ubiquitination of alpha-synuclein and autophagy in Parkinson’s disease. Autop-hagy 4: 372–374. doi:10.4161/auto.5604PMID:18216494
4. Dauer W, Kholodilov N, Vila M, Trillat AC, Goodchild R, et al. (2002) Resistance of alpha -synuclein null mice to the parkinsonian neurotoxin MPTP. Proc Natl Acad Sci U S A 99: 14524–14529. doi:10.1073/ pnas.172514599PMID:12376616
5. Kalivendi SV, Cunningham S, Kotamraju S, Joseph J, Hillard CJ, et al. (2004) Alpha-synuclein up-regulation and aggregation during MPP+-induced apoptosis in neuroblastoma cells: intermediacy of
transferrin receptor iron and hydrogen peroxide. J Biol Chem 279: 15240–15247. doi:10.1074/jbc. M312497200PMID:14742448
6. Papy-Garcia D, Morin C, Huynh MB, Siñeriz F, SISSOEF L, et al. (2011) Glycosaminoglycans, protein aggregation and neurodegeneration. Curr Protein Pept Sci 12: 258–268. doi:10.2174/
138920311795860188PMID:21348835
7. Chu Y, Dodiya H, Aebischer P, Olanow CW, Kordower JH (2009) Alterations in lysosomal and protea-somal markers in Parkinson’s disease: relationship to alpha-synuclein inclusions. Neurobiol Dis 35: 385–398. doi:10.1016/j.nbd.2009.05.023PMID:19505575
8. Rott R, Szargel R, Shani V, Bisharat S, Engelender S (2013) alpha-Synuclein Ubiquitination and Novel Therapeutic Targets for Parkinson’s Disease. CNS Neurol Disord Drug Targets.
10. Bandopadhyay R, de Belleroche J (2010) Pathogenesis of Parkinson’s disease: emerging role of mo-lecular chaperones. Trends Mol Med 16: 27–36. doi:10.1016/j.molmed.2009.11.004PMID:20036196 11. Ebrahimi-Fakhari D, Cantuti-Castelvetri I, Fan Z, Rockenstein E, Masliah E, et al. (2011) Distinct roles
in vivo for the ubiquitin-proteasome system and the autophagy-lysosomal pathway in the degradation of alpha-synuclein. J Neurosci 31: 14508–14520. doi:10.1523/JNEUROSCI.1560-11.2011PMID: 21994367
12. Rubinsztein DC (2006) The roles of intracellular protein-degradation pathways in neurodegeneration. Nature 443: 780–786. doi:10.1038/nature05291PMID:17051204
13. Terman A, Gustafsson B, Brunk UT (2006) The lysosomal-mitochondrial axis theory of postmitotic aging and cell death. Chem Biol Interact 163: 29–37. doi:10.1016/j.cbi.2006.04.013PMID:16737690 14. Sevlever D, Jiang P, Yen SH (2008) Cathepsin D is the main lysosomal enzyme involved in the degra-dation of alpha-synuclein and generation of its carboxy-terminally truncated species. Biochemistry 47: 9678–9687. doi:10.1021/bi800699vPMID:18702517
15. Cullen V, Lindfors M, Ng J, Paetau A, Swinton E, et al. (2009) Cathepsin D expression level affects alpha-synuclein processing, aggregation, and toxicity in vivo. Mol Brain 2: 5. doi: 10.1186/1756-6606-2-5PMID:19203374
16. Qiao L, Hamamichi S, Caldwell KA, Caldwell GA, Yacoubian TA, et al. (2008) Lysosomal enzyme ca-thepsin D protects against alpha-synuclein aggregation and toxicity. Mol Brain 1: 17. doi:10.1186/ 1756-6606-1-17PMID:19021916
17. Yelamanchili SV, Chaudhuri AD, Flynn CT, Fox HS (2011) Upregulation of cathepsin D in the caudate nucleus of primates with experimental parkinsonism. Mol Neurodegener 6: 52. doi: 10.1186/1750-1326-6-52PMID:21777416
18. Avila JL, Convit J (1976) Physicochemical characteristics of the glycosaminoglycan-lysosomal enzyme interaction in vitro. A model of control of leucocytic lysosomal activity. Biochem J 160: 129–136. PMID: 12748
19. Yue XL, Lehri S, Li P, Barbier-Chassefiere V, Petit E, et al. (2009) Insights on a new path of pre-mito-chondrial apoptosis regulation by a glycosaminoglycan mimetic. Cell Death Differ 16: 770–781. doi: 10.1038/cdd.2009.9PMID:19229249
20. Zhang G, Morin C, Zhu X, Bao Huynh M, Ouidir Ouidja M, et al. (2013) Self-evolving oxidative stress with identifiable pre- and postmitochondrial phases in PC12 cells. J Neurosci Res 91: 273–284. doi: 10.1002/jnr.23146PMID:23161662
21. Winder-Rhodes SE, Garcia-Reitbock P, Ban M, Evans JR, Jacques TS, et al. (2012) Genetic and path-ological links between Parkinson’s disease and the lysosomal disorder Sanfilippo syndrome. Mov Dis-ord 27: 312–315. doi:10.1002/mds.24029PMID:22102531
22. Holmes BB, DeVos SL, Kfoury N, Li M, Jacks R, et al. (2013) Heparan sulfate proteoglycans mediate internalization and propagation of specific proteopathic seeds. Proc Natl Acad Sci U S A 110: E3138–3147. doi:10.1073/pnas.1301440110PMID:23898162
23. Nakase I, Tadokoro A, Kawabata N, Takeuchi T, Katoh H, et al. (2007) Interaction of arginine-rich pep-tides with membrane-associated proteoglycans is crucial for induction of actin organization and macro-pinocytosis. Biochemistry 46: 492–501. doi:10.1021/bi0612824PMID:17209559
24. Nara A, Aki T, Funakoshi T, Unuma K, Uemura K (2012) Hyperstimulation of macropinocytosis leads to lysosomal dysfunction during exposure to methamphetamine in SH-SY5Y cells. Brain Res 1466: 1–14. doi:10.1016/j.brainres.2012.05.017PMID:22613348
25. Safaiyan F, Kolset SO, Prydz K, Gottfridsson E, Lindahl U, et al. (1999) Selective effects of sodium chlorate treatment on the sulfation of heparan sulfate. J Biol Chem 274: 36267–36273. doi:10.1074/ jbc.274.51.36267PMID:10593915
26. Rustin P, Chretien D, Bourgeron T, Gerard B, Rotig A, et al. (1994) Biochemical and molecular investi-gations in respiratory chain deficiencies. Clin Chim Acta 228: 35–51. doi:10.1016/0009-8981(94) 90055-8PMID:7955428
27. Barbosa I, Garcia S, Barbier-Chassefiere V, Caruelle JP, Martelly I, et al. (2003) Improved and simple micro assay for sulfated glycosaminoglycans quantification in biological extracts and its use in skin and muscle tissue studies. Glycobiology 13: 647–653. doi:10.1093/glycob/cwg082PMID:12773478 28. Barbosa I, Morin C, Garcia S, Duchesnay A, Oudghir M, et al. (2005) A synthetic glycosaminoglycan
mimetic (RGTA) modifies natural glycosaminoglycan species during myogenesis. J Cell Sci 118: 253–264. doi:10.1242/jcs.01607PMID:15615789
30. Vandesompele J, De Preter K, Pattyn F, Poppe B, Van Roy N, et al. (2002) Accurate normalization of real-time quantitative RT-PCR data by geometric averaging of multiple internal control genes. Genome Biol 3: RESEARCH0034. doi:10.1186/gb-2002-3-7-research0034PMID:12184808
31. Boya P, Kroemer G (2008) Lysosomal membrane permeabilization in cell death. Oncogene 27: 6434–6451. doi:10.1038/onc.2008.310PMID:18955971
32. Trojanowski JQ, Lee VM (2003) Parkinson’s disease and related alpha-synucleinopathies are brain amyloidoses. Ann N Y Acad Sci 991: 107–110. doi:10.1111/j.1749-6632.2003.tb07468.xPMID: 12846979
33. Uversky VN (2007) Neuropathology, biochemistry, and biophysics of alpha-synuclein aggregation. J Neurochem 103: 17–37. PMID:17623039
34. Cohlberg JA, Li J, Uversky VN, Fink AL (2002) Heparin and other glycosaminoglycans stimulate the for-mation of amyloid fibrils from alpha-synuclein in vitro. Biochemistry 41: 1502–1511.
35. Narkiewicz J, Giachin G, Legname G (2014) In vitro aggregation assays for the characterization of alpha-synuclein prion-like properties. Prion 8: 19–32. doi:10.4161/pri.28125PMID:24552879 36. Bates TE, Heales SJ, Davies SE, Boakye P, Clark JB (1994) Effects of 1-methyl-4-phenylpyridinium on
isolated rat brain mitochondria: evidence for a primary involvement of energy depletion. J Neurochem 63: 640–648. doi:10.1046/j.1471-4159.1994.63020640.xPMID:8035188
37. Dehay B, Bove J, Rodriguez-Muela N, Perier C, Recasens A, et al. (2012) Pathogenic lysosomal deple-tion in Parkinson’s disease. J Neurosci 30: 12535–12544. doi:10.1523/JNEUROSCI.1920-10.2010 38. Tsika E, Moysidou M, Guo J, Cushman M, Gannon P, et al. (2010) Distinct region-specific
alpha-synuclein oligomers in A53T transgenic mice: implications for neurodegeneration. J Neurosci 30: 3409–3418. doi:10.1523/JNEUROSCI.4977-09.2010PMID:20203200
39. Avila JL, Convit J (1975) Inhibition of leucocytic lysosomal enzymes by glycosaminoglycans in vitro. Biochem J 152: 57–64. PMID:2162
40. Nakayama F, Hagiwara A, Yamamoto T, Akashi M (2008) Hydrogen peroxide as a potential mediator of the transcriptional regulation of heparan sulphate biosynthesis in keratinocytes. Cell Mol Biol Lett 13: 475–492. doi:10.2478/s11658-008-0016-7PMID:18463796
41. Okuda T, Sawada T, Nakano H, Matsubara K, Matsuda Y, et al. (2003) Mouse N-acetylgalactosamine 4-sulfotransferases-1 and -2. Molecular cloning, expression, chromosomal mapping and detection of their activity with GalNAcbeta1-4GlcNAcbeta1-octyl. J Biochem 134: 111–120. doi:10.1093/jb/ mvg118PMID:12944377
42. Kitagawa H, Tsutsumi K, Tone Y, Sugahara K (1997) Developmental regulation of the sulfation profile of chondroitin sulfate chains in the chicken embryo brain. J Biol Chem 272: 31377–31381. doi:10. 1074/jbc.272.50.31377PMID:9395468
43. Wang H, Katagiri Y, McCann TE, Unsworth E, Goldsmith P, et al. (2008) Chondroitin-4-sulfation nega-tively regulates axonal guidance and growth. J Cell Sci 121: 3083–3091. doi:10.1242/jcs.032649 PMID:18768934