Abstract Fracture toughness data relevant to the thickness of the particular structure is beneficial to the advanced levels of fitness-for-service assessments. Out-of-plane constraint loss associated with the thickness effect was investigated using finite element analysis and fracture experiments on the edge cracked fracture mechanics samples of different thicknesses and crack length. It was shown that samples with deep cracks are significantly affected by the thickness, while the effect is smaller for samples with shallow cracks where the in-plane constraint effects are dominant. The fracture toughness Jc was dependent on the specimen thickness with thin specimens having a higher fracture toughness compared to the thick specimens. The out-of-plane effect in deep cracked samples was shown to be similar to the in-plane effect in shallow cracked samples.
Index Terms in-plane constraint, out-of-plane constraint, fracture toughness, resistance curve.
I. INTRODUCTION
HE resistance to fracture of a given material is quantified experimentally by a fracture toughness test. Fracture toughness testing is described in standards [1]-[2]. The samples are usually square or rectangular deep cracked geometries with thickness to width ratio in the range 1:1 to 1:2. In reality many structures have thin-walls and may contain shallow flaws which may exhibit low constraint. Fracture toughness data relevant to the thickness of the particular structure is beneficial to the advanced levels of fitness-for-service assessments.
Reference [3] examined constraint variations by the opening and hydrostatic stress along the crack front in thick and thin specimens. They showed that thick specimens maintain high constraint at the crack front through the thickness but that the constraint level reduces sharply near the free surface. However, thin specimens appear significantly less constrained even at the mid-plane. Reference [4] quantified the in-plane and out-of-plane constraint effects under small scale and large scale yielding conditions. They showed under very small loads when the plastic zone is significantly smaller compared to the other geometry dimensions, the stress fields for high constraint geometry can be quantified by the plane strain solution. As the deformation increases the full field stress ahead of the crack front is no longer characterized by the two parameter
Manuscript received March 18, 2013; revised April 03, 2013. Osama A. Terfas, Department of Marine and Offshore Engineering, University of Tripoli, Tripoli, Libya. (phone: 00218-91-3184110; e-mail: [email protected]).
Abdulbast M. Kriama, Department of Mechanical and Industrial Engineering, University of Alzawia, Libya. ([email protected]).
characterization J-Q in three-dimensions, where J quantifies the deformation and Q quantifies the crack tip constraint [5]-[6]. They observed that the Q factor varies significantly for different specimen thickness. For thin specimen the Q factor reduces significantly compared to the thick specimens.
Reference [7] quantified the out-of-plane constraint effect
in terms of the stress triaxiality parameter (σm/σe), where σm
is the mean stress and σe is the equivalent von-Mises stress. They found that the out-of-plane constraint is related to in-plane constraint for low constraint geometry, and the effect of thickness is pronounced for high constraint geometries. Reference [8] showed in the deep single edge cracked bend specimen (SECB) there is no relaxation of crack tip constraint even as the load increases. They pointed out the effect of thickness and magnitude of loading on the crack tip constraint can be ignored and well described by two-dimensional solution under small scale yielding conditions. However in deep square specimens the stress field deviates from plane strain solution as load increases. In shallow square specimens the constraint reduces at much lower load levels. Reference [9] pointed out that the fracture toughness Jc in shallow cracks is about two-three times that observed
for deep cracks. This increase of toughness appears as a result of loss of constraint due to less restrained crack tip plastic zone. Reference [10] showed the crack tip triaxiality reduces, and fracture toughness increases, in shallow cracked specimens in cleavage. Reference [11] showed the geometry dependency of crack tip constraint and fracture toughness in full plasticity in ductile tearing. They showed that there is a significant effect of constraint on toughness for crack extension, and the fracture toughness in centre cracked panel (CCP) is four times greater than that in deep cracked bend specimens. They also showed there is a strong effect of constraint on the slope of the ductile tearing resistance curves. In the present work the effect of thickness on fracture toughness was examined for the fracture mechanics samples to determine tearing resistance and fracture toughness in the context of the standard test procedures.
II. GEOMETRYANDMATERIALS
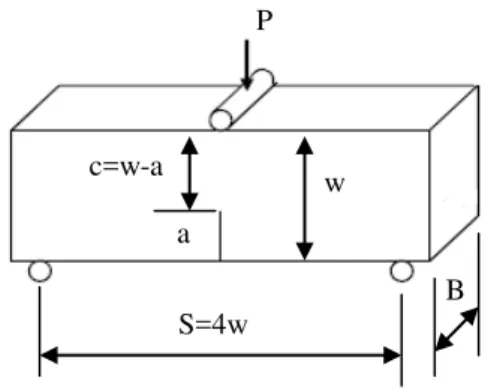
Rectangular fracture mechanics samples containing an edge crack shown in Fig. 1 were examined. The geometry of deeply cracked thick and thin specimens and shallow cracked specimens is shown in Table (1). The specimens were side grooved in order to maintain the uniformity of the stress and strain fields across the thickness, and keeping the crack front straight. The grooves were cut to a depth of 10 % of the thickness on each lateral face to obtain 80% net
Out-of-plane Constraint Based
Fracture Toughness
Osama A. Terfas, Abdulbast M. Kriama
T
Proceedings of the World Congress on Engineering 2013 Vol III, WCE 2013, July 3 - 5, 2013, London, U.K.
ISBN: 978-988-19252-9-9
ISSN: 2078-0958 (Print); ISSN: 2078-0966 (Online)
thickness of the whole thickness. The material for the test samples was mild carbon-manganese steel with a hardening
exponent n=10. Young’s modulus was 210 GPa, Poisson’s
ratio of 0.3, a yield strength of 400 MPa, and the ultimate tensile stress was 626 MPa.
Fig. 1. A standard single edge cracked bend specimen.
TABLE I
THE GEOMETRY OF INVESTIGATED SAMPLES.
Dimensional (mm) Non-dimensional
1-Deep
cracks w a B a/w B/w
50 50 50
25 25 25
25 10 5
0.5 0.5 0.5
0.5 0.2 0.1 2-Shallow
cracks
28 28 28
3 3 3
14 5.6 2.8
0.1 0.1 0.1
0.5 0.2 0.1
III. FINITEELEMENTMODEL
Finite element analyses were conducted to obtain accurate crack-tip stress fields for side grooved specimens. The finite element model is shown in Fig. 2. The mesh was focused at the crack tip. Thirty concentric rings of elements surrounded the crack tips. The innermost ring contains collapsed elements with coincident but independent nodes. The numerical model used the small-strain theory (i.e. small geometry change solution). Due to the symmetry conditions, only a quarter of the specimen was modelled and appropriate symmetry boundary conditions were applied on the planes of symmetry.
Fig. 2. Finite element model for a side grooved specimen.
IV. TESTPROCEDURE
Fracture tests were performed on a universal electromechanical testing machine equipped with three point bending set-up. A multiple specimen technique was used to infer the J-∆a curves. Samples were tested under displacement control at a cross-head velocity of 0.5mm/min. Each specimen was subjected to a chosen amount of displacement and the amount of crack extension associated with this loading was measured after the test. The first specimen was used to determine the full force-load line displacement curve and the test was stopped at the maximum load. Subsequent tests were stopped at smaller and higher displacements. All tests were performed at room temperature and at ambient conditions. The load line displacement was measured by the movement of the crosshead. The plastic energy absorbed in the material Up was determined for each
test by measuring the area under the force-load line displacement curve.
V. DETERMINATIONOFTHEJ-INTEGRAL The J-integral was calculated in accord with British Standard BS 7448-4:1997 as a sum of the elastic and plastic components:
) 0 ( 2 1 2
a w N B
p U p E
v K J
(1)
Where, Up is the absorbed energy and determined from
the area under load vs. load line displacement curve. BN is
the effective thickness of a grooved specimen, w is specimen width and a0 is fatigue crack length. K is the stress intensity
factor, E is Young`s modulus, v is Poison`s ratio and ηpis
the plastic geometry factor.
VI. THEOUT-OF-PLANECONSTRAINT
The out-of-plane constraint was determined by comparing the mean stress of the three dimensional cracked body with a reference plane strain configuration identical to the three-dimensional geometry in all respects other than the thickness. The reference 2D solution was then subtracted
from the full 3D solution at a distance r=2J/σ0 at a matching
applied load x:
0 2 3
) , (
mD
D m p r
O (2)
In this manner the in-plane and the global bending effects are removed and only the effect of thickness is determined and presented.
VII. RESULTS A. The out-of-plane constraint
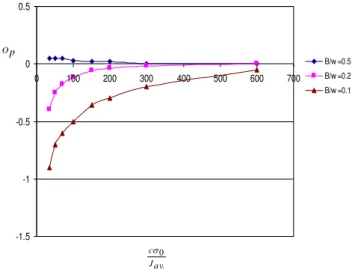
The out-of-plane term for a deeply cracked (a/w=0.5) test geometry is shown in Fig. 3. For thick geometries (B/w=0.5) the out-of-plane constraint was zero at all observable deformation levels. In geometries with B/w=0.2 the out-of-plane effect was significant at deformation levels higher than
cσ0/Jav=100, where c is the uncracked ligament, σ0 is the Side groove
Crack surface
Crack front
Mid-plane
a
B P
w
S=4w c=w-a
Proceedings of the World Congress on Engineering 2013 Vol III, WCE 2013, July 3 - 5, 2013, London, U.K.
ISBN: 978-988-19252-9-9
ISSN: 2078-0958 (Print); ISSN: 2078-0966 (Online)
yield strength and Jav is the average J-integral through the
thickness of the sample. This corresponds to full plasticity with Lr=1, where Lr is the load to limit load ratio. For
thinnest geometries (B/w=0.1) the out-of-plane effect became even more pronounced early in the deformation
history (cσ0/Jav=300) which is about Lr=0.6 and increases
further in full plasticity.
-1.5 -1 -0.5 0 0.5
0 100 200 300 400 500 600 700
B/w =0.5
B/w =0.2
B/w =0.1
Fig. 3 Out-of-plane effect as a function of deformation levels for deeply cracked geometries a/w=0.5 with different thickness ratios B/w.
In shallow cracked geometries (a/w=0.1) the out-of-plane effect was much less pronounced compared to that observed in deep cracked geometries and became notable only at very
large deformations (cσ0/J<150, Lr>1) for thinnest specimens
(B/w=0.1) as shown in Fig. 4.
-1.5 -1 -0.5 0 0.5
0 100 200 300 400 500 600 700 800 900
B/w =0.5
B/w =0.2 B/w =0.1
Fig. 4 Out-of-plane effect as a function of deformation levels for shallow cracked geometries a/w=0.1 with different thickness ratios B/w.
B. J-∆a Resistance curves
The results for deep cracked samples of three thicknesses to width ratios are shown in Fig. 5. The thickness (B) and ligament (c) requirements of BS7448 for a valid fracture toughness test (cσ0/J>25 and Bσ0/J>25) were maintained in most tests. However the thinnest specimens B/w=0.1 did not meet the thickness requirements. The experimental data were used to construct a J-∆a curve. The value of J for each
specimen was plotted versus the amount of crack tip
extension ∆a. The curve fit was constructed through the data
points and the fracture toughness corresponding to crack extension of 0.2 mm was determined.
Fig. 5 shows J-integral values obtained experimentally as a function of the crack extension for thick and thin specimens (a/w=0.5, B/w=0.5, 0.2 and 0.1). It can be seen that the fracture toughness, J0.2 was approximately 82 N/mm
for thick specimens (B/w=0.5). For thin specimens (B/w=0.2) the fracture toughness J0.2 was 88 N/mm. This
value is slightly larger than that fracture toughness observed for thick specimens. With a further decrease in thickness to B/w=0.1 a significant increase in the fracture toughness was observed with J0.2 equal to 105 N/mm.
0 50 100 150 200 250
0 0.2 0.4 0.6 0.8 1 1.2 1.4 1.6 1.8
B/w =0.1
B/w =0.2
B/w =0.5
Fig. 5 The fracture resistance curve (J-∆a curve) for thick and thin single edge notched bend specimens with a/w=0.5 and B/w=0.5, 0.2 and 0.1.
Fig. 6 shows an increase in critical fracture toughness (J0.2) for shallow cracks a/w=0.1. Deeply cracked specimens
attained J0.2=82 N/mm while shallow cracked specimens
J0.2=105 and 125 N/mm for a/w=0.16 and a/w=0.1,
respectively.
0 50 100 150 200 250
0 0.2 0.4 0.6 0.8 1 1.2 1.4
a/w =0.1
a/w =0.16
a/w =0.5
Fig. 6 The fracture resistance curve (J-∆a curve) for deep and shallow cracked specimens a/w=0.5, 0.16 and 0.1, B/w=0.5.
VIII. DISCUSION
At the centre plane of a deeply cracked geometries (a/w=0.5) the out-of-plane effect was insignificant for thick samples B/w=0.5 for all observable deformation levels.
p
O
. 0
av J c
. 0
av J c
p O
∆a, mm
J, N/mm
J, N/mm
∆a, mm
Proceedings of the World Congress on Engineering 2013 Vol III, WCE 2013, July 3 - 5, 2013, London, U.K.
ISBN: 978-988-19252-9-9
ISSN: 2078-0958 (Print); ISSN: 2078-0966 (Online)
However, the effect became very significant under large scale yielding for B/w=0.2. Thinnest geometries (B/w=0.1) showed the out-of-plane effect became significant in contained yielding compared to the thicker geometries. For shallow cracked geometries a/w=0.1, the out-of-plane effect at the centre plane was very small compared to deep cracks. This is because in-plane constraint is the dominant effect in shallow cracks where plasticity in the center plane of the sample preferentially develops to the closest free surface which is the front of the sample. The out-of-plane constraint loss is the important effect in deep cracks. The results shown in Fig. 3 suggest that the loss of constraint associated with a decrease in thickness results in an increase in toughness (Jc)
shown in Fig. 5.
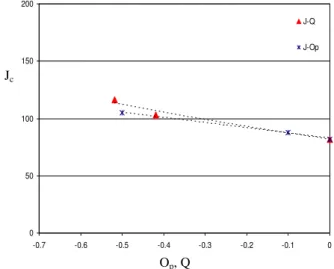
Fig. 7 shows the J-Op locus compared to J-Q locus at
crack extensions of ∆a=0.2. The Q-parameter was derived
from the T-stress using the expression [12]:
Q=0.75
0
T
-0.5221 2
0
T
for 0
T
0, n10 (3)
It can be seen that the increase in toughness due to the in-plane constraint loss was similar to the increase in toughness due to the out-of-plane effect. This indicates that the loss of constraint in deep cracks due to thickness effect is the same to loss of constraint in thick geometry containing a shallow crack.
0 50 100 150 200
-0.7 -0.6 -0.5 -0.4 -0.3 -0.2 -0.1 0
J-Q
J-Op
Fig. 7 A comparison between J-Op and J-Q locus (Jcat ∆a=0.2mm).
IX. CONCLUSION
The out-of-plane effect at the mid-plane in deeply cracked specimens (a/w=0.5) was pronounced only at high deformation levels in geometries with thickness ratios of B/w=0.2, while constraint loss occurred at lower deformation levels in very thin geometries B/w=0.1. The constraint levels in deeply cracked specimens showed a significant dependence on out-of-plane effects and thin-deeply specimens showed a more severe loss of out-of-plane constraint than shallow cracked specimens.
Tests on thick and thin specimens showed that the fracture toughness Jc at ∆a=0.2mm was dependent on the specimen
thickness with thin specimens having a higher fracture toughness compared to the thick specimens. The increase in toughness associated with loss of out-of-plane was observed to be similar to the enhanced toughness due to in-plane effects.
REFERENCES
[1] ASTM E1737-96, “Standard test method for J-integral
characterization of fracture toughness,”. American Society for Testing
and Materials, 03.01, 957-980, 1998.
[2] BS7448-97: Part 4, “Method for determination of fracture resistance curves and initiation values for stable crack extension in metallic materials,”. British Standard Institution, London, 1997.
[3] J. C. Newman and C. A. Bigelow, “Three-dimensional elastic-plastic finite-element analysis of constraint variations in cracked bodies,”.
Engineering Fracture Mechanics 46, 1-13, 1993.
[4] H. Yuan and W. Brocks, “Quantification of constraint effects in elastic-plastic crack front fields,”. Journal of Mechanics and Physics of Solids 46, 219-241, 1998.
[5] N. P. O’Dowd and C. F. Shih, “Family of crack-tip fields characterised by a triaxiality parameter-1,”. Structure of fields.
Journal of Mechanics and Physics of Solids 39, 989-1015, 1991.
[6] N. P. O’Dowd and C. F. Shih, “Family of crack-tip fields characterised by a triaxiality parameter-2,”. Fracture applications.
Journal of Mechanics and Physics of Solids 40, 939-963, 1992.
[7] Y-Jae Kim, J. S. Kim, S. M. Cho and Y-Jin Kim, “3-D constraint effects on J testing and crack tip constraint in M(T), SE(B), SE(T) and C(T) specimens: numerical study,”. Engineering Fracture Mechanics 71, 1203-1218, 2004.
[8] Y. Kim, Y. J. Chao and X. K. Zhu, “Effect of specimen size and crack depth on 3D crack-front constraint for SENB specimens,”.
International Journal of Solids and structures 40, 6267-6284, 2003.
[9] R. H. Dodds, T. L. Anderson and M. T. Kirk, “A framework to correlate a/w ratio effects on elastic-plastic fracture toughness (Jc),”.
International Journal of Fracture 48,1-22, 1991.
[10] J. D. G. Sumpter and J. W. Hancock, “Shallow crack toughness of HY80 welds. An analysis based on T-stress,”. International Journal
of Pressure Vessels and Piping 45, 207-221, 1991.
[11] J. W. Hancock, W. G. Reuter and D. M. Parks, “Constraint and toughness parameterised by T. Constraint effect in fracture,”. ASTM STP 1171, Philadelphia, 21-40, 1993.
[12] N. P. O’Dowd and C. F. Shih, “Two-parameter fracture mechanics: Theory and applications,”. American Society for Testing and
Materials, ASTM STP1207. Philadelphia. 21-47, 1995.
Jc
Op, Q
Proceedings of the World Congress on Engineering 2013 Vol III, WCE 2013, July 3 - 5, 2013, London, U.K.
ISBN: 978-988-19252-9-9
ISSN: 2078-0958 (Print); ISSN: 2078-0966 (Online)