Experimental study of the mechanical behavior of
self-compacting concrete based on fracture mechanics
Estudo experimental do comportamento mecânico do
concreto autoadensável com base na mecânica da fratura
Abstract
Resumo
Considering the physical nonlinearity of concrete and the fundamentals of fracture mechanics for quasi-brittle materials, the objective of this study was to determine the fracture energy and the length of the fracture process zone (FPZ) as well as the modulus of elasticity, the tensile strength and the compressive strength of self-compacting concrete (SCC) to characterize its mechanical behavior. A series of tests, including a three-point bending test of SCC and conventional vibrated concrete (CVC) specimens, with a notch at mid-span, and tensile and compressive tests were
performed. The mechanical parameters obtained from the CVC specimens were considered as a comparative reference. The efect of the follow
-ing variables was evaluated and considered at two levels: compressive strength (30 and 50 MPa), granular composition (ine and coarse particle size) and maximum diameter of the aggregate (12 and 20 mm). The efect of these variables on the mechanical behaviors of the SCC specimens
was evaluated based on the test results of specimens of four types of concrete, which were obtained from the combination of the variables. The
bending tests were performed according to the RILEM TC 89-FMT recommendations, which are based on the size-efect method.
Keywords: fracture mechanics, self-compacting concrete, size efect.
O objetivo principal deste trabalho é caracterizar o comportamento mecânico dos concretos autoadensáveis (CAA), tendo em vista a não lineari-dade física e os fundamentos da mecânica da fratura para materiais parcialmente frágeis. Neste trabalho busca-se a determinação da energia de fratura e do comprimento da Zona de Processo de Fratura, além do módulo de elasticidade, da resistência à tração e à compressão. Para tanto,
foi realizada uma série de testes constando vigas de CAA submetidas à lexão de três pontos e vigas de concretos convencionais vibrados (CCV),
com entalhe no meio do vão, sendo que os parâmetros dos corpos-de-prova de CCV serviram como referência comparativa. Foram considerados
com dois níveis de resistência à compressão (30 e 50 MPa), duas composições granulométrica (granulometria ina e granulometria grossa) e dois diâmetros máximo do agregado (12 e 20 mm). A avaliação da inluência destas variáveis no comportamento mecânico do CAA foi feita a partir da dosagem de quatro tipos de concretos obtidos pela combinação das variáveis mencionadas. Os ensaios de lexão foram feitos de acordo com a
recomendação do RILEM TC 89-FMT, que se baseia no Método do Efeito de Tamanho.
Palavras-chave: mecânica da fratura, concreto autoadensável, efeito de tamanho.
a Department of Structural Engineering, School of Engineering, Federal University of Minas Gerais, Belo Horizonte, MG, Brazil; b Institute of Sciences and Technology, Department of Civil Engineering, Federal University of Triângulo Mineiro, Uberaba, MG, Brazil; c Institute of Concrete Science and Technology, Department of Construction Engineering, Polytechnic University of Valencia, Valencia, Spain.
G. O. RIBEIRO a
P. C. GUETTI b
P. SERNA c
1. Introduction
Self-compacting concrete (SCC) originated in Japan in 1986;
the irst use of SCC occurred in 1988. SCC can be deined as a concrete that can low and spread in a mold by the action of its
weight and can transpose obstacles without exhibiting segrega-tion and exudasegrega-tion, which ensures a uniform aggregate distribu-tion throughout the volume of the structure. These features are the main characteristics of this composite in its fresh state.
SCC is a typical case of quasi-brittle material, which exhibits a soft-ening branch in a stress-strain diagram after attaining the maximum load value in a tensile test, in which the load value continuously
de-creases with a signiicant increase in deformation. The behavior of
concrete can be described based on fracture mechanics for a more realistic simulation of mechanical behavior. The proper use of frac-ture mechanics via the application of mathematical models is more representative of the actual behavior of concrete and can aid in the formulation of more accurate constitutive models that are less
subject to scale efects. For the application of fracture mechanics,
the determination of experimental parameters that characterize the fracture process is required. The integration of mathematical mod-els and the ability to experimentally determine the parameters of these models enables the use of concrete fracture mechanics in practical applications (BITTENCOURT [1]).
BAŽANT [2, 3] argues that the size efect observed in concrete
structures is one of the main reasons for the application of frac-ture mechanics concepts in the analysis of concrete strucfrac-tures. The easiest way to apply these concepts is to use formulations
of linear elastic fracture mechanics (LEFM). Based on the efec -tive crack model and its dependence on the size of a structural
element, BAŽANT et al. [4] deined the fracture energy (Gf) and the length of the fracture process zone (FPZ) (cf) for ininite-size
structures of any geometry. To experimentally determine Gf and cf
from specimens of moderate size, the authors proposed the size
efect law to characterize the material and to isolate the inluence
of the size and geometry of a structure.
The determination of the fracture energy and length of the FPZ are the main objectives of this study. The modulus of elasticity and the tensile and compression strengths were also investigated. Nu-merous SCC beams (with a notch at mid-span) were subjected to a three-point bending test. Simultaneous tests were performed with an analogous series of conventional vibrated concrete (CVC) beams with a notch at mid-span. The parameters of the CVC spec-imens served as a comparative reference. Concrete with two levels of compressive strength (30 and 50 MPa), two granular
composi-tions (ine and coarse particle sizes) and two maximum aggregate diameters (12 and 20 mm) were investigated. The inluence of
these variables on the mechanical behavior of SCC was evaluated by mixing four types of concrete that were obtained by combin-ing the variables of interest. The three-point bendcombin-ing tests were performed according to the RILEM TC 89-FMT recommendation,
which is based on the size efect method.
2. Materials and concrete compositions
The materials used to produce the various types of SCC in this ex-perimental program included the following cements: CEM I 52.5R (UNE-EN 197-1, 2011), rated as high-strength Portland cement according to European standards, and CEM II/BM (V-LL) 32.5N (UNE-EN 197-1, 2011), with the addition of silica and limestone
Table 1
Composition of the cements
Cement
Components CEM II/B-M(V-LL) CEM I 52.5R
Clinker 65 – 79% 95 – 100%
Silica and limestone fly ash 21 – 35%
-Minor constituents 0 – 5% 0 – 5%
Chemical characteristics – –
Sulfates < 3.5% 3.4%
Chlorides < 0.1% –
Free lime – 1.7%
Physical characteristics
Initial hardening > 75 minutes > 45 minutes
Expansibility < 10 mm < 10 mm
Blaine fineness 4493 cm2/g 4608 cm2/g
Compressive strength – –
2 days – > 30 MPa
7 days > 16 MPa
ly ash, rated as a Portland cement with intermediate strength ac -cording to European standards. The composition of these cements is presented in Table [1]. In addition, the following components were
employed: limestone iller; rolled, washed natural sand; crushed limestone artiicial sand; water reducing multifunctional additive;
polycarboxylic-ether-based superplasticizer; and limestone gravel with minimum/maximum diameter of 4/7 mm, 7/12 mm and 12/20 mm, with the following granulometric modulus: 5.4, 6.6 and 8.5,
re-spectively. The ineness modulus of the natural sand and artiicial
sand was 2.8 and 2.5, respectively.
The concrete was mixed to produce two basic types of concrete: a conventional concrete for general construction and a concrete suitable for prefabricated structures, which were mixed for target compressive strengths of 30 and 50 MPa, respectively. Based on these strength values, the variables of interest for this study were chosen, namely, compressive strength, maximum aggregate
diam-eter—12 and 20 mm—and ine and coarse particle sizes.
Given the variables of interest, a statistical analysis based on design of experiments and a method by Taguchi cited in Serna [5] was per-formed to determine the number of concrete types that are needed
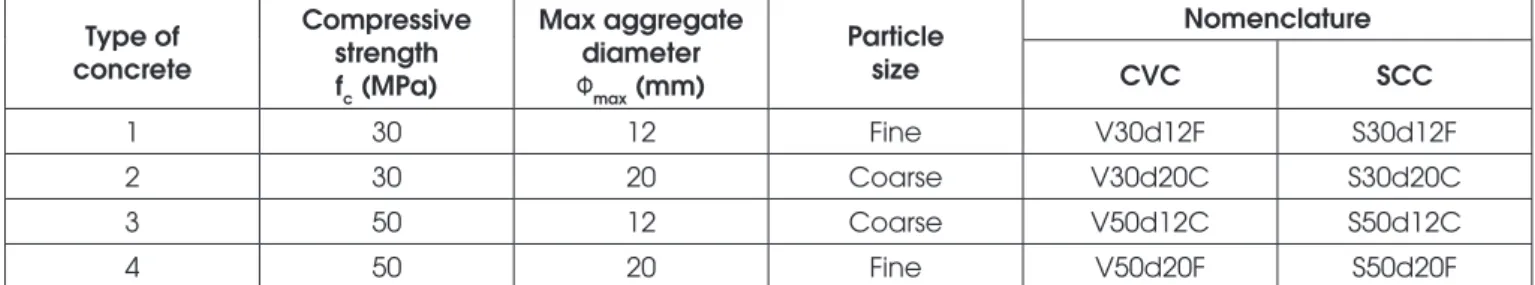
to determine the efect of these variables on the mechanical behav -ior of concrete. This analysis indicated four types of self-compacting concrete (SCC) and four types of conventional vibrated concrete (CVC). The latter four served as a reference. Table [2] lists the types of SCC and CVC according to the variables of interest.
In the nomenclature adopted for the CVC in Table [2], the irst letter
indicates whether the concrete was vibrated (V) or (S)
self-com-pacting; the number following the irst letter indicates the compres -sive strength class according to the mixing target strength, which may be 30 or 50 MPa; the letter d is the maximum aggregate diam-eter: d12 for a maximum diameter of 12 mm and d20 for a maxi-mum diameter of 20 mm. The last letter indicates the particle size distribution: F denotes ine grain and C denotes coarse grain.
After deining the types, the concrete was mixed with the mix propor -tions of concrete V30d20C and V50d12C employed as the base. The amount of cement and the water/cement ratio were determined based on the desired compression strength. The proportion of ag-gregates was obtained from Bolomey’s theoretical curve by always adjusting the maximum aggregate diameter and the particle size
(Figures [1] and [2]). To obtain a iner or coarser particle size, the
Table 2
Types of concrete
Type of concrete
Compressive strength fc (MPa)
Max aggregate diameter
Фmax (mm)
Particle size
Nomenclature
CVC SCC
1 30 12 Fine V30d12F S30d12F
2 30 20 Coarse V30d20C S30d20C
3 50 12 Coarse V50d12C S50d12C
4 50 20 Fine V50d20F S50d20F
Figure 1
ratio of crushed stone to sand and the ratio of artiicial sand to natu -ral sand were varied. Given the proportion of materials, tests were conducted with the concrete to adjust the amount of plasticizer,
su-perplasticizer additive, and iller material, which was only employed
in concrete S30d20C to increase viscosity and prevent segregation of the aggregates. Table [3] lists the composition of the four types of CVC and SCC and the concrete slump test (Abrams cone, S) re-sults for this concrete. The slump height was measured for the CVC, whereas the spreading was measured for the SCC. The occurrence
of segregation was veriied by visual inspection after the Abrams
cone test with the concrete in a fresh state using a longitudinal cut in cylindrical 15×30-cm specimens in a hardened state.
3. Experimental procedures
and methodology
Following RILEM recommendation TC 89-FMT [5], the SCC post-peak load behavior was characterized based on the fracture
en-ergy, according to the maximum load values applied to the speci-mens and the dispeci-mensions of the specispeci-mens. Three-point bending tests were conducted with SCC beams, i.e., beams supported at two points with a concentrated load applied in the direction perpen-dicular to the axis at mid-span, where a notch reduced the cross-sectional height and conditioned the locations of the deformations (Figure [3]). Load-crack mouth opening displacement (CMOD) curves were obtained during the tests. Special attention was given
to the evaluation of the efect of compressive strength, maximum
aggregate diameter and particle size distribution on the properties that characterize the bending behavior of SCC. All experimental stages were performed at the Laboratory of the Institute of Con-crete Science and Technology of the Polytechnic University of Va-lencia (Instituto de Ciencia y Tecnología del Hormigon - ICITECH, Universitat Politècnica de València - UPV) in Spain, according to an agreement between the Graduate Program in Structural Engi-neering of the Federal University of Minas Gerais (Programa de Pós-Graduação em Engenharia de Estruturas da Universidade
Figure 2
Particle size curve for self-compacting concrete
Table 3
Composition of the materials
Types of concrete
Cement (kg/m3)
Water (kg/m3)
Crushed stone (kg/m3)
Sand
(kg/m3) Filler material
(kg/m3)
Additives
(kg/m3) Abrams cone (mm) 4/7 7/12 12/20 Natural Artificial Plast. Super.
V30d12F 325 195 346 643 – 860 – – 1.89 – 100
V30d20C 325 195 209 366 471 839 – – 1.80 – 120
V50d12C 380 190 336 623 – 834 – – 1.90 2.28 100
V50d20F 380 190 335 335 287 831 – – 2.28 1.90 140
S30d12F 325 195 359 538 – 750 195 - 1.63 5.20 600
S30d20C 325 195 142 283 519 533 362 45 2.60 5.20 600
S50d12C 380 190 353 432 – 524 364 – 1.90 6.08 640
Federal de Minas Gerais - PROPEEs-UFMG) and UPV, supported by the Brazilian Coordination for the Improvement of Higher Edu-cation Personnel (Coordenação de Aperfeiçoamento de Pessoal de Nível Superior - CAPES).
Several three-point bending tests were conducted on beams with varying dimensions. The adopted beam dimensions were 80×100×410 mm3, 160×100×770 mm3 and 320×100×1500 mm3,
with a notch of 1/6 of the height at mid-span. Axial compression tests, diametral compression tests and elastic modulus tests were performed on cylindrical specimens to determine the compressive strength, tensile strength, and modulus of elasticity, respectively. The tests were performed on concrete specimens at 28 days of age. The specimens were kept covered with a plastic sheet in laboratory conditions and were kept in laboratory conditions after unmolding. Notches were made by cutting with a diamond disk 36 to 72 hours prior to testing.
BAŽANT et al. [6] proposed a logical method of applying linear elastic fracture mechanics to concrete to deine the fracture energy
and size of the fracture process zone in pieces with size tending to
ininity, with the parameters Gf and cf, respectively. These param-eters are assumed to be characteristic of the material,
indepen-dent of size. TC 89-FMT speciies the determination of the fracture
energy (Gf) based on the method proposed by BAŽANT et al. [6]
using a three-point bending test on concrete beams with a notch at
mid-span. In this method, the fracture energy is deined as speciic
energy, i.e., energy per unit crack plane area, which is required
for fracture propagation in ininitely large specimens. Theoretically,
the fracture energy is independent of the size and shape of the specimens. The beams should have similar dimensions and dif-ferent sizes, and the ratio between the height of the section and
the span should be kept constant. With fracture energy, the tensile strength must be determined using traditional procedures, such as the diametral compression test on cylindrical specimens and the elastic modulus. With these data, the nominal stress at failure can be determined.
The experimental procedure in this method is simple; the data re-quired to determine the fracture energy consists of the maximum loads values and the dimensions of each tested beam. Sophisti-cated strain gauge devices are not required. The TC 89-FMT rec-ommendation is based on the applied critical load and the critical
efective elastic crack length.
Fracture energy values (Gf) for bodies with ininite dimensions are
obtained by extrapolating values for a limited number of specimens
with inite dimensions using linear regression. Note that a simple error can signiicantly change the value of Gf when calculating the slope of the regression line.
(1)
where Ec is the modulus of elasticity, A is the slope of the linear regression line, and gf(α0) is the dimensionless fracture energy that is determined from the LEFM, considering the ratio between the
span and the height of the beam is 4, and α0 is given by the follow-ing relationship: α0 =a0/b.
The value of A is obtained from the linear regression line (Y = AX + C). The resulting data of the tests are the maximum load and the characteristic dimension of the tested beams, in this case, the height of the section. The weight of each specimen is added to the values of the respective maximum loads. Considering that Y is the
Figure 3
Three-point bending test in concrete beams with a notch at mid-span and different sizes:
a) beam with the dimensions 80×100×410 mm
3; b) beam with the dimensions 160×100×770 mm
3inverse of the square of the nominal strength of each beam and X
is the height of its cross-section, the linear regression of the data formed by the set of paired X and Y values are performed to obtain the equation of the line (Y = AX + C). In the three-point bending test, the values of X and Y are expressed as
(2)
in which b corresponds to the height of the beam, t is the thick-ness of the beam and P0 is the maximum load obtained in the tests
added to the weight of the specimen between the supports.
4. Results and analysis
The results of the compressive strength, tensile strength and elas-tic modulus tests are shown in Table [4], as well as the variables of interest for each type of SCC, along with the fracture energy values (Gf) and size of the fracture process zone (cf). The dispersion of the linear regression was evaluated by the indices wA, wC and m, which are also listed in Table [4], in which wA is the dispersion of the linear regression slope, wC is the coeicient of variation that
intercepts the regression line and m is the relative width of the dispersion band.
Table [4] reveals that the compressive strengths of concretes V30d12F and S30d12F and concretes V30d20C and S30d20C have similar values. The compressive strengths of concretes V30d12F and S30d12F were 54% higher than the compressive
strengths of V30d20C and S30d20C. This inding is attributed to the iner grain size in V30d12F and S30d12F in relation to the iner grain size in V30d20C and S30d20C. A iner particle size provides better illing of the pores in the interface between the aggregate
and the binder, which increases the adhesion between the cement paste and the aggregates.
A suitable correlation between the modulus of elasticity and the compressive strength is shown in Table [4], with a trend toward an increase in the elastic modulus with an increase in the com-pressive strength in the CVC and the SCC; this relationship is well known in the literature on the subject. In general, the elastic
modu-lus values for the CVC were higher than the elastic modumodu-lus values for the SCC due to the smaller amount of coarse aggregates in the
SCC and to the lack of minerals with binding properties. The difer -ence between the moduli of elasticity of the CVC and the moduli of elasticity of the SCC was approximately 8% in the concrete that was mixed for a target compressive strength of 30 MPa. This dif-ference decreased to approximately 2% in the concrete that was mixed for a target compressive strength of 50 MPa.
Table [4] reveals that the fracture energy for concrete V30d20C was approximately 12% higher than the fracture energy for V30d12F, whereas the fracture energy for V50d20F was 50% higher than the fracture energy for V50d12C. For the SCC, S30d12F presented a fracture energy that was 33% higher than the fracture energy for S30d20C, and S50d12C presented a Gf that was 77% higher than the Gf of S50d20F. Additionally, the SCC showed fracture energy values that were lower than the fracture energy values for the cor-responding CVC. The only exception was S50d12C, which pre-sented a fracture energy that was equivalent to the fracture energy of V50d12C.
The results listed in Table [4] show that the values for the CVC are slightly above the values suggested by recommendation TC 89-FMT, considering the dispersion of the linear regression slope (wA)
and the coeicient of variation that intercepts the regression line
(wC) [5]. The relative dispersion band width (m) was satisfactory.
For the SCC, the values of the dispersion coeicients wA, wC and m
were lower than the values of the dispersion coeicients suggested by the methodology, with the exception of the coeicients for con -crete S50d20F, whose values were higher than the recommended
values. This inding may indicate better technological control of the
mixing process of SCC in relation to CVC, primarily due to the ab-sence of vibration in the SCC.
The lengths of the FPZ for the SCCs were signiicantly lower than
the values for the corresponding CVC. This result can be explained
by the use of a larger amount of ine particles in the SCC. Fines
tend to improve the properties of the interface between the ag-gregate and the binder and generate a greater agag-gregate grain fracture during crack propagation (Figure [4]). Consequently, the FPZ lengths for the SCC decreased due to lower tortuosity of the crack propagation path.
Table 4
Composition of the materials
Type of concrete
Compressive strength fc (MPa)
Tensile strength
ft (MPa)
Modulus of elasticity
E (MPa)
wA wC m Gf
(N/m)
cf (mm)
V30d12F 47.0 3.88 31644 0.76 0.36 0.42 32.36 36.21
V30d20C 29.8 4.24 27980 0.79 0.97 0.84 36.39 36.01
V50d12C 48.3 3.25 30326 0.29 0.31 0.26 22.31 15.63
V50d20F 49.2 5.09 31574 0.77 0.36 0.39 33.65 34.68
S30d12F 45.7 4.16 29219 0.057 0.09 0.065 18.50 9.10
S30d20C 30.5 3.54 26104 0.17 0.13 0.13 13.90 18.18
S50d12C 52.4 4.37 29748 0.087 0.11 0.087 22.63 13.23
Figure [4] shows the fracture surface of a V30d20C beam (up-per part of the photo) compared with the fracture surface of an S30d20C beam (lower part of the photo). As shown in Figure [4], V30d20C has a rougher fracture surface that is primarily charac-terized by crack propagation across the cement paste-aggregate interface, which contours the aggregate surface. In S30d20C, the fracture surface is smoother, in which a high incidence of aggre-gate grain fractures during crack propagation is observed. Thus, the fracture energy values and the length of the FPZ for SCC were lower than the fracture energy values and the length of the FPZ for the CVC (Table [4]).
The greater aggregate grain fracture in SCC is primarily attributed to the strengthening of the transition zone between the aggregate
and the cement paste, considering the larger amount of ines in
these concrete. In general, CVC had higher fracture energy values
and FPZ lengths than the SCC. Note that the amount of ines can
be directly related to the size of the FPZ and that the particle size
distribution and the amount of ines in the concrete inluences the
fracture energy values.
The inluence of particle size distribution and maximum aggre
-gate diameter on FPZ length is analyzed by the size efect graph
(Figure [5]). The strengths of the concrete structures decrease with an increase in the size of the structures. In general, structures tend to be more brittle as they increase in size, which is described as the
size efect and can be explained by fracture mechanics. As shown
in Figure [5], note the decline in nominal strength with an increase in the size of the specimen. The decline observed is lower than
-1/2, which corresponds to LEFM. The same igure also shows a
band that corresponds to nonlinear fracture mechanics (NLFM).
The size efect can be analyzed via the double-logarithmic plot of the logarithm of nominal fracture strength σN divided by the
empiri-cal constant B and multiplied by the tensile strength ft – i.e., (σN/Bft)
–, versus the logarithm of β, which is the height of the beam divided
by the characteristic length. The empirical constant B is calculated
Figure 4
(a) CVC fracture surface (above); SCC fracture surface (below); (b) enlarged detail
A
B
V30d20C
S30d20C
Figure 5
(a) Size effect for CVC; (b) Size effect for SCCg
may be applied to analyze the behaviors of these specimens. The horizontal line in Figure [5] represents a classical strength criterion that is based on stress. Large structures intensely show the size
efect, i.e., the strength of the material at failure is proportional to
the characteristic dimension of the material and corresponds to the classical LEFM, which is represented by the line with a slope of -1/2 in relation to the horizontal axis. In the region of the inter-section between these two lines, that is, the interinter-section between the classical strength criterion and the criterion based on LEFM, a transition zone exists where NLFM should be adopted. The results of the majority of the tests performed with the concrete specimens are located in this transition zone (Figure [5]).
Figure [5a] shows that V50d12C is the closest CVC to the LEFM line; it shows the most brittle behavior and the smallest FPZ size, according to the fracture energy and FPZ length results in Table [4].
For the SCC, S50d20F exhibits the most brittle behavior and is
sig-niicantly closer to the LEFM line (Figure [5b]), according to the Gf
and cf values in Table [4]. The SCC showed more brittle behavior than the CVC. When S30d12F and V30d12F as well as S50d20F
and V50d20F are compared, the addition of ines to the SCC im -proved the properties of the interface between the aggregate and the paste for this concrete, which rendered them more brittle. For the SCCs, when comparing S30d12F to S30d20C, note that the increased particle size distribution that is associated with the increased maximum aggregate diameter produced a 25% reduction in the Gf
value and an approximately 100% increase in the cf value. The com-parison between S50d12C and S50d20F reveals that the reduced particle size distribution, which is associated with increased maximum diameter, produced a 43.5% reduction in Gf and a 37% reduction in cf.
The addition of ine particles to concrete improves the properties
of the interface and increases its strength but causes it to become more brittle. A higher incidence of aggregate grain fractures was observed during crack propagation; this observation was noted when comparing the SCCs with the CVCs.
5. Conclusions
Based on the tests results, the following inferences were obtained:
n The methodology to determine the fracture parameters of CVC and SCC according to the RILEM TC 89-FMT speciication, which is based on the size efect method, was adequate for
routine use to characterize the concrete based on fracture mechanics because it is based on a simple load application system that only requires that the maximum load be achieved during the test, without the use of a servo-controlled machine. Thus, this methodology is perfectly viable for the character-ization of concrete in a reasonably well-equipped laboratory with respect to aspects of softening and structural brittleness, based on estimates of the following properties: fracture energy and size of the fracture process zone.
n The SCC generally had lower fracture energy values than the
fracture energy values of the CVC, as evidenced by the results
of the size efect method, according to the RILEM TC 89-FMT
recommendation. This brittle behavior is related to the
im-provement of the interface properties due to the use of a iner
particle size distribution in the SCC compared with the CVC.
n The use of artiicial sand in the preparation of the SCC to
an increase in the compressive strength values. The moduli of elasticity for the SCC were slightly lower than the moduli of elasticity for the reference CVC, considering the same com-pressive strength level. However, this slight reduction in the modulus of elasticity can be compensated by increasing the productivity of the SCC and improving the construction
pro-cess, as evidenced by lower coeicient of variation values for
the SCC compared to the CVC.
6. Acknowledgements
The authors thank the Brazilian Ministry of Education (Ministério da Educação), Coordination for the Improvement of Higher Education Personnel (Coordenação de Aperfeiçoamento de Pessoal de Nível
Superior - CAPES), National Council for Scientiic and Technologi -cal Development (Conselho Nacional de Desenvolvimento
Cientí-ico e TecnológCientí-ico – CNPq), Minas Gerais Research Foundation
(Fundação de Amparo à Pesquisa de Minas Gerais – FAPEMIG), and the Ministry of Education and Science of Spain (Ministério de Educación y Ciencia), Project PH2007-0044-PC, Project PCI2006-A7-0721 and Program CGCI MECD-DGU Brazil/Spain.
7. References
[1] BITTENCOURT, T. N., Fratura do Concreto Estrutural: As-pectos Teóricos Computacionais e suas Aplicações [Frac-ture of Structural Concrete: Computational Theoretical Aspects and their Applications] Boletim Técnico da Escola Politécnica da Universidade de São Paulo, São Paulo, 1999.
[2] BAŽANT, Z.P.; Size efect in blunt fracture concrete, rock end
metal. J. Eng. Mech-ASCE, 110:518-35, 1984.
[3] BAŽANT, Z.P.; Concrete fracture models: testing and prac -tice. Engineering Fracture Mechanics. 2002, v.69, 165-205.
[4] BAZANT, Z. P.; PLANAS, J.; Fracture and Size Efect in Con -crete and Other Quasi-Brittle Materials, 1998, CRC Press. [5] Serna, P., Taengua, E.G.; Líneas básicas del diseño y
análi-sis de experimentos. Dpto. de Ing. de la Construcción y Proyectos de Ing. Civil Universitat Politècnica de València.
[6] RILEM - “Draft Recommendation 89-FMC: Size-efect meth -ods for determining fracture energy and process zone size of concrete”, Materials and Structure, 1990, v.23, p.461-465. [7] BAZANT, Z. P.; PFEIFFER, P. A.; Determination of Fracture