http://www.bipublication.com Research Article
CFD Simulation of Fouling by Biological materials
in Membrane Bioreactor
Raziye, Ahmadi1* and Toraj, Mohammadi2
1
Department of Chemical Engineering, Islamic Azad University- South Tehran Branch , Tehran, Iran.
(Email: [email protected]) 2
Department of Chemical Engineering, Iran University of Science and Technology, Tehran, Iran.
(Email: [email protected]) ABSTRACT
In recent years membrane bioreactors filtration is increasingly used in wastewater treatment to enhance the quality of wastewater. The main problem in preventing the widespread use of membrane bioreactor is its congestion which has a severe impact on output flux to time ratio. If solid suspensions with high concentrations exist in the wastewater, this influence will be even more severe. In addition to the suspended solids in the liquid mixture, Extracellular polymeric materials (EPS) and soluble microbial products (SMP) are also known as basic microbial products that cause membrane fouling. EPS can be calculated within and on the membrane which increases the viscosity of suspended solids in the liquid mixture and increases filtration resistance. SMPs cannot penetrate the pores of the ultra filtration membrane due to the limited size of the pores which would cause fouling in membrane processes. According to the above issues, providing a model that indicates the properties and conditions of formation and destruction of SMP and EPS at the same time seems necessary. In this paper, CFD simulation of biological fouling in membrane bioreactor is provided using Fluent software.
Keywords: Membrane Bioreactor, Filtration, Fouling, Extracellular Polymeric Substances, Soluble Microbial Products.
1. INTRODUCTION
The fundamental issues of concentration polarization, fouling, biological fouling and its variants are introduced.
1.1.Study of the Concentration polarization phenomenon
Polarization is an important phenomenon occurring in the separation of contaminants from the membrane system with horizontal flow. When the amount of treated water by the membrane increases the molecules and ions remain on the membrane surface and over time increases concentration at the membrane surface trough being accumulated on it. As the result, the concentration near the surface of the membrane is different from the concentrations of the main mass of the fluid. This concentration is reduced by increasing distance from the
1.2.Study of the Fouling phenomenon
Membrane fouling is defined as the reversible or irreversible accumulation of material on the surface or within the membranes so that the performance of the membrane would be changed. If the fouling is resolved by the action of backwashing and cleaning it is called reversible or if it requires the chemical cleaning action to be removed, it is called irreversible. Fouling causes the membrane pore diameter to reduce and may lead to the closure of some of them. Accumulation and sticking of the materials forms the layers on the surface of the membrane. These layers and the materials that remain in the membrane cause a higher resistance to fluid flow. With increasing the thickness and density of layers the resistance is gradually increased and thus the output flux of the membrane decreases over the time. NF and RO membranes are more susceptible to fouling than the rest of them. [Crittenden et al., 2005] In general the factors causing the fouling include: (1) deposits (2) biological materials (3) suspension solids (4) colloidal materials (5) Metal Oxides.
Here should be omitted the biological fouling is one of the most important types of fouling which is caused by extra-cellular polymeric materials and soluble microbial products.
1.3.Extracellular Polymeric Substances (EPS)
Extracellular polymer substances (EPS) are produced for the purpose of accumulation of germs, including biofilm formation, flocculation and activated sludge mixture. Extra-cellular polymer substance is a broad concept that includes different categories including macromolecules, polysaccharides, proteins, nucleic acids, phospholipids and other polymer compounds that exist inside or outside the cell surface or in the surface of the microbial cells. They include insoluble materials (polymers capsule, soft gels, polymers with loose ties and sticky organic matter) that are produced by active efflux, damage to cell membrane and cell death. The EPS network tasks are varied and involve collecting bacteria in biofilm and microbial clots, forming a protective layer on the bacteria, keeping water on the surface and
increase stickiness. Extracellular polymer substances may be responsible for the formation of a cake layer on the membrane and membrane fouling. [Rosenberger et al., 2006]
1.4. Soluble Microbial Products (SMP)
SMPs are the compounds that are dissolved in the cell and that are separated as the cell is destroyed or they penetrate the cell membrane and they are dumped out at the time of cell synthesis for specific reasons. In membrane bioreactors they are obtained by the decomposition and purification of the materials in the feed. It is obvious that the concepts of EPS and SMP is similar. During the process of filtration the SMP adsorption filtration process occurs. As more pores are blocked the gel form layer is formed on membrane surface. It forms the primary layer of biofilm and creates hydraulic resistance against penetration. Although the effect of soluble materials on fouling in membrane bioreactors in recent decades has been considered, its effect and concentration on membrane fouling were not considered before 2001. [Rosenberger et al., 2006]
2. MATERIALS AND METHODS
We need Some Equations to simulating the of biofouling by biological materials in membrane bioreactor.
2.1. Kinetic Model of SMP
SMP production in activated sludge systems can be expressed in Luedeking-Piret equation as follow:
rSMP = = + = +
(1)
Where rSMP is the SMP production rate, is
the SMP concentration in the fluid mass is the UAP concentration in the fluid mass, is
the BAP concentration in the fluid mass, is the UAP Impact form and is the BAP Impact form.
2.2. Kinetic Model of EPS
rEPS= = - khydXEPS
(2) Where rEPS is the EPS production rate, XEPS is
the EPS mass concentration and is the EPS Impact form, khyd is the EPS hydrolysis rate.
2.3. Main Equations for Modeling
In this figure, schematic view of the membrane module can be seen:
Fig. 1. Schematic view of the membrane module [Kazemi et al., 2013]
Due to the homogenous cake layer with constant resistivity material flux penetration can be calculated based on Darcy's law, given that our model has the series resistance:
Rt = Rm+ Rf + Rc (3)
Where Rt is the total resistance, Rc is the cake
resistance, Rm is the clean membrane resistance,
Rf is the resistance due to membrane internal
fouling.
(4)
Equation (4) is indicatetive of Darcy law where: J is the permeation flux, ∆P is the transmembrane pressure and µ is the dynamic viscosity of permeate. In fact, Rf represents the
irreversible resistance that occurs for the following reasons: 1- Internal membrane fouling which is the result of absorption of macromolecules on the inner walls of the membrane pores. 2- A thin layer that blocks the surface pores of the membrane which is the
result of the sticking of the suspended particles to the surface of the membrane. [Kazemi et al., 2013]
In case of the penetration in cylindrical core it is suggested that: the changes on the level of the cake and the cross-sectional area of the channel are reduced by growth of the radius (the curvature of the membrane). The following equation is obtained by the relationship between cake resistance Rc and cake special resistance kc
in terms of the mass balance.[Belfort et al., 1994]
(5)
Where is rhe specific cake resistance, is the channel height and is the cake thickness.[Kazemi et al., 2013]
During the filtration process the penetrated flux brings the suspension particles and salts to the membrane surface. At higher penetration rate the act of leaving the particles on the membrane surface is made easier. So it seems reasonable to say that the growth rate of the later is proportional to the amount of flux penetration. [Yazdanshenas et al., 2010] According to the assumptions it can be concluded that the cake growth can be calculated by the following ordinary differential equation:
(6)
Where α is the particle disposal rate from the
cake and is the steady state permeation flux. Combining equations (4) and (5) and (6) can be obtained the following differential equation for the cake growth rate:
(7)
In order to solve the equation (7) the value of must be constant. The overall mass balance for the liquid phase assuming an incompressible fluid is as follows:
QF = QR+Qp (8)
Also the mass balance for the solid particles can be written as follows:
(9)
(11)
Where is the particle density, is the Solid concentration of feed suspension in volume percentage, is the solid concentration of the suspension at module outlet in volume percentage, is the solid concentration of permeate product in volume percentage, is the solid concentration of the
cake in volume percentage, is the total feed flow rate, is the retentate flow rate, is the permeation flow rate, is the external radius of the membrane and L is the membrane length. In the above equations the particle volume fraction is calculated according to the following equation by dividing the concentration of solids to solids density:[Kazemi et al., 2013]
(12)
Where is the particle concentration and is the particle density. Also the formation rate of cake in the initial time (t=0) is calculated by the following equation:
= (13)
As it can be observed indicates the primary flux and its value in the absence of internal or external fouling is calculated as follows:
(14)
By substituting in equations (12) and (13), an equation is obtained that makes it possible to
calculate the rate of dumping particles from the membrane surface.
(15)
Finally all the above equations result in the following equation:
(16)
Finally, for the numerical solution of the equations listed in this article the data presented in the following tables were used:
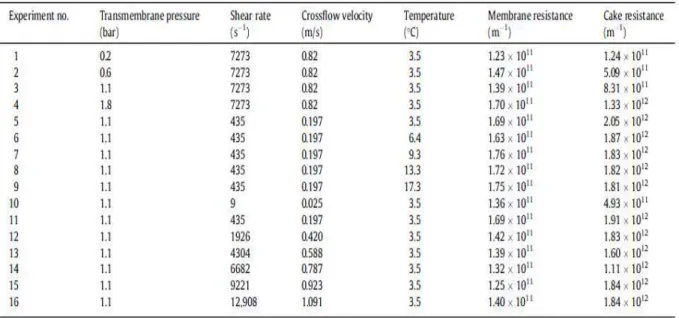
Table 1. The resistivity required for the filtration and cake samples resistivity in SMP samples in fixed operating pressure.[Jiang et al., 2012]
Table 3. Operating conditions for tests and cake resistivity values. [Kazemi et al., 2013]
3. RESULTS AND DISCUSSION
In this section the final results are analyzed and in the end their credibility will be investigated by comparing them with the graphs.
The tubular cross flow type of membrane is considered as it is shown in the following figure. This figure is drawn with GAMBIT software.
Fig. 2. Geometry of membrane
In this study the tetrahedral mesh form was considered for the membrane which gives better results rather than triangular mesh form. Therefore tetrahedral mesh is preferred over triangular mesh. The number of mesh should be chosen such that the mesh would be large enough so that the software would not need long-term calculations and it should be small enough that we obtain the best result. So it should be Mesh Independent.
the results obtained by 1000 mesh had no difference with that of 2000 or 4000 or 10000 results. Only the software calculation duration will be longer. Since the time issue is very important for the operator, the chosen solution should provide the result in the shortest possible time.
Fig. 3. Geometry of membrane with 1000 and 4000 cells
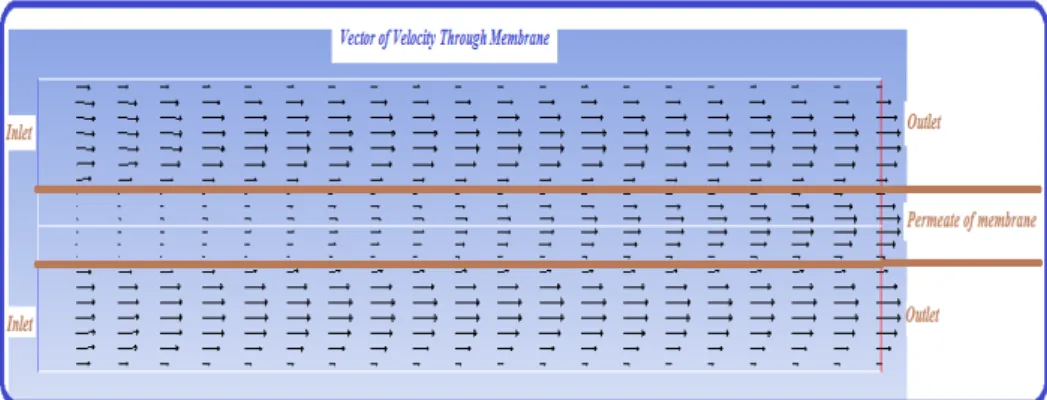
In the following graph the velocity of the fluid along the membrane (from the moment it is entered as the feed to the moment that is removed as permeate) is analyzed. The left side is the Inlet and the right side is the outlet.
Fig. 4. Contour of changes of fluid velocity depending on the membrane length
As can be seen in the figure the velocity inside and outside the membrane from the inlet to the outlet has an increasing trend. This trend appears to be significant within the membrane because we have less effective penetration surface foe the efflux of the fluid from the pores into the membrane and this makes the output flux has less efflux inside. As we advance in the membrane effective penetration level will increase, which results the increased leakage into the membrane. Increased leakage of fluid from the outside to the inside of the membrane causes the downstream flux in the membrane and this causes the fluid flow velocity to increase.
The following Figure presents the velocity to illustrate what has been discussed above.
Fig. 5. Contour of changes of fluid velocity profile depending on the membrane length
As can be seen the velocity profile is small at the membrane beginning and it is large at the end of the membrane that represents the increased rate of velocity the reason of which as mentioned previously is the increased effective penetration level along the membrane.
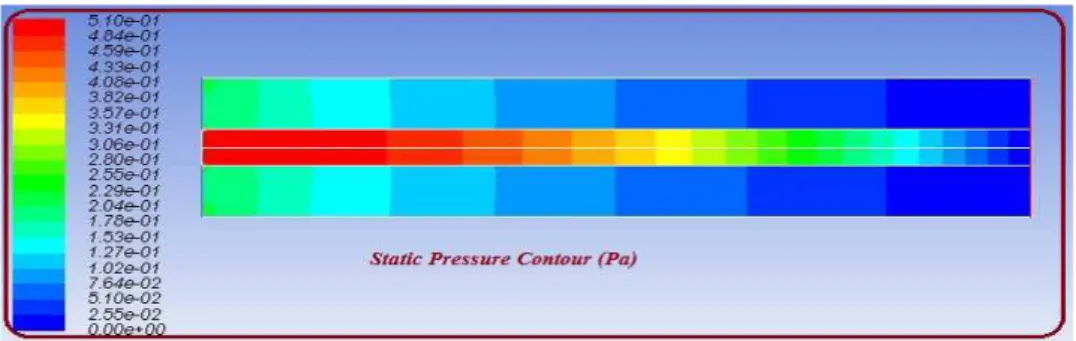
Fig. 6. The pressure variations of the fluid along the membrane
As it is clear from the figure the maximum amount of pressure is at the beginning of the membrane and the lowest pressure is observed at the end of the membrane, that is, as the fluid moves forward along the membrane it is subject to pressure reduction. The reason is obvious. As mentioned in the interpretation of Figure 4. with increasing effective penetration level the fluid flow velocity is increased. By increasing flow velocity the flow rate is reduced. As the fluid moves forward along the membrane its velocity is increased and its pressure is reduced.
The following chart shows the increase cake resistance to changes over the time:
Fig. 7. The increase cake resistance to changes over the time
In the fig. 7. the vertical axis shows the time changes according to time and the vertical axis shows the logarithmic values of resistance in m-1. The blue points represent the cake resistance at different times. The first part of the chart that has a steeper slope represents the concentration polarization phenomenon. In this area the cake is being formed and as the cake is formed more, its resistance becomes higher. After 4 hours the phenomenon of concentration polarization is ended and fouling starts. According to reference information the system needs to be replaced after 25 days. The chart only represents 22 hours of the process. The increased cake resistance continues until the filter is completely fouled.
In the fig. 8., the horizontal axis represents time and the vertical axis represents the time in terms of flux (m3 / m2.s), also the blue points represent the experimental results and the red curve presents the curve of modeling results. The error rate of the chart to the experimental results is 8.43% which seems logical.
4. CONCLUSION
In this paper, a mathematical model changing over the time is developed to describe and evaluate the effects of different parameters on the membrane performance in membrane bioreactor (MBR). Using this model, we can study the changes of flow rate over time in the membrane bioreactor. Using data obtained from this model and their comparison with experimental data, we find that the form and the overall rate of flow changes according to the time is predictable using this model. The data of this model with experimental data has some error which caused by the following factors: Biological membranes impurities, human error on the part of the testing person, error caused by numerical calculations, which always makes some errors in the system considering additional assumptions for the numerical solution of equations by the author
In this paper, the velocity changes along the membrane, the membrane pressure, cake resistance changes according to time and flux changes over time were presented. The first two cases presented the fluid regime inside the membrane and the next two cases presented the membrane fouling type.
5. REFERENCES
1. Madaeni,S,S. Membrane and Membrane Processes, Tagh Bostan Publication, 2002, 53-59.
2. Wilber, M.C. Thr desalting and water treatment membrane manual: A guide to membrane for municipal water treatment, Report No.1, Denver, Colorado, USA, 1993. 3. Crittenden, J.C., Rhodes, T.R., Hand, D.W.,
Howe, K.J. & Tchobanoglous, G. Water Treatment: Principles & Design. 2nd. John Wiley & Sons Inc,2005.
4. Rosenberger, S., Laabs, C., Lesjean, B., Gnirss, R., Amy, G., Jekel, M., Schrotter, J.C. Impact of colloidal and soluble organic material on membrane performance in membrane bioreactors for municipal wastewater treatment,Water Res. 40 (4), 710–720,2006.
5. Kazemi, M.A., Soltanieh, M., Yazdanshenas, M. Mathematical modeling of crossflow microfiltration of diluted malt extract suspension by tubular ceramic membranes, Journal of Food Engineering, 116 ,926–933, 2013.
6. Belfort, G., Davis, R.H., Zydney, A.L. The behavior of suspensions and macromolecular solutions in crossflow microfiltration. J. Membr. Sci. 96, 1–58, 1994.
7. Yazdanshenas, M., Soltanieh, M., Tabatabaei Nejad, S.A.R., Fillaudeau, L. Cross-flow microfiltration of rough non-alcoholic beer and diluted malt extract with tubular ceramic membranes: investigation of fouling mechanisms. J. Membr. Sci. 362, 306–316, 2010.
8. Jiang, Tao. Characterization and Modelling of Soluble Microbial Products in Membrane Bioreactors, Thesis for Ph.D. Degree of Biological sciences, University of Gent, Belgium, 2012.
![Fig. 1. Schematic view of the membrane module [Kazemi et al., 2013]](https://thumb-eu.123doks.com/thumbv2/123dok_br/18138586.326150/3.892.111.428.303.538/fig-schematic-view-membrane-module-kazemi-et-al.webp)
![Table 1. The resistivity required for the filtration and cake samples resistivity in SMP samples in fixed operating pressure.[Jiang et al., 2012]](https://thumb-eu.123doks.com/thumbv2/123dok_br/18138586.326150/4.892.253.641.828.1076/resistivity-required-filtration-samples-resistivity-samples-operating-pressure.webp)