International Journal of Advanced Biotechnology and Research (IJBR) ISSN 0976-2612, Online ISSN 2278–599X,
Vol-7, Special Issue-Number4-June, 2016, pp597-607 http://www.bipublication.com
Case Report
Investigating the effect of relationship marketing aspects on customer
satisfaction (Case Study: Boroujerd textile factory)
1
Emadldin Hezavehi and 2Kasra Ghafoori
1
Department of textile engineering, 2Department of Industrial engineering, Arak Branch, Islamic Azad University, Arak Branch, Iran
ABSTRACT:
In this paper was investigated the effects relationship marketing on customer loyalty and satisfaction.By a 5-point questionnairewere collected Experts and customers opinion in Borujerd textile factory.Then, using statistical methods,significantly and accuracy of Questionnaire was confirmed. Using regression and Kolmogorov-Smirnov test the relationship between independent and dependent variables were examined.Interaction and communication factors have a significant impact on customer satisfaction, alsobonding and empathy dimensions have moderate sensitivity on customer satisfaction. And dimensions of commitment and common values showedlow relatively impact on customer satisfaction.
Keywords: relationship marketing, customer satisfaction
1.INTRODUCCTION:
The concept of relationship marketing has occupied much attention because fully covers long-term approach to marketing. Since this approach is focused on customer lifetime not on value of the transaction only. Relationship marketing orientation is to gain customer share, not market share. The underlying assumption is that building and maintaining relationships with customers and maintain customer. Develop customer share and increase profits will rise and when problems occur it is essential to improve relations. Therefore, relationship marketing as a business strategy is increasingly important. Orientation relationship means that marketing focus on customer retention by maintaining and strengthening the relationship over time would be win-win. This approach means that when a customer has more calls to the service provider, or when services are provided over a long period and also when the client understands that the
relationship is important is likely to develop relations. Based on the above discussion, it seems that there are certain conditions that led to the formation of strong relationships with customer. On the contrary, there are conditions that reduce the development of relations.
In addition, there are some basic assumptions that inherent is relationship marketing, including: - A relationship can be formed with all clients and in all conditions of services; it indicates that all organizations should participate in the development of relations.
- As the duration of the relationship increases, the power connection will also increase.
- Whatever customer Contacts with a particular service provider become more,
There are more opportunities to strengthen the relationship.
If the customer give more important in answer to such relationships the strength of relationship will further (Ward and Dagger,2007,281)
Customer satisfaction defines such as: Emotional response reflects to extent that the service is providing and joy of fulfilling to the customer's needs and goals. Pleasure refers, when pleasure increases that needs and goals will implement, or to reduce pain and anxiety. Fulfilling the needs and objectives set according to the expectations of our customers and customer expectations, with the pattern of Hope / disapproval, provide a clear framework to judge satisfaction if the perceived service performance exceeds expectations the likely result is satisfactory. On the other hand if the perceived service performance does not meet expectations most likely result is dissatisfaction (Tam et al., 2012, 34).
May the satisfied customer be excellent resource to increase profitability. It is for this reason that satisfied customers are likely is committed to the service organization. And have better social interaction with their service provider. While dissatisfied customers complain more and have less repurchase However, satisfied customers in the future, only to be followed by a service provider and also be willing to pay a tip for that service. Satisfied customers are one of the main factors that affect the intention to repurchase. Another satisfied customer support to enterprise is positive word of mouth. (Kitapci,etal).
1.1. Literature Review
It has been shown that the benefits of the relationship may be different among service industries and that research should focus on specific sectors ,there is Several empirical studies on the link between relational benefits, customer satisfaction And behavioral consequences in financial services.
Molina et al (2007) reported similar conclusions in retail banking in most service activities. Which confirms that only benefits make a significant and positive impact on satisfaction; meanwhile behavioral outcomes in this study were not included (Dimitryadys, 2010, 298).
industry with uses of relationship marketing strategies is discussed.
1.2.Research hypotethies:
1. The relationship marketing has a positive impact on customer satisfaction.
2. The commitment aspect of relationship marketing has a positive impact on customer satisfaction
3- The bonding aspect of relationship marketing has a positive impact on customer satisfaction. 4. The communication aspect of relationship marketing has a positive impact on customer satisfaction.
5. The shared value aspect of relationship marketing has a positive impact on customer satisfaction.
6. The empathy aspect of relationship marketing has a positive impact on customer satisfaction. 7. The reciprocity aspect of relationship marketing has a positive impact on customer satisfaction.
2-MATERIALS AND METHODS 2.1.population
In doing any research determine the population is a precondition,because must know their ways researchers from before. To be able to gather information about it and analyzing the required data. Statistical sample consists of a limited number of sections of the statistical population which express the main characteristics of the statistical population (Azar and Momeni, 2001, 6). Statistical population consisted of all Boroujerd Textile factory customers that their numbers is 135 this research.
2.2 Data collection tools
Necessary data for this study were collected using a questionnaire. The questionnaire used in this study, consisting of 22 questions to assess the dimensions of relationship marketing on customer satisfaction in Boroujerd Textile factory.Valuation Criteria for this study questionnaire is five Likert scale.At first the questionnaire questions on recognized Descriptive characteristics of the study population is presented, these questions involved
issues such as (gender, age, education and work experience).
In the present study, to collect the data is used from the investigator questionnaire and database.
3. RESULTS AND DISCUSSION
In this section, research hypotheses examined one by one and in this way the linear regression analysis was used.
Investigating the research hypothesis:
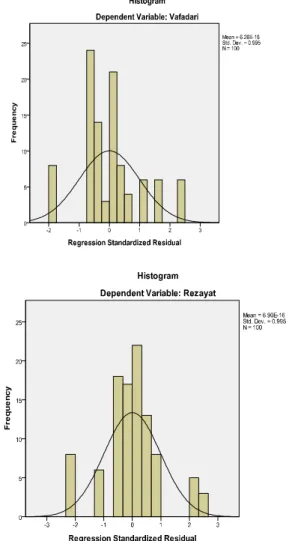
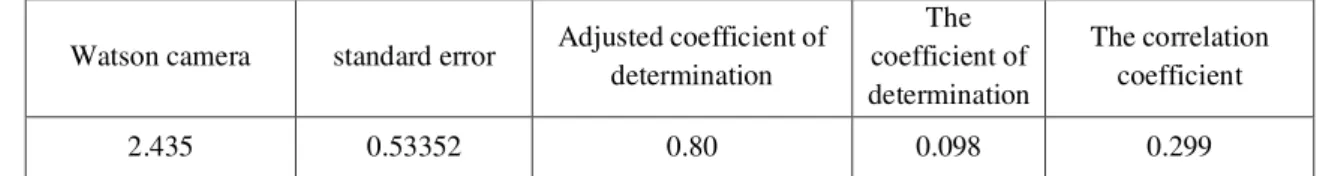
In this section, research hypotheses examined in order, and implicitly test preconditions linearity and checked Durbin-Watson. Because of being Common the dependent variables of customer satisfaction and without repeating the normal curve in the histogram of the study and related charts is presented below:
- Hypothesis 1. Relationship marketing has a positive impact on customer satisfaction.
Table 2 summarized table of first hypothesismodel
Watso n camer
a
standar d error
Adjusted coefficient
of determinatio
n
The coefficient
of determinatio
n
The correlatio
n coefficie
nt
2.28 0.3598
6 0.581 0.586 0.765
The above table shows that the correlation coefficient value obtained 0.765which shows the strong relationship between variables. The Watson camera value for this hypothesis was obtained 2.28 that are in range 5/2 to 5/1.And soconforms the default regressionErrors in Independence.
Table 1 .first hypothesis ANOVA table
model sum of squares
Degrees of freedom Average
square Statistics of
F Significance
level
regression 17.939
1 17.939
138.531 0
Remaining 12.691
98 0.130
Total 30.630
98
The above table indicates that the variables in the regression were significant in o.o1 error level. In other words, the linear regression coefficient of 99% is confirmed.
Table 2. First hypothesis Regression Table
model Not standardized
Standardized t
Sig.
B standard error
Beta
Fixed amount 0.952
0.149 6.394
0
Relationship marketing 0.595
0.051 0.765
11.770 0
Due to the significant level test were equal to zeroAnd the amount of error is less than 0.01So the hypothesis is confirmed .In other words, it can be stated that, relationship marketing has a positive impact on customer satisfaction.Based on the amount of beta that was 0.765 Is specified in exchange for a unit change in standard deviation the variable of relationship marketing; Customer satisfaction is moved on the variable standard deviation 0.765 Which shows the high sensitivity of the independent variables. Column B is also based on the assumption of linear regression equation to the following image:
0.952 + (0.595) = relationship marketing and customer satisfaction
- Hypothesis 1-1. Commitment aspect of relationship marketing has a positive impact on customer satisfaction.
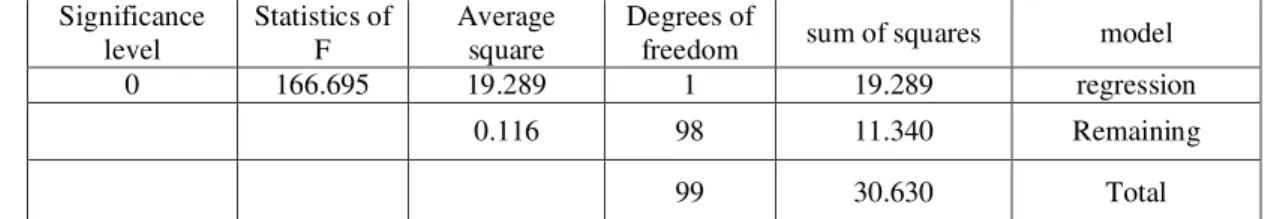
Table 3. Table 1-1 summarizes the theory Model
Watson camera standard error Adjusted coefficient of determination
The coefficient of determination
The correlation coefficient
2.435 0.53352 0.80 0.098 0.299
The above table shows that the correlation coefficient value obtained by 0.299 Which shows the weak relationship between variables. The Durbin-Watson value for this hypothesis was that equal to 2.43 that is In the range of 5/1 to 5/2 and thus regression Default confirmed in the context of the independence of errors.
Table 4. ANOVA Table hypotheses1-1
model sum of squares
Degrees of freedom Average
square Statistics of
F Significance
level
regression 2.735
1 2.735
Remaining 27.895
98 0.285
Total 30.630
99
The above table indicates that the variables in the regression were significant in error level to 0. 01 In other words linear regression with 99% safety is confirmed.
Table 5 - regression Table of hypotheses 1-1
model Not standardized
Standardized t
Sig.
B standard error
Beta
Fixed amount 2.278
0.132 17.247
0
commitment 0.166
0.038 0.299
1.003 0.003
Due to the significance level of the test was 0.003 and this amount of error isless than 0.01 so the hypothesis is confirmed In other words, it can be stated that the Commitment aspect of relationship marketing has a positive impact on customer satisfaction. But based on Beta value is determined for a unit change in the standard deviation Commitment variable;Standard deviation customer satisfaction variable is moved as 0.299 which shows the relatively low sensitivity of the independent variables.
Column B is also based on the hypotheses linear regression equation to the following image: 2.278 + (0.116) Commitment =customer satisfaction
- Hypotheses 1-2Bonding aspect of relationship marketing has a positive effect on customer satisfaction Tabble6-Table 1-2 summarizes the hypotheses Model
Watson camera standard error Adjusted coefficient of determination
The coefficient of determination
The correlation coefficient
2.01 51.981 0.127 0.135 0.368
The above table shows that the correlation coefficient value obtained by0. 368 Which shows the average power relationship between variables.The Durbin-Watson value for this hypothesis was equal to 2.01 that is in the range of 105 to 2.5 and thus confirm the default regression in the context of the independence of errors.
Table6- ANOVA hypotheses Table 1-2
model sum of squares
Degrees of freedom Average
square Statistics of
F Significance
level
regression 4.150
1 4.150
15.358 0
Remaining 26.480
98 0.270
Total 30.630
99
Based on the results of the regression between variables was significant in other words, the error level 0.01 linear regression with 99% safety factor is confirmed.
Table -8 hypotheses1-2 regression table on the
model Not standardized
Standardized t
Sig.
B standard error Beta
Fixed amount 1.886
0.202 9.321
0
bonding 0.225
0.057 0.368
3.919 0
Standard deviationbonding aspect; Customer satisfaction is moved to the variable Standard deviation 0.368, indicating low sensitivity of the independent variables. Column B is also based on the hypotheses linear regression equation to the following image:
886/1 + (225/0) bonding= customer satisfaction
- Hypotheses 1-3. Communication aspect, relationship marketing has a positive impact on customer satisfaction.
Table 9. Table 1-3 summarizes the hypotheses Model
Watson camera standard error Adjusted coefficient of determination
The coefficient of determination
The correlation coefficient
2.024 34017 0.626 0.630 0.794
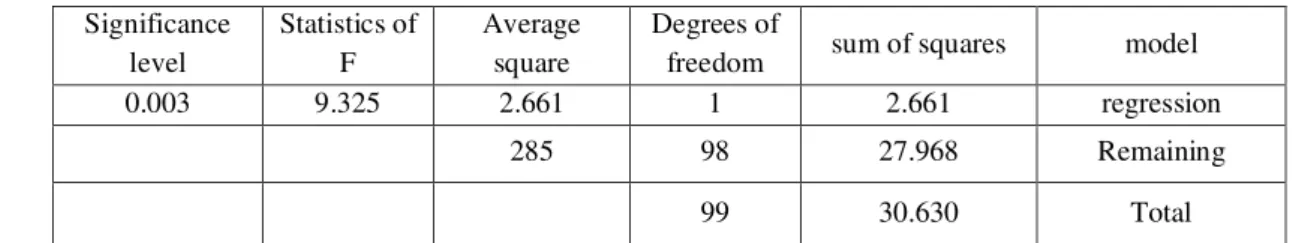
The above table shows that the correlation coefficient value obtained by 0.794 which shows the high relationship between variables. The Durbin-Watson value for this hypothesis was equal to 2. 02 that is In the range of 1.5 to 2.5 And so confirm the default regression in the context of the independence of errors. Table 10. ANOVA Table hypotheses 1-3
model sum of squares
Degrees of freedom Average
square Statistics of
F Significance
level
regression 19.289
1 19.289
166.695 0
Remaining 11.340
98 0.116
Total 30.630
99
The results show;Regression between variables in the level of 0.01 error was significant In other words, the linear regression with 99% confidence is confirmed
Table 11. Regression Table of hypotheses 1-3
model Not standardized
Standardized t
Sig.
B standard error
Beta
Fixed amount 1.445
0.099 14.534
0
communication 0.441
0.034 0.794
12.911 0
Due to the significant level test were equal to zeroand this amount is less than o.o1 error so the hypotheses is confirmed. In other words it can be said that communication aspectof relationship marketing has a positive impact on customer satisfaction. Based on the beta value is determined for a unit change in the variable Standard deviation Communications aspect؛Standard deviation of customer satisfaction variablemoves to 0.794 which shows the high sensitivity of the independent variables.
Column B is also Based on thehypotheses linear regression equation to the following image: 1.445 + (0.441) Communications = customer satisfaction
- Hypotheses 1-4.shared value aspect of relationship marketing has a positive impact on customer satisfaction
Table 12. Summary Table model hypotheses 1-4
Watson camera standard error Adjusted coefficient of determination
The coefficient of determination
The correlation coefficient
2.111 0.53422 0.087 0.087 0.295
Table 13. ANOVA Table hypotheses 1-4
model sum of squares
Degrees of freedom Average
square Statistics of
F Significance
level
regression 2.661
1 2.661
9.325 0.003
Remaining 27.968
98 285
Total 30.630
99
The results show; There was significant difference between the variables In the regression error level 0.01 .In other words, the linear regression coefficient of 99% is confirmed.
Table 14. Regression Table of hypotheses 1-4
model Not standardized
Standardized t
Sig.
B standard error
Beta
Fixed amount 2.302
0.126 18.222
0
Shared value 0.124
0.041 0.295
3.054 0.003
Regression analysis shows a significant level of 0.003 tests and this amount of error isless than 0.01So the hypotheses is confirmed .In other words it can be said that aspectshared value of relationship marketing has a positive impact on customer satisfaction. Based on the beta value is determined for a unit change in the variable Standard deviationshared values aspect;Standard deviation variable customer satisfactionmoves to 0.295 which indicates the low sensitivity of the independent variables.
Column B is also Based on thehypotheses linear regression equation to the following image: 2.302 + (0.124) shared value = customer satisfaction
- Hypotheses 1-5. Empathy aspect of relationship marketing has a positive impact on customer satisfaction.
Table 15. Summary Model hypo theses Table 1.
Watson camera standard error Adjusted coefficient of determination
The coefficient of determination
The correlation coefficient
1.781 0.45489 0.331 0.338 0.581
The above table shows that the correlation coefficient value obtained by 0.581 which shows the moderate relationship between variables the Durbin-Watson value for these hypotheses was equal to 1.78which is in the range of 1.5 to 2.5And so confirmed the default regression in the context of the independence errors.
Table 16. ANOVA Table hypotheses 1-5
model sum of squares
Degrees of freedom Average
square Statistics of
F Significance
level
regression 10.351
1 10.351
50.025 0
Remaining 20.278
98 207
Total 30.630
99
The results show; There was significant difference between the variables in the regression error level 0.01 .In other words; the linear regression coefficient of 99% is confirmed.
Table 17. Regression Table hypotheses 1-5
model Not standardized
Standardized t
Sig.
B standard error
Beta
Fixed amount 1.695
0.143 11.880
0
empathy 0.355
0.050 0.581
Regression analysis shows a significant level test were equal to zeroAnd this amount of error isless than 0.01So the hypotheses is confirmed And In other words it can be said that empathy aspect of relationship marketing has a positive impact on customer satisfaction. Based on the beta value is determined for a unit change in the variable Standard deviation empathy;Standard deviation customer satisfaction variable moves to 0.581 which indicates the average sensitivity towards independent variables.
Column B is also Based on thehypotheses linear regression equation to the following image: 0.355 + (0.581) empathy = customer satisfaction
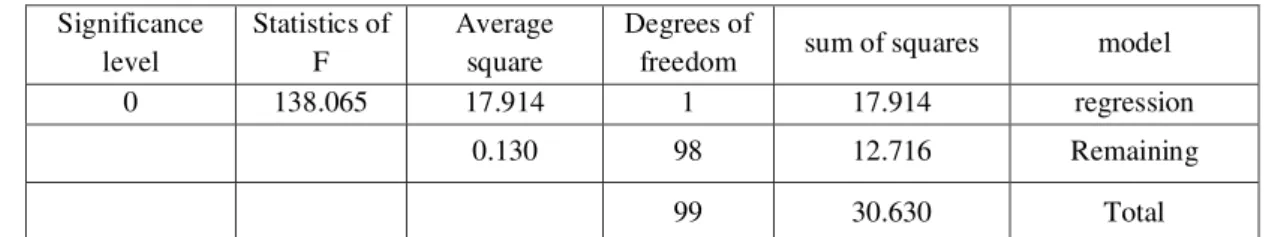
- Hypotheses 1-6. Reciprocity Aspect of relationship marketing has a positive impact on customer satisfaction
Table 20. Summary Table model hypotheses1-6
Watson camera standard error Adjusted coefficient of determination
The coefficient of determination
The correlation coefficient
2.096 0.36021 0.581 0.585 0.765
The above table shows that the correlation coefficient value obtained by 0.765 which indicates the high intensity relationship between variables. The Durbin-Watson value for this hypothesis was equal to 2.09which is in the range of 1.5to 2.5 and so confirmed the default regression in the context of the independence of errors.
Table 18. Table ANOVA hypotheses 1-6
model sum of squares
Degrees of freedom Average
square Statistics of
F Significance
level
regression 17.914
1 17.914
138.065 0
Remaining 12.716
98 0.130
Total 30.630
99
Based on the results in the table above; there was significant difference between the variables in the regression error level 0.01 and In other words linear regression with 99% safety factor is confirmed.
Table 19. Regression Table of hypotheses 1-6
model Not standardized
Standardized t
Sig.
B standard error
Beta
Fixed amount 1.737
0.086 20.234
0
reciprocity 0.401
0.034 0.765
11.750 0
Regression analysis shows a significant level test were equal to zeroand this amount of error isless than 0.01So the hypotheses is confirmed In other words, it can be stated that reciprocity aspect of relationship marketing has a positive impact on customer satisfaction. Based on the beta value is determined for a unit change in the variable Standard deviation reciprocity aspect;Standard deviation customer satisfaction variable moves to 0.765which shows the high sensitivity of the independent variables.
Column B is also Based on thehypotheses linear regression equation to the following image:
1.737 + (0.401) empathy = customer satisfaction
4. CONCLUSION AND RECOMMENDATIONS Hypothesis 1
change in the standard deviation of relationship marketing variable; Customer satisfaction is moved on the variable standard deviation 0.765 which shows the high sensitivity of the independent variables. The results of this thesis conclude that an increase / decrease in relationship marketing,Customer satisfaction increases / decreases. In this respect, it is recommended to increase the scale of relationship marketing with the creation of such a commitment, reciprocity and strive to increase customer satisfaction. Hypothesis 1: 1 commitment
Commitment aspect of relationship marketing has a positive impact on customer satisfaction. Due to the significance level of the test was 0.003and this amount of error is less than 0.01so the hypothesis is confirmed .In other words, it can be stated that the commitment aspect of relationship marketing has a positive impact on customer satisfaction. However beta value is determined that for a unit change in the standard deviation Commitment variable;Standard deviation customer satisfaction variable is moved as 0.299 which shows the relatively low sensitivity of the independent variables.
It can be concluded that by increasing commitment aspect of relationship marketing, such as Abiding by the promise that at the time of marketing, is promised, will be increased the level of customer satisfaction.
Hypothesis 2: 1 bonding
Bonding aspect of relationship marketing has a positive impact on customer satisfaction.
Given that a significant level test were equal to zeroAnd this amount of error is less than 0.01 so the hypothesis is confirmed. In other words, it can be stated bonding aspect of relationship marketing has a positive impact on customer satisfaction.However based on beta value is determined that for a unit change in the variable Standard deviationbonding aspect; Customer satisfaction is moved to the variable Standard deviation 0.368, indicating low sensitivity of the independent variables This hypothesis can be concluded that withincreasingtheBonding aspect
of relationship marketingcustomer satisfaction will Increase. Therefore it is recommended that staff try to make contact and rapport with clients that they can ultimately increase customer satisfaction.
Hypothesis 3: 1 Communications
Communication aspect of relationship marketing has a positive impact on customer satisfaction. Given that a significant level test were equal to zeroAnd this amount of error is less than 0.01so the hypothesis is confirmedIn other words, it can be stated Communication aspect of relationship marketing has a positive impact on customer satisfaction. Based on the beta value is determined for a unit change in the variable Standard deviation Communications aspect؛Standard deviationof customer satisfaction variablemoves to 0.794 which shows the high sensitivity of the independent variables. In this regard it can be concluded that communications aspect of relationship marketing can increase customer satisfaction.In this respect, it is recommended by linking honest and accurate strive to communicate with customers and to create a platform that customers can easily communicate with officialsand express their needs and desires andthey can also discuss with them about the reasons for their dissatisfaction to ultimately increase customer satisfaction.
Hypothesis 4 -1 shared values
Shared value aspect of relationship marketing has a positive impact on customer satisfaction.
demands of our customers So this way they can create shared value between companies and their customers And therefore they have in common, in terms of products and such issuesTo thereby increase customer satisfaction.
Hypothesis 5 -1 Sympathy
Empathy aspect of relationship marketing has a positive impact on customer satisfaction.
Regression analysis shows a significant level test were equal to zeroand this amount of error is less than 0.01so the hypothesis is confirmed. In other words it can be said that empathy aspect of relationship marketing has a positive impact on customer satisfaction.
Based on the beta value is determined for a unit change in the variable Standard deviation empathy;Standard deviation customer satisfaction variable moves to 0.581 which indicates the average sensitivity towards independent variables. In this respect, empathy and sympathy management can make empathy and sympathy at the corporate level shows to the staff and teach them that they should have empathy with customersand not just think about sales and profitabilitybut have an empathy and sympathy with them. So as to be able to look at issues from their perspectiveand have mutual understanding of each otherand thereby provide customer satisfaction.
6-1 Reciprocity hypothesis
Reciprocityaspect of Relationship marketing has a positive impact on customer satisfaction.
Regression analysis shows a significant level test were equal to zeroand this amount of error is less than 0.01so the hypothesis is confirmed In other words, it can be stated that mutual relations, relationship marketing has a positive impact on customer satisfaction. Based on the beta value is determined for a unit change in the variable Standard deviation reciprocity aspect;Standard deviation customer satisfaction variable moves to 0.765which shows the high sensitivity of the independent variables.
In this regard can recommend that company act to its promises and do not forget its customers and
by creating the reciprocity with customers listen to their demands. So that they can manufacture their products in such a way that they are available for them to this way increase company customer satisfaction.
According to the results, it can be argued that it is important to customers that the company has not forgotten themand in any situation act to their promises.In addition, customers expectif in a position to understand Conditionsand they help company,The Company also appreciates this matter And the perfect opportunity compensate it. When cooperation becomes mutual in relation Customers are satisfied of the company. Therefore it is recommended:
• Implementation of customer compensationin a case the product has been deducted and customer give service to the organization as there is a need to tackle.
• Careful planning and science to fulfillment of the promises and avoid ideal plans that cause delay or renege on its obligations.
• Create a database of customers and keep in touch with them through email and SMS at national days and festivals or fairs and time allowances and Or even calling customers and create an emotional relationship with them.
REFERENCES:
1. Ranjbarian t b, M. Barari,2009, "The effect of the foundations of relationship marketing on customer loyalty: comparing public and private banks", Journal of Business Management, Volume 1, Number 2, 100-83.
2. Samadi, M., Nourani , FarsiZadeh, H., 2009, "The effect of relationship marketing tactics on buying behavior in BPA Clothing stores using structural equation modeling", Journal of Business Research Letter, Issue 53, Page 223 -203.
4. Hooman, H., 2005, "Structural equation modeling using LISREL", the publisher, first printing.
Latin resources
5. Kitapci, Olgun., Ibrahim Taylan, Dortyol, Zu¨hremYaman, Mustafa Gulmez, (2013), "The paths from service quality dimensions to
customer loyalty An application on
supermarket customers", Management
Research Review, Vol. 36 No. 3, pp. 239-255 6. Rashid, T., (2003), "Relationship marketing:
case studies of personal experiences of eating out", British Food Journal, Vol.1.5, No.10, pp.742-750.
7. Tam M.Y Lin., Kuan-Yi Lu. andJia-Jhou Wu., (2012), “The effects of visual information in
eWOM communication”, Journal of Research
in Interactive Marketing, Vol. 6 No. 1, pp. 7-26.