Submitted 13 July 2015 Accepted 7 September 2015 Published1 October 2015
Corresponding author
Yousof Gheisari, ygheisari@med.mui.ac.ir
Academic editor
Julie Thompson
Additional Information and Declarations can be found on page 8
DOI10.7717/peerj.1284
Copyright
2015 Abedi and Gheisari
Distributed under
Creative Commons CC-BY 4.0
OPEN ACCESS
Nodes with high centrality in protein
interaction networks are responsible for
driving signaling pathways in diabetic
nephropathy
Maryam Abedi1and Yousof Gheisari1,2
1Department of Genetics and Molecular Biology, Isfahan University of Medical Sciences, Isfahan,
Iran
2Regenerative Medicine Lab, Isfahan Kidney Diseases Research Center, Isfahan University of
Medical Sciences, Isfahan, Iran
ABSTRACT
In spite of huge efforts, chronic diseases remain an unresolved problem in medicine. Systems biology could assist to develop more efficient therapies through providing quantitative holistic sights to these complex disorders. In this study, we have re-analyzed a microarray dataset to identify critical signaling pathways related to diabetic nephropathy. GSE1009 dataset was downloaded from Gene Expression Omnibus database and the gene expression profile of glomeruli from diabetic nephropathy patients and those from healthy individuals were compared. The protein-protein interaction network for differentially expressed genes was constructed and enriched. In addition, topology of the network was analyzed to identify the genes with high centrality parameters and then pathway enrichment analysis was performed. We found 49 genes to be variably expressed between the two groups. The network of these genes had few interactions so it was enriched and a network with 137 nodes was constructed. Based on different parameters, 34 nodes were considered to have high centrality in this network. Pathway enrichment analysis with these central genes identified 62 inter-connected signaling pathways related to diabetic nephropathy. Interestingly, the central nodes were more informative for pathway enrichment analysis compared to all network nodes and also 49 differentially expressed genes. In conclusion, we here show that central nodes in protein interaction networks tend to be present in pathways that co-occur in a biological state. Also, this study suggests a computational method for inferring underlying mechanisms of complex disorders from raw high-throughput data.
Subjects Bioinformatics, Computational Biology, Nephrology
Keywords Diabetic nephropathy, Microarray analysis, Protein interaction maps, Systems biology
INTRODUCTION
strategy, invaluable information has been obtained on the molecular basis of various diseases such as macular degeneration, myocardial infarction, metabolic syndrome, and kidney fibrosis (Dumas, Kinross & Nicholson, 2014;Ghasemi et al., 2014;Jin et al., 2012;Morrison et al., 2011). Systems biology with its global view has an exclusive potential to extract the meaning from bulk, sometimes ambiguous data derived fromomics
technologies. It can also provide a mechanistic view via generation of mathematical models (Azeloglu et al., 2014;Cedersund et al., 2008;Swameye et al., 2003).
Chronic kidney disease (CKD) is a common debilitating disorder consuming a considerable fraction of health budgets (Trivedi, 2010). CKD secondary to diabetes mellitus, known as diabetic nephropathy, is the most common subtype. Although lots of previous studies have identified the pathogenic role of individual genes and signaling pathways in DN, a systematic holistic view has rarely been attempted for this complex disorder. Among systematics studies in DN,Starkey et al. (2010)have shown altered retinoic acid metabolism in diabetic mouse kidney by proteomics analysis. Similarly, using network analysis approach,Sengupta et al. (2009)have predicted the interaction of PTPN1 with EGFR and CAV1 in DN vascular complications. However, the functional significance of the network topology parameters has not been thoroughly assessed in this disorder.
Here, we have reanalyzed a microarray dataset originally deposited byBaelde et al. (2004)which compares the expression profile of glomeruli from DN and normal individ-uals. Their analyses revealed some differentially expressed genes (DE genes) among which VEGF and Nephrin down-regulation were confirmed by real time PCR. Also, their gene ontology (GO) analysis predicted pathways such as nucleic acid metabolism, Neuropeptide signaling pathway and Actin binding to be related to DN. Here, we reanalyzed this dataset with a different statistical significance detection method which resulted in a dissimilar number of DE genes. In addition, we have constructed a protein-protein interaction network (PPI) and employed graph theory concepts to assess the network topology. Critical nodes were then selected for pathway enrichment analysis. This computational approach may also be employed for other large datasets to deepen our understandings of chronic diseases by extracting meaningful concepts from bulk raw data of high-throughput technologies.
MATERIALS AND METHODS
Microarray datathree normal samples were compared to three DN samples by Student’st-test. Forp-value correction, Benjamini–Hochberg false discovery rate method was applied. Genes with adjustedp-value of less than 0.05 were considered as differentially expressed.
Protein-protein interaction network
Using CluePedia plugin version 1.1.3 (Bindea, Galon & Mlecnik, 2013) of Cytoscape software version 3.1.0 (Shannon et al., 2003) a PPI network was constructed for DE genes in the microarray dataset. STRING database with confidence cutoff 0.80 was used for retrieving interactions. The network topology was analyzed by Cytoscape NetworkAnalyzer tool and network topology measures such as Degree, Betweenness, Closeness Centrality, and Clustering Coefficient were calculated.
Pathway enrichment analysis
Pathway enrichment analysis was performed using Cytoscape ClueGO plugin version 2.1.3 (Bindea et al., 2009). In this analysis, Bonferroni step down was applied forp-value adjustment and pathways with adjustedp-value<0.05 were selected.
RESULTS
The quality of the microarray dataset was assessed and differen-tially expressed genes were identified
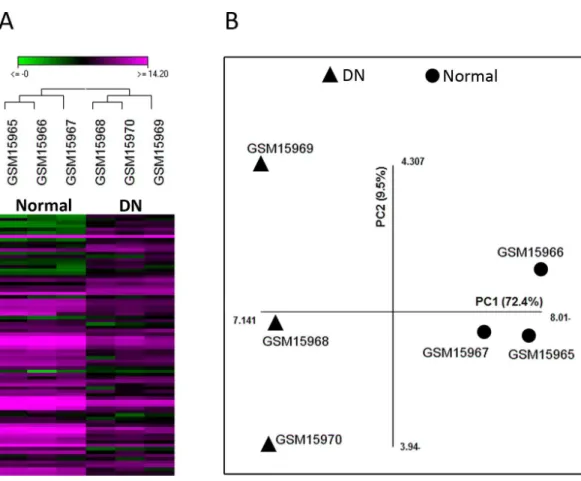
In this study, we re-analyzed the microarray dataset GSE1009 which compares glomeruli samples from DN patients and healthy individuals. Comparison of the two groups by GEO2R revealed that 49 genes were differentially expressed with adjustedp-value<0.05 (Table S1). As different parameters such as the efficiency of RNA extraction and spot detection can influence the validity of microarray experiments, we assessed the suitability of this dataset for further analysis by unsupervised hierarchical clustering and PCA with the data of the 49 genes. Both these methods could differentiate samples based on disease state (normal or DN), indicating the acceptable quality of this dataset (Fig. 1).
The PPI network and pathway enrichment analysis of differentially expressed genes were not informative
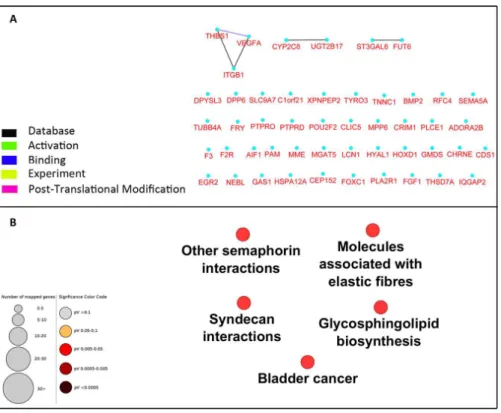
To investigate the interaction between the 49 selected genes from the microarray dataset, we constructed a PPI network using Cytoscape CluPedia plugin. Although various kinds of interactions with different evidences (activation, post-translational modification, binding, database, experiment) were allowed to be shown, unexpectedly, only few genes revealed to be interacting (Fig. 2A). Next, to infer pathways that are related to these 49 genes, pathway enrichment analysis was performed which showed only 5 pathways with no overlap genes. These pathways were not previously shown to be related to DN (Fig. 2B).
Pathway enrichment analysis of central genes in the enriched PPI network could detect critical pathways in DN
Figure 1 The quality of microarray GSE1009 dataset is satisfying.The heat map diagram shows the result of unsupervised hierarchical clustering for diabetic (GSM15968, GSM15969, and GSM15970) and normal (GSM15965, GSM15966, and GSM15967) samples based on the data of the top differentially expressed genes. GSM15969 is the technical replicate of GSM15968 and GSM15966 is the technical replicate of GSM15965. Each row represents a gene and each column represents a sample (A). Principal component analysis was performed on all samples based on the most up/down regulated genes. The first principle component (PC1) separates samples into DN and normal groups (B).
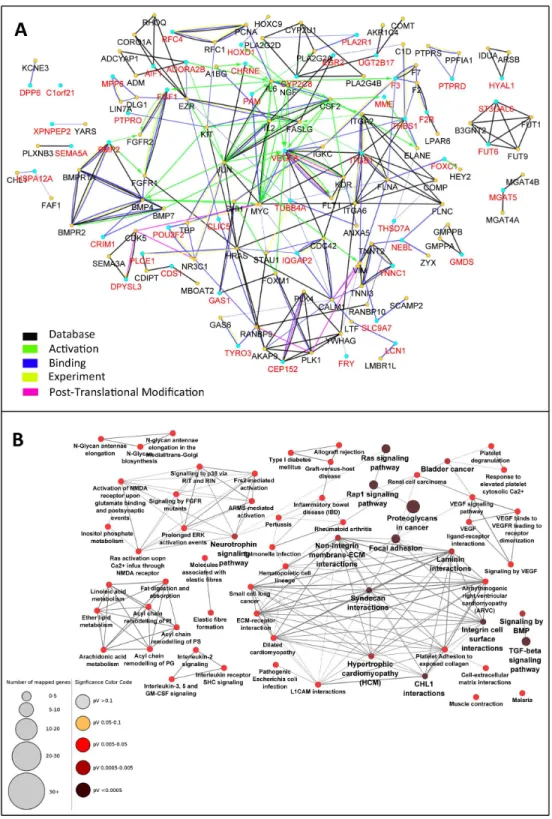
hence not detected in the mRNA microarray experiment. The absence of these genes makes the interaction network incomplete. Therefore, the PPI network was enriched by the addi-tion of maximum 2 interacting nodes for each gene. This resulted in expansion of the net-work from 49 nodes to 137 nodes. Indeed, the added 88 genes were predicted to be inter-acting with the 49 initial genes based on previous knowledge. The PPI network of these 137 genes was constructed with the same parameters applied for the initial network (Fig. 3A).
Figure 2 Network construction and pathway enrichment analysis of differentially expressed genes were not informative.The PPI network of the 49 differentially expressed genes has few edges as these genes do not directly interact (A). Pathway enrichment analysis of these genes could not detect critical pathways in DN. Pathways with adjustedp-value<0.05 are shown (B).
enrichment analysis with the total 137 genes determined 51 pathways (Fig. S1) with fewer connections to each other (86 edges, edge/node: 1.7).
DISCUSSION
Table 1 Central genes in the PPI network.The top 15% genes with the highest degrees, betweenness centrality, and closeness centrality scores in the enriched PPI network are shown.
Genes Degree Genes Betweenness
centrality
Genes Closeness centrality
VEGFA 23 IL6 0.253 CHL1 0.667
JUN 20 JUN 0.205 FAF1 0.667
ITGB1 17 HRAS 0.153 MGAT4B 0.667
IL6 17 EZR 0.122 MGAT4A 0.667
MYC 17 MYC 0.12 JUN 0.408
IL2 13 VEGFA 0.111 MYC 0.388
BMP4 13 VIM 0.109 IL6 0.384
CSF2 12 CALM1 0.107 VEGFA 0.38
ITGA6 12 BMP4 0.074 HRAS 0.366
HRAS 11 ITGA6 0.069 ITGA6 0.36
KDR 11 CYP2C8 0.063 ITGB1 0.359
BMPR2 11 PLA2G2D 0.061 IL2 0.357
EZR 11 PLA2G2A 0.061 VIM 0.354
CALM1 11 FLNA 0.058 CSF2 0.349
FLNA 10 PLCE1 0.054 ITGA2 0.341
ITGA2 10 TUBB4A 0.051 NGF 0.337
BMPR1A 10 THBS1 0.051 TUBB4A 0.332
FGF1 9 ITGB1 0.049 EZR 0.329
BMP2 9 IL2 0.049 FLNA 0.329
FASLG 9 CSF2 0.048 FASLG 0.329
TNNT2 9 ADORA2B 0.048 CALM1 0.326
In this study, we found 49 genes to be differentially expressed between DN and normal samples. In contrast, in the original study;Baelde et al. (2004)identified 615 DE genes. This discrepancy can be due to the inappropriate bulk data analysis methods that were employed in that study. For instance, they used rawp-value reported by Student’sT-test. However, it is now publicly believed that this method of statistical significance detection is associated with high false positive results. To address this problem, false discovery rate methods such as Bonferroni, Benjamini–Hochberg have been proposed forp-value adjustment (Sandrine Dudoit & Callow, 2002). Therefore, we have considered genes with adj.p-value<0.05 as differentially expressed.
connections and are vital for the surveillance of the network. Betweenness centrality measures the number of shortest paths going through a node and so nodes with high betweenness centrality such as JUN and IL6 in this network are shortcuts of the network. In addition, nodes with highest closeness centrality such as CHL1 and FAF1 in our network are physically nearest genes to all nodes. Using these parameters, 34 genes were assumed to have high centrality.
Starting with a set of genes, pathway enrichment analysis allows determination of the top affected functions in a specific disease. An interesting finding in this study was that pathway enrichment with the set of 34 central genes was more informative than enrichment with the initial 49 genes or even with the total 137 genes in the enriched PPI network. It is widely believed that the functional significance of a protein is related to its position in the PPI network as deletion of hub proteins are more lethal compared to non-hubs, a phenomenon known as centrality-lethality rule (Hahn & Kern, 2005;He & Zhang, 2006;Jeong et al., 2001;Yu et al., 2004). Our study demonstrates that central nodes in PPI network tend to be present in pathways that co-occur in a given biological state and probably make pathway cross-links. This observation provides an explanation for the functional essentiality of the central nodes.
Pathway enrichment analysis with the central nodes had an acceptable validity as most of the enriched pathways including TGFB, VEGF, MAPK, and BMP signaling pathways were previously shown to be associated to DN in experimental studies (Toyoda et al., 2004;Turk et al., 2009;Ziyadeh, 2008). With this analysis, we could also determine novel pathways which their role in DN remains to be confirmed in future studies. For instance, neurotrophin signaling pathway, which has been previously shown to be related to diabetic neuropathy (Pittenger & Vinik, 2003), was among the enriched pathways. Similarly, we detected platelet degranulation pathway as a potential role player in DN. Previous studies have demonstrated the role of this pathway in some profibrotic disorders such as idiopathic pulmonary fibrosis (Crooks et al., 2014;Wynn, 2007).
In conclusion, we have here introduced a systems biology approach to DN as a complex biological state. Methods employed in this study may also be used for other chronic diseases to suggest novel therapies via generation of a holistic multi-level insight.
ADDITIONAL INFORMATION AND DECLARATIONS
Funding
This study was supported by Iranian council of stem cell research and technology and Isfahan University of Medical Sciences (392598). The funders had no role in study design, data collection and analysis, decision to publish, or preparation of the manuscript.
Grant Disclosures
Competing Interests
The authors declare there are no competing interests.
Author Contributions
• Maryam Abedi performed the experiments, analyzed the data, wrote the paper, prepared
figures and/or tables.
• Yousof Gheisari conceived and designed the experiments, contributed
reagents/materials/analysis tools, reviewed drafts of the paper.
Supplemental Information
Supplemental information for this article can be found online athttp://dx.doi.org/ 10.7717/peerj.1284#supplemental-information.
REFERENCES
Azeloglu EU, Hardy SV, Eungdamrong NJ, Chen Y, Jayaraman G, Chuang PY, Fang W, Xiong H, Neves SR, Jain MR, Li H, Ma’ayan A, Gordon RE, He JC, Iyengar R. 2014.
Interconnected network motifs control podocyte morphology and kidney function.Science Signaling7:ra12DOI 10.1126/scisignal.2004621.
Baelde HJ, Eikmans B, Doran PP, Lappin DW, De Heer E, Bruijn JA. 2004.Gene expression profiling in glomeruli from human kidneys with diabetic nephropathy.American Journal of Kidney Diseases43:636–650DOI 10.1053/j.ajkd.2003.12.028.
Barrett T, Troup DB, Wilhite SE, Ledoux P, Rudnev D, Evangelista C, Kim IF, Soboleva A, Tomashevsky M, Marshall KA, Phillippy KH, Sherman PM, Muertter RN, Edgar R. 2009.
NCBI GEO: archive for high-throughput functional genomic data.Nucleic Acids Research 37:D885–D890DOI 10.1093/nar/gkn764.
Bindea G, Galon J, Mlecnik B. 2013.CluePedia Cytoscape plugin: pathway insights using integrated experimental and in silico data.Bioinformatics29:661–663
DOI 10.1093/bioinformatics/btt019.
Bindea G, Mlecnik B, Hackl H, Charoentong P, Tosolini M, Kirilovsky A, Fridman WH, Pages F, Trajanoski Z, Galon J. 2009.ClueGO: a Cytoscape plug-in to decipher functionally grouped gene ontology and pathway annotation networks.Bioinformatics25:1091–1093
DOI 10.1093/bioinformatics/btp101.
Cedersund G, Roll J, Ulfhielm E, Danielsson A, Tidefelt H, Stralfors P. 2008.Model-based hypothesis testing of key mechanisms in initial phase of insulin signaling.PLoS Computational Biology4:e1000096DOI 10.1371/journal.pcbi.1000096.
Crooks MG, Fahim A, Naseem KM, Morice AH, Hart SP. 2014.Increased platelet reactivity in idiopathic pulmonary fibrosis is mediated by a plasma factor.PLoS ONE9:e111347
DOI 10.1371/journal.pone.0111347.
Dumas ME, Kinross J, Nicholson JK. 2014. Metabolic phenotyping and systems biology approaches to understanding metabolic syndrome and fatty liver disease.Gastroenterology 146:46–62DOI 10.1053/j.gastro.2013.11.001.
Ghasemi O, Ma Y, Lindsey ML, Jin YF. 2014. Using systems biology approaches to understand cardiac inflammation and extracellular matrix remodeling in the setting of myocardial infarction.Wiley Interdisciplinary Reviews: Systems Biology and Medicine6:77–91
Hahn MW, Kern AD. 2005.Comparative genomics of centrality and essentiality in three eukaryotic protein-interaction networks.Molecular Biology and Evolution22:803–806
DOI 10.1093/molbev/msi072.
He X, Zhang J. 2006.Why do hubs tend to be essential in protein networks?PLoS Genetics2:e88
DOI 10.1371/journal.pgen.0020088.
Jeong H, Mason SP, Barabasi AL, Oltvai ZN. 2001.Lethality and centrality in protein networks.
Nature411:41–42DOI 10.1038/35075138.
Jin Y, Ratnam K, Chuang PY, Fan Y, Zhong Y, Dai Y, Mazloom AR, Chen EY, D’Agati V, Xiong H, Ross MJ, Chen N, Ma’ayan A, He JC. 2012.A systems approach identifies HIPK2 as a key regulator of kidney fibrosis.Nature Medicine18:580–588DOI 10.1038/nm.2685.
Morrison MA, Silveira AC, Huynh N, Jun G, Smith SE, Zacharaki F, Sato H, Loomis S, Andreoli MT, Adams SM, Radeke MJ, Jelcick AS, Yuan Y, Tsiloulis AN, Chatzoulis DZ, Silvestri G, Kotoula MG, Tsironi EE, Hollis BW, Chen R, Haider NB, Miller JW, Farrer LA, Hageman GS, Kim IK, Schaumberg DA, DeAngelis MM. 2011.Systems biology-based analysis implicates a novel role for vitamin D metabolism in the pathogenesis of age-related macular degeneration.Human Genomics5:538–568DOI 10.1186/1479-7364-5-6-538.
Pittenger G, Vinik A. 2003.Nerve growth factor and diabetic neuropathy.Experimental Diabesity
Research4:271–285DOI 10.1155/EDR.2003.271.
Sandrine Dudoit Y, Callow MJ. 2002.Statistical methods for identifying differentially expressed genes in replicated cdna microarray experiments.Statistica Sinica12:111–139.
Schwager C.SUMO—Statistical Utility for Microarray and Omics data.Available athttp://www. oncoexpress.de/software/sumo/.
Sengupta U, Ukil S, Dimitrova N, Agrawal S. 2009.Expression-based network biology identifies alteration in key regulatory pathways of type 2 diabetes and associated risk/complications.PLoS ONE4:e8100DOI 10.1371/journal.pone.0008100.
Shannon P, Markiel A, Ozier O, Baliga NS, Wang JT, Ramage D, Amin N, Schwikowski B, Ideker T. 2003.Cytoscape: a software environment for integrated models of biomolecular interaction networks.Genome Research13:2498–2504DOI 10.1101/gr.1239303.
Starkey JM, Zhao Y, Sadygov RG, Haidacher SJ, Lejeune WS, Dey N, Luxon BA, Kane MA, Napoli JL, Denner L, Tilton RG. 2010.Altered retinoic acid metabolism in diabetic mouse kidney identified by O isotopic labeling and 2D mass spectrometry.PLoS ONE5:e11095
DOI 10.1371/journal.pone.0011095.
Swameye I, Muller TG, Timmer J, Sandra O, Klingmuller U. 2003. Identification of
nucleocytoplasmic cycling as a remote sensor in cellular signaling by databased modeling.
Proceedings of the National Academy of Sciences of the United States of America100:1028–1033
DOI 10.1073/pnas.0237333100.
Toyoda M, Suzuki D, Honma M, Uehara G, Sakai T, Umezono T, Sakai H. 2004.High expression of PKC-MAPK pathway mRNAs correlates with glomerular lesions in human diabetic nephropathy.Kidney International66:1107–1114DOI 10.1111/j.1523-1755.2004.00798.x.
Trivedi H. 2010.Cost implications of caring for chronic kidney disease: are interventions cost-effective?Advances in Chronic Kidney Disease17:265–270DOI 10.1053/j.ackd.2010.03.007.
Turk T, Leeuwis JW, Gray J, Torti SV, Lyons KM, Nguyen TQ, Goldschmeding R. 2009.
BMP signaling and podocyte markers are decreased in human diabetic nephropathy in association with CTGF overexpression.Journal of Histochemistry & Cytochemistry57:623–631
Wynn TA. 2007.Common and unique mechanisms regulate fibrosis in various fibroproliferative diseases.Journal of Clinical Investigation117:524–529DOI 10.1172/JCI31487.
Yu H, Greenbaum D, Xin Lu H, Zhu X, Gerstein M. 2004.Genomic analysis of essentiality within protein networks.Trends in Genetics20:227–231DOI 10.1016/j.tig.2004.04.008.
Ziyadeh FN. 2008.Different roles for TGF-beta and VEGF in the pathogenesis of the cardinal features of diabetic nephropathy.Diabetes Research and Clinical Practice82(Suppl 1):S38–S41