Integrative Analysis of the Developing
Postnatal Mouse Heart Transcriptome
Jingyi Gan1, Hans-Joachim Sonntag2, Mei kuen Tang1, Dongqing Cai3, Kenneth Ka Ho Lee1,3*
1Stem Cell and Regeneration Thematic Research Programme, School of Biomedical Sciences, Chinese University of Hong Kong, Shatin, N.T., Hong Kong, Hong Kong,2Medical Research Council Human Genetics Unit, Medical Research Council Institute of Genetics and Molecular Medicine, University of Edinburgh, Edinburgh, EH4 2XU, United Kingdom,3Key Laboratory for Regenerative Medicine, Ministry of Education, Ji Nan University, Guangzhou, 510632, China
Abstract
In mammals, cardiomyocytes rapidly proliferate in the fetus and continue to do so for a few more days after birth. These cardiomyocytes then enter into growth arrest but the detailed molecular mechanisms involved have not been fully elucidated. We have addressed this issue by comparing the transcriptomes of 2-day-old (containing dividing cardiomyocytes) with 13-day-old (containing growth arrested cardiomyocytes) postnatal mouse hearts. We performed comparative microarray analysis on the heart tissues and then conducted Func-tional annotation, Gene ontology, KEGG pathway and Gene Set enrichment analyses on the differentially expressed genes. The bioinformatics analysis revealed that gene ontology categories associated with the“cell cycle”,“DNA replication”,“chromosome segregation” and“microtubule cytoskeleton”were down-regulated. Inversely,“immune response”,“ extra-cellular matrix”,“cell differentiation”and“cell membrane”were up-regulated. Ingenuity Path-ways Analysis (IPA) has revealed that GATA4, MYH7 and IGF1R were the key drivers of the gene interaction networks. In addition, Regulator Effects network analysis suggested that TASP1, TOB1, C1orf61, AIF1, ROCK1, TFF2 and miR503-5p may be acting on the car-diomyocytes in 13-day-old mouse hearts to inhibit cardiomyocyte proliferation and G1/S phase transition. RT-qPCR was used to validate genes which were differentially expressed and genes that play a prominent role in the pathways and interaction networks that we iden-tified. In sum, our integrative analysis has provided more insights into the transcriptional regulation of cardiomyocyte exit from the cell cycle during postnatal heart development. The results also pinpoint potential regulators that could be used to induce growth arrested cardiomyocytes to proliferate in the infarcted heart.
Introduction
Heart disease is currently one of the leading causes of human morbidity and mortality in devel-oped countries [1]. Coronary heart disease is the most common condition, characterized by OPEN ACCESS
Citation:Gan J, Sonntag H-J, Tang Mk, Cai D, Lee KKH (2015) Integrative Analysis of the Developing Postnatal Mouse Heart Transcriptome. PLoS ONE 10 (7): e0133288. doi:10.1371/journal.pone.0133288
Editor:Katherine Yutzey, Cincinnati Children's Medical Center, UNITED STATES
Received:February 3, 2015
Accepted:June 25, 2015
Published:July 22, 2015
Copyright:© 2015 Gan et al. This is an open access article distributed under the terms of theCreative Commons Attribution License, which permits unrestricted use, distribution, and reproduction in any medium, provided the original author and source are credited.
Data Availability Statement:Data are all contained within the paper and/or Supporting Information files.
Funding:This study was supported by General Research Fund (CUHK469313). The funder had no role in study design, data collection and analysis, decision to publish, or preparation of the manuscript.
atherosclerotic stenosis of the coronary arteries and reduced blood supply to the cardiac mus-cles. Acute thrombus in one of these coronary arteries could induce myocardial infarction, which is a serious life threatening condition. Myocardial infarction often results in the death of approximately 1 billion cardiomyocytes on the left ventricle within a matter of hours. The dam-age to cardiac function can be progressive and often leads to congestive heart failure. The inability of adult cardiomyocytes to undergo self-renewal, differentiation and repair is the main reason why myocardial infarction is still untreatable in regenerative medicine.
It has been proposed that cardiomyocytes may be capable of a limited degree of self-renewal in order to repair the daily micro-damages that occur in the adult heart [2–5].This implies that it may be possible to reinitiate cardiomocyte proliferation in the adult heart if we understand the molecular mechanism involved in its growth arrest. In this context, the activation of the intrinsic repair mechanisms of cardiomyocytes has been proposed as a potential means of repairing the heart [6]. Studying the proliferation and growth arrest of cardiomyocytes in the heart during the postnatal period may allow us to understand more about this intrinsic repair mechanisms [7]. We have previously reported that mouse cardiomyocytes proliferate robustly in the 2 day-old neonate heart and that this process was not discernable at day 13 [8,9]. This finding pinpoints the critical period that will allow us to elucidate the mechanisms and path-ways involved in maintaining cardiomyocyte proliferation and their entry into growth arrest. Elucidating the molecular changes involved in inducing cardiomyocyte growth arrest will allow the identification of signaling factors that can trigger cardiomyocyte to reenter into cell prolif-eration and replace damaged cardiomyocytes in myocardial infarction.
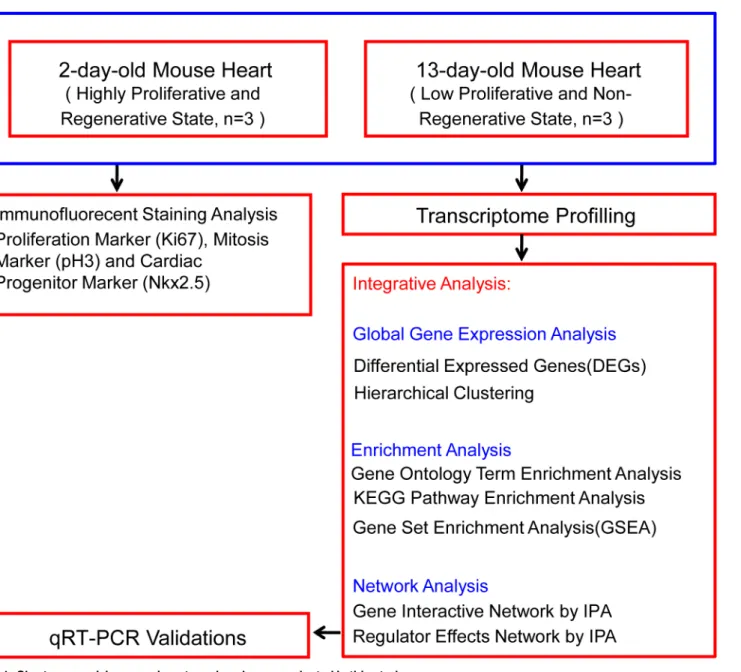
The present study aim at determining the differences in global gene expression between pro-liferating cardiomyocytes in the 2-day-old mouse heart and growth arrested cardiomyocytes in 13-day-old heart. Furthermore, functional annotation, gene ontology enrichment, pathway enrichment and interaction network analyses were conducted on the differentially expressed genes (DEGs) identified to gain a comprehensive insight into the signaling pathways involved in regulating postnatal heart development (as shown inFig 1).
Materials and Methods
Animals and tissue preparation
Two- and 13-day-old mouse neonates were obtained from the Laboratory Animal Services Centre, Chinese University of Hong Kong. The neonates were maintained in individually ven-tilated cages under controlled room temperature (25°C), at constant humidity of 55% and a 12 h dark/light cycle. The neonates were sacrificed by injections of 200 mg/kg ketamine and 10 mg/kg xylazine, followed by cervical dislocation. The hearts from these 2- and 13-day-old neo-nates were harvested for total RNA isolation immediately after dissection and several washes in DEPC-PBS. All experiments involving the use of animals were approved by the Department of Health (Ref No.:13–2 in DH/HA&P/8/2/1 Pt.28) and Chinese University of Hong Kong Ani-mal Care and User Committee.
Immunofiuorescent Staining and Microscopy
(1:200): Mouse anti-Cardiac Troponin T antibody (cTnT, Abcam), Rabbit Ki-67 antibody (Abcam), Rabbit pH3 antibody (Santa Cruz) and Rabbit Nkx2.5 antibody (Abcam). The tissues were washed three times with PBST (PBS buffer with 0.05% Tween 20) for 15 min to remove all unbound primary antibodies. Then the appropriate secondary antibody (1:300 dilution) conjugated to Alexa Fluor-488, -555 or -647 (Life Technologies) was added to the tissues for 1 hr at room temperature, in the dark with gentle shaking. The unbound secondary antibody was removed by washing with PBST, three times for 10 min and PBS for 5 min. The cell nuclei were counter-stained with 4, 6-diamidino-2-phenylindole (DAPI, Molecular Probes) in 70% (v/v) glycerol and mounted with glass cover slips. The immunofiuorescent staining were cap-tured under a confocal microscope (FV1000; Olympus, Japan) with fixed exposure settings for all of the samples [11].
Fig 1. Chart summarizing experiments and analyses conducted in this study.
Comparative microarray analysis
Total RNA was isolated from 2- and 13-day-old hearts using an RNeasy Fibrous Tissue Mini Kit (Qiagen, USA), according to the manufacturer’s instructions. The RNA concentration and quality were assessed using a Nanodrop ND-1000 Spectrophotometer with absorbance set at 260 nm and ratio of 260/280 (Nanodrop Technologies, Wilmington, DE). The RNA integrity was further checked on a 1% agarose gel. 10μg of the total RNA was reverse transcribed into cDNA using a SuperScript Double-Stranded cDNA Synthesis Kit (Invitrogen, USA). The resulting cDNA samples were labelled with Cy3 random nanomers using the NimbleGen One-Color DNA labelling kit (Roche NimbleGen, Madison, WI, USA) according to manufacturer’s instruction. The transcriptome profiles of the 2- and 13-day-old hearts were analyzed by direct comparison of the transcriptional level between these two groups on the same 12×135K micro-array (Roche NimbleGen). Hybridization was performed on the micromicro-array at 42°C for 16 h and the microarray cassette was washed using a NimbleGen wash buffer kit. Then, the microar-ray was scanned using a NimbleGen MS 200 Microarmicroar-ray Scanner, which produced 532 nm TIFF images. The scanned images were imported into the DEVA software (Roche) to quantify the signal intensities of corresponding probes in the microarray [11,12]. The microarray data has been deposited in Gene Expression Omnibus (http://www.ncbi.nlm.nih.gov/geo/) number GSE67575.
Bioinformatics analysis of differentially expressed genes
The raw data generated from the NimbleGen microarrays were transformed using the robust multi-array average method. This widely used algorithm results in a background-adjusted and log-transformed expression value that has been normalized across samples using quantile nor-malization and summarized from probe to transcript level using the median polish algorithm [13]. Genes that are differentially expressed in 2- and 13-day-old mouse hearts were identified via one-way ANOVA using the Partek Genomics Suite (Partek, Inc., St. Louis, MO). To adjust for multiple comparisons, we used the Benjamini-Hochberg step-up procedure to calculate the false discovery rate (FDR). Our thresholds for identifying positive differential gene expression were taken as FDR<0.05 and fold change1.5. Hierarchical clustering analysis was per-formed on the DEGs using Partek default settings.
Gene Ontology & KEGG pathway enrichment analysis
A list of differentially expressed genes in 2- versus 13-day-old hearts was imported into the Database for Annotation, Visualization, and Integrated Discovery (DAVID) Bioinformatics Resource (http://david.abcc.ncifcrf.gov/). The aim was to detect significantly over-represented biological processes affected by changes in the transcriptomes. The David Functional Annota-tion Tool [14] provides extended annotation coverage drawn from over 40 databases, including GO terms, disease associations, pathways, gene functional summaries, gene tissue expression, and literatures. Functional enrichment was assessed using the following four annotation data-bases including biological process (BP), molecular function (MF), cellular component (CC) and KEGG pathway by selecting‘GOTERM_BP_ALL’,‘GOTERM_MF_ALL’,‘GOTERM_CC _ALL’and‘KEGG_PATHWAY’.
Gene Set Enrichment Analysis (GSEA)
calculates an enrichment score to determine whether members of a particular pathway are ran-domly distributed or non-ranran-domly enriched at either ends of the ranked list. We chose the t-test as metric for ranking genes and 1,000 gene set permutations were used to generate a null distribution for the enrichment score, which was used to yield a normalized enrichment score (NES) for each pathway. Gene sets were only considered significantly enriched if p<0.05 and FDR<0.25 [15].
Interaction network analysis by IPA
We examined the molecular interactions that were not captured by previously characterized and well curated pathways. Hence, the differentially expressed genes were further analyzed using the Ingenuity Pathways Analysis (IPA) software (Ingenuity Systems, Redwood City, CA;
http://www.ingenuity.com). This all-in-one web-based software which makes use of the Inge-nuity Pathways Knowledge Base (IPKB) to generate interaction networks of focus genes based on manually curated information reported in the literatures. The underlying algorithm maxi-mizes connectivity, leading to networks that are likely to represent significant biological func-tion. Briefly, we uploaded a file containing gene identifiers (ID), their corresponding fold change and p-values. We also specified mouse as the species and heart as the tissue. Focus genes were selected by a 1.5 fold cutoff change. Enrichment of the focus genes in the networks (which always consist of 35 genes) were assessed via Fisher’s exact test and used to rank the networks. Furthermore, the software identifies top functions and diseases associated with each network via enrichment scores, highlighting the biological significance of the results.
Regulator effects analysis using Ingenuity Knowledge Base
To gain insight into the causes and effects of DEGs in the dataset, we performed regulator effects analysis using the Ingenuity Knowledge Base.The analysis produces causal hypotheses that predicted and explain how activation or inhibition of upstream regulators might cause an increase or decrease in phenotypic and functional outcomes downstream. A top scoring inter-active network was established from the Regulator Effects analysis of DEGs using the Ingenuity Knowledge Base. In the network analysis, only genes, RNAs, proteins, microRNAs and growth factors were selected as upstream regulators. We also required that the regulators and down-stream effects were fed into the algorithm with an absolute z-score of>2 and a p-value<0.05.
Quantitative Real-time Polymerase Chain Reaction (RT-qPCR) assay
Total RNA was extracted from heart tissues using a NucleoSpin Total RNA Isolation Kit (Clon-tech Laboratories, USA) according to the manufacturer’s instructions. After DNase I (Takara, Japan) digestion for 15 min, the RNA concentration was determined using a NanoDrop 2000 Spectrophotometer (Thermo Fisher Scientific, USA). 1μg of total RNA was reverse-transcribed into cDNA with oligo (dT18) primer using a RevertAid First Strand cDNA Synthesis Kit
the reference housekeeping gene. Expression levels of mRNA were presented as fold changes
ð244CtÞand represented as mean ± standard deviation, obtained from three different samples. A t-test was performed to compare the expression in 2- and 13-day-old hearts, with p<0.05 as being significance different. The primer sequences for validating 5 of the top 10 down-regu-lated genes (BMP10, Hand1, Hif3a, Myo3b and IGF2bp1), 5 of the top 10 up-regudown-regu-lated genes (Hmcn2, Mapt, Art1, Itgb6 and Rxrg), 6 genes from the most significantly enriched pathway (c-Myc, CycA, CycD, CycE, CDK1 and GADD45) and 6 genes from the top IPA network (GATA4, MYH7, IGF1R, IGF1, MEF2D and TNNI) are all listed inS1 Table.
Statistical Analysis
All data presented were obtained in triplicates. The results were calculated and analyzed using GraphPad Prism computer software and presented as mean ± standard deviation (SD). Com-parison of differences between data sets was determined by Student’s t-test and analysis of vari-ance (ANOVA).
Results
Cardiomyocyte proliferation and differentiation in postnatal mouse
hearts
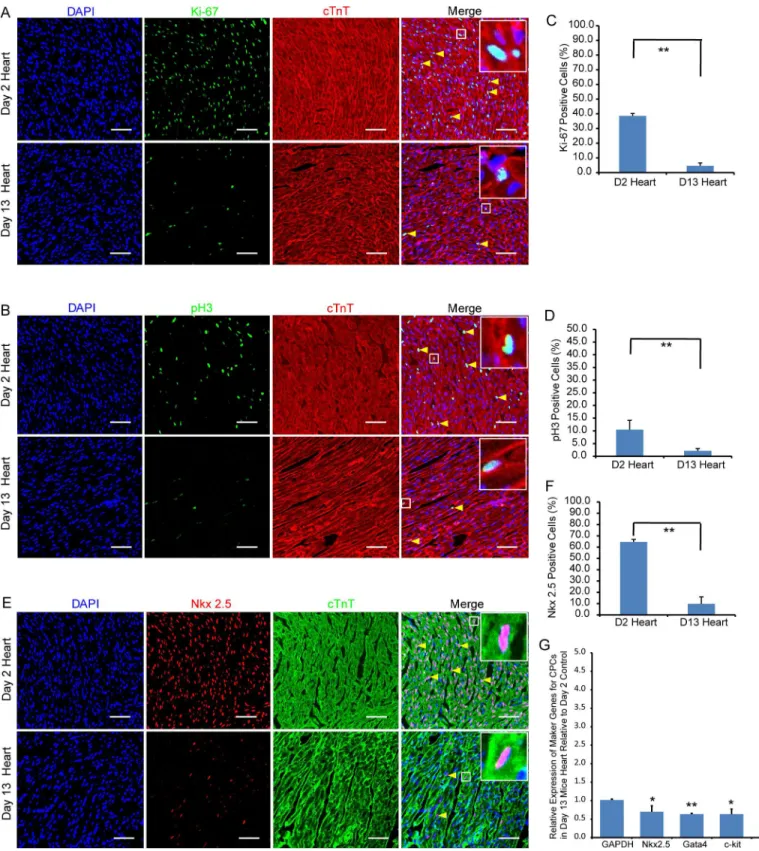
To establish the extent of cardiomyocyte proliferation in 2- and 13-day-old hearts, we stained these sections of organs with antibodies for Ki-67 (a cell proliferation marker) and phosphory-lated Histone H3 (pH3, a mitosis marker). We quantitatively determined that 38.5 ± 1.6% of cardiomyocytes was Ki-67+in 2-day-old hearts, while only 4.6 ± 1.9% were Ki-67+in 13-day-old hearts (Fig 2A and 2C). Similarly, we determined that there was significantly fewer pH3+ cardiomyocytes in 13-day than 2- day-old hearts (2.1 ± 0.9% vs 10.4 ± 3.7%, respectivelyFig 2B and 2D). The results show that there was a significant reduction in cardiomyocyte prolifer-ation and mitosis in the 13-day-old heart. To determine the extent of cardiomyocyte differenti-ation, we immunofluorescently stained the hearts with Nkx2.5 antibodies. Nkx2.5 is a
transcription factor that is normally expressed in cardiac progenitor cells. We determined that 64.5 ± 2.3% of cardiomyocytes was Nkx2.5+in 2-day-old hearts verses 9.8 ± 6.1% in 13 day (Fig 2E and 2F). RT-qPCR analysis also revealed that expression of other cardiac progenitor cell markers, including Gata4, c-kit and islet1, were correspondingly down-regulated at day 13 (Fig 2G). These results imply that cardiomyocytes in the heart starts to undergo growth arrest and differentiation during the postnatal period.
Microarray analysis of 2- and 13-day-old hearts
Fig 2. Extent of cardiomyocyte proliferation and differentiation in 2- and 13-day-old mouse hearts.Immunofluorescent staining showing the presence of proliferating Ki-67+(A) and mitotic pH3+(B) cTnT+cardiomyocytes (yellow arrow heads) at day 2 and day 13. (E) showing the presence of Nkx2.5+cardiac progenitor cells at day 2 and day 13. Bar charts showing the percentage of cardiomyocytes that are Ki-67+(C), pH3+(D) or Nkx2.5+(F) in 2- and 13-day-old
hearts. The data is presented as means±SD; Scale bar: 50μm, Significantly different:**P<0.01. (G) RT-qPCR assay confirms the immunofluorescent staining that Ki-67+and pH3 expressions are down-regulated in 13-day-old heart. Relative expression values are presented as means±SD. Significantly
different:*P<0.05,**P<0.01.
Functional annotation and gene ontology enrichment analysis
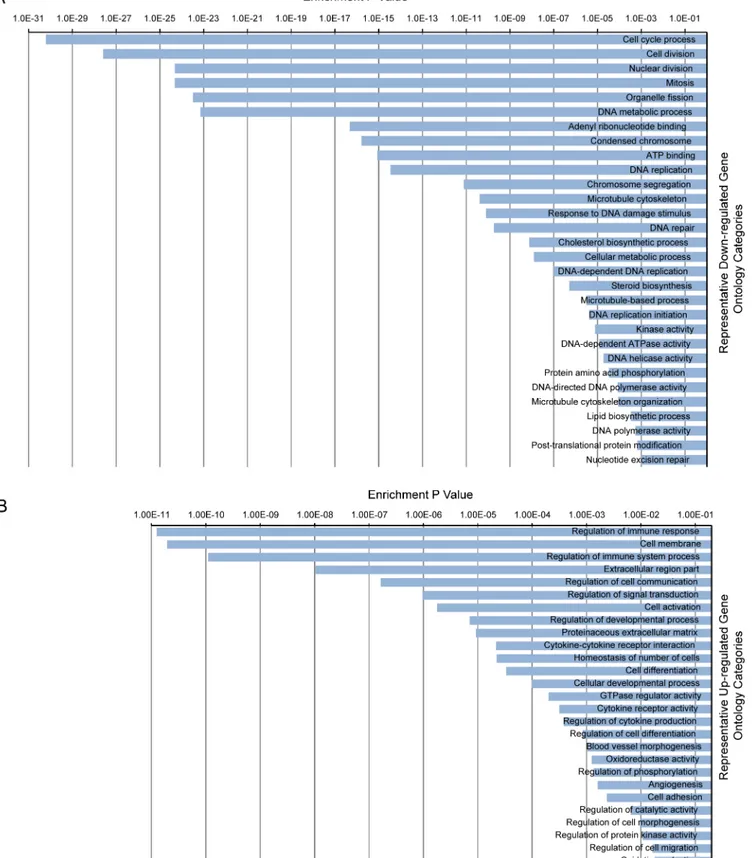
We performed functional batch annotation and ontology enrichment analysis on the DEGs that we identified to understand the global transcriptional changes that occur between 2- and 13-day-old hearts. We identified important representative gene ontology categories based on annotation of 4 databases that included: biological process, molecular function, cellular compo-nent and KEGG pathway. The gene ontology categories identified were related to the cell cycle, chromosome segregation, microtubule cytoskeleton, DNA metabolic process, cell membrane, extracellular matrix, cell differentiation, cytokines production and immune response (Fig 4A and 4B). The total annotation clusters that were determined to be down-regulated or up-regu-lated are shown inS3A and S3B Tables, respectively. These results suggest that cell cycle pro-gression and DNA replication were inhibited in 13-day-old hearts while the immune response and differentiation process were correspondingly enhanced.
KEGG pathway mapping analysis
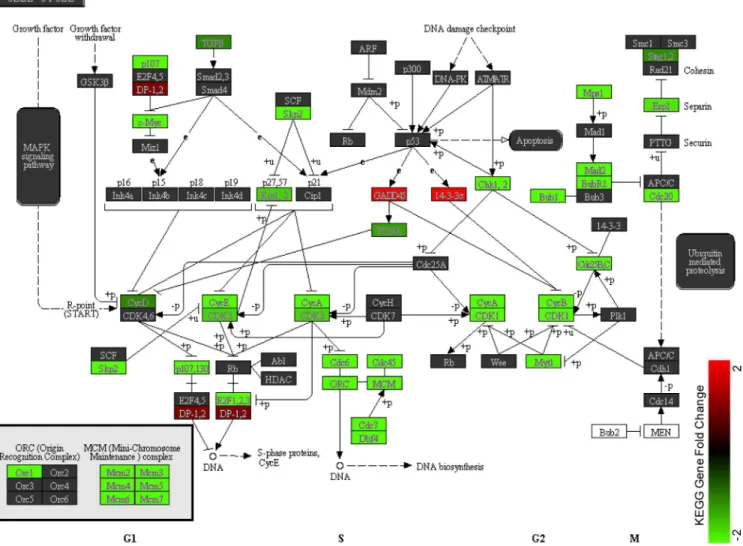
We conducted KEGG enrichment analysis and identified 41 pathways that were significantly enriched among the DEGs (P<0.05,S4 Table). The top 2 enriched KEGG pathways identified were“cell cycle”(p = 9.31×10⁻⁹) and“DNA replication”(p = 3.0×10⁻⁸). Closer examination of the pathway maps confirmed the inhibition of these two biological processes, as most of the genes in the pathways were down-regulated (as highlighted in green inFig 5) in 13- versus 2-day-old hearts. Specifically, the cell cycle arrest may be attributed to five mechanisms as evi-dent in the pathway map. The five sets of genes inhibited from being expressed includes: 1) Cyclin genes (CycA, CycB, CycD and CycE);2) cyclin-dependent kinases (CDK1 and CDK2); 3) cell cycle-related genes (CDC6, CDC7, CDC20, CDC45, MCM2-7 and c-Myc); 4) CDK interacting protein/Kinase inhibitory protein, especially p27kip1and p57kip2(which activate the
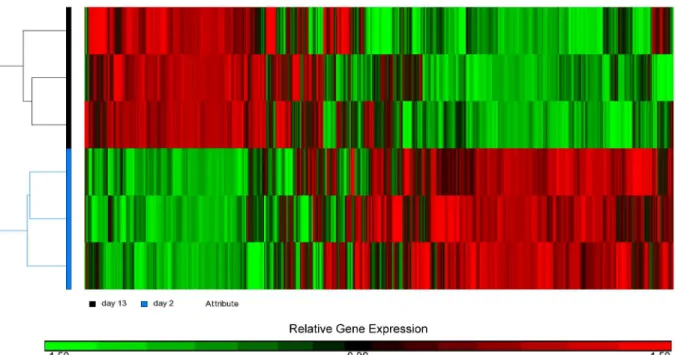
Fig 3. Hierarchical clustering of the microarray results showing the presence of two distinct heart samples.Relative level of gene expression is color-coded: red implies genes up-regulated in 13-day-old heart while green indicate genes that were down-regulated.
Fig 4. Gene Ontology enrichment analysis showing representative ontology categories.(A) Representative down-regulated ontology categories. (B) Representative up-regulated ontology categories. The enrichment p value is displayed on the x-axis.
cyclin-dependent kinase inhibitors and arrest cells in G1 phase) and 5) BUB1 and BUBR1 (mitotic checkpoint serine /threonine-protein kinases).
We have determined that genes involved in various metabolic pathways were also signifi-cantly enriched (S4 Table).These pathways involved: steroid and fatty acid biosynthesis, gluta-thione metabolism, synthesis and degradation of ketone bodies, terpenoid backbone and primary bile acid biosynthesis. In addition, we have identified pathways relating to the immune system (such as antigen processing and presentation, allograft rejection, and graft-versus-host disease) were all well represented. Cardiac disease related pathways were also flagged up and these included hypertrophic cardiomyopathy, dilated cardiomyopathy and arrhythmogenic right ventricular cardiomyopathy. These findings point to a complex interacting network of growth- and metabolism-related changes that occur during the crucial period (postnatal day 2 to 13) of heart development. Significantly, components in these networks may represent poten-tial targets for inducing adult cardiomyocytes to re-enter the cell cycle when cardiac repair is required.
Fig 5. KEGG pathway map of the cell cycle.Cell cycle associated genes are significantly enriched in the list of differentially expressed genes (p = 8.6 x 10⁻⁹). Fold change is only shown for genes within the list and illustrates near universal down-regulation in the pathway for cardiomyocytes in the 13-day-old
heart, as compared with the 2-day-old heart. Arrows indicate positive regulation, while other lines indicate negative regulation.
Gene set enrichment analysis confirms inhibition of the cell cycle and
DNA replication
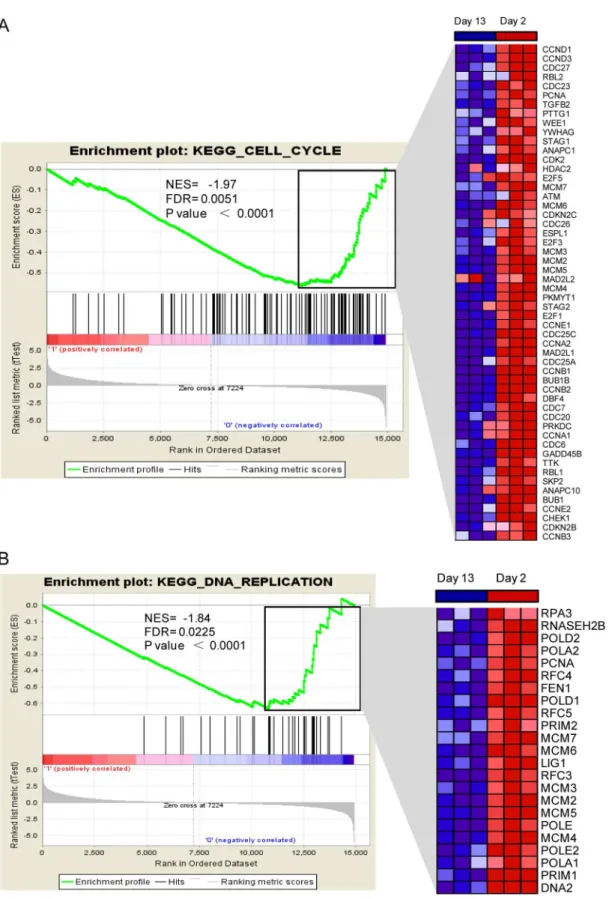
Using GSEA, we took a closer examination of the distribution of KEGG pathway gene sets, in a ranked list of up- and down-regulated genes. Altogether, there were 73 down-regulated gene sets that were scored as enriched and approximately 14 of these were statistically significant (S5 Table). In agreement with the results from our simple enrichment analysis, the data sets with the highest statistical significance were the cell cycle and DNA replication sets, which are both refiecting the growth arrested phenotype of adult cardiomyocytes. For these two data sets, the false discovery rate q-values were 0.0051 and 0.0225, respectively and similar trends in gene activation were observed between 2- and 13-day-old hearts (Fig 6).
Top gene interaction network elucidated from Ingenuity Pathways
Analysis
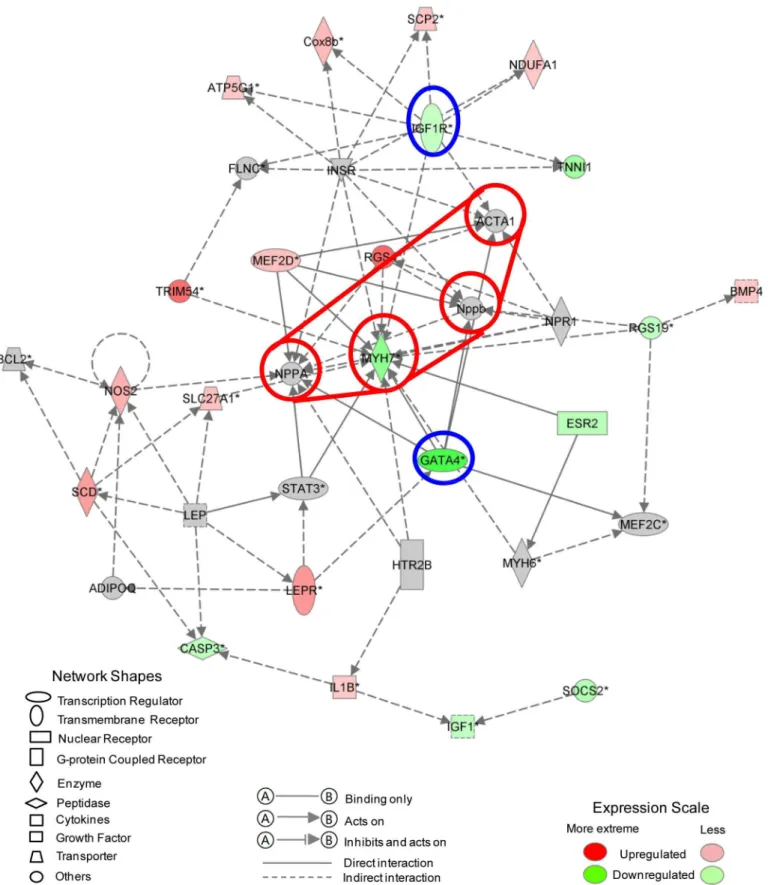
We algorithmically generated a gene interaction network based on the connectivity of focused genes (together with other related genes or molecules strongly inferred as interacting partners by IPA). In the diagram, genes and molecules are depicted as nodes while interactions (sup-ported by at least one reference from the literature or textbook stored in IPKB) are illustrated by the edges connecting them. The nodes are displayed as various shapes that represent their functional classification while the different lines describe the types of relationship. Notably IPA uses a solid line to indicate direct interactions while a dashed line denotes an indirect interac-tion between two nodes.Fig 7shows the IPA network with the highest enrichment of focused genes. The top five associated functions identified were related to cardiac hypertrophy, cell cycle, cardiovascular disease, cardiovascular system development and cardiac fibrosis, as illus-trated inS6 Table.
Since IPA networks indicate directionality, we could focus on the nodes with the highest indegree (number of incoming edges) and outdegree (number of outgoing edges). These are highlighted in red and blue, respectively (Fig 7). The first group consists of MYH7, NPPA, NPPB and ACTA1 implying that the regulation of these genes, together with downstream effects, plays an important role in shifting the cardiomyocytes towards a lower rate of cell pro-liferation. More importantly, GATA4 and IGF1R have the highest outdegree, with GATA4 directly regulating all of the four central nodes mentioned above. Both of these crucial genes have previously been reported to play an important role in cardiomyocyte proliferation and regeneration [16–24]. Based on our analysis, we envisage that activation of pathways such as the IGF1 signaling pathway or up-regulation of the key regulator GATA4 may induce cell cycle re-entry and facilitate cardiac repair.
Regulators effect network generated from Ingenuity Pathways Analysis
Validation of gene expression by RT-qPCR Assay
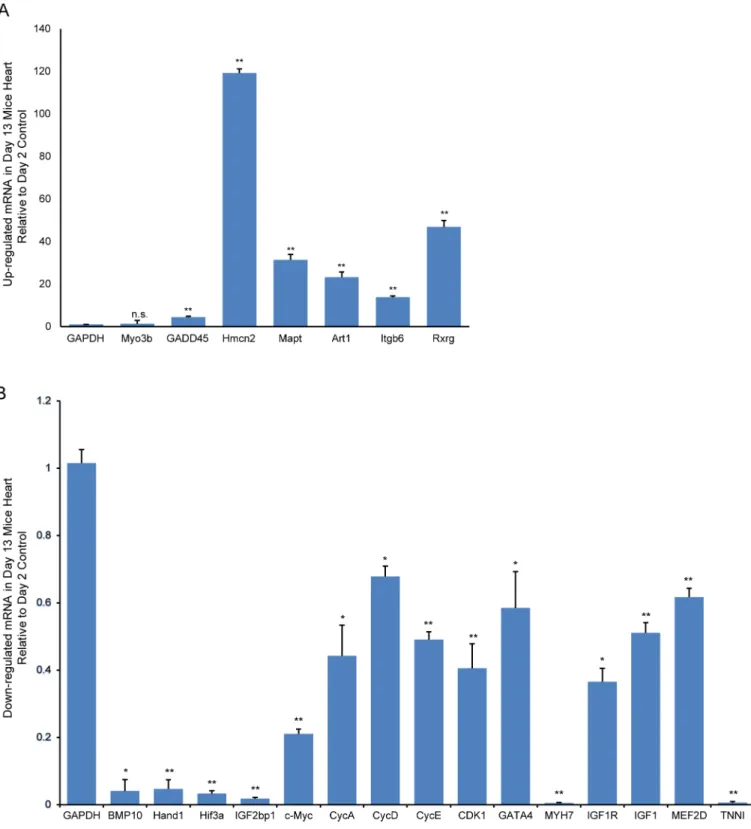
We selected representative differentially expressed genes from our microarray analysis for vali-dation by RT-qPCR. The genes included: (1) CycA, CycD, CycE, CDK1, c-Myc and GADD45 which are key components of the cell cycle pathway; (2) GATA4, MYH7, IGF1R, IGF1, MEF2D and TNNI in the top IPA network (on account of their degree of relevance in the net-work or reported functions in cardiomyocyte proliferation and regeneration); (3) BMP10, Hand1, Hif3a, Myo3b and IGF2bp1 which are among the top 20 down-regulated genes (based on their established roles in cardiogenesis) and (4) Hmcn2, Mapt, Art1, Itgb6 and Rxrg in the top 20 up-regulated gene list (selected because these are novel genes in postnatal heart develop-ment). For cell cycle pathway-associated genes, RT-qPCR assays revealed that CycA, CycD, CycE, CDK1 and c-Myc expressions were significantly down-regulated in 13-day-old hearts compared with expression in 2-day-old hearts. As expected from the microarray data,
GADD45 was significantly up-regulated(Fig 9). For selected genes from the top IPA network, the RT-qPCR showed GATA4, MYH7, IGF1R, IGF1, and TNNI expressions were significant down-regulated in 13- versus 2-day-old hearts. Furthermore, BMP10, Hand1, Hif3a and IGF2bp1 expressions were also significantly down-regulated, while Hmcn2, Mapt, Art1, Itgb6, and Rxrg expressions were significantly up-regulated in 13- versus 2-day-old hearts(Fig 9).
Discussion
The mammalian heart possesses remarkable regenerative capacity for several days after birth. It then rapidly loses this regenerative ability when the majority of cardiomyocytes“ perma-nently”exit from the cell cycle [25–29]. This exit is accompanied by the cardiomyocytes increasing their cell size via hypertrophy so that the overall mass and size of the heart could increase [30]. Presently, we have demonstrated that the cardiomyocytes undergo dramatic changes, in terms of their ability to proliferate and mature, between day 2 and day 13 of postna-tal heart development. During this critical period, our immunofluorescent staining results revealed that cardiomyocyte proliferation steadily declines while cardiomyocyte maturation increases. To elucidate the molecular events and understand the changes that occur during this key period, we performed microarray to generate the transcriptomes for 2- and 13-day-old mouse hearts. We performed Functional annotation, Gene ontology, KEGG pathway and Gene Set enrichment analyses on the two sets of microarray data generated. The analyses revealed that“cell cycle”and“DNA replication”were featured the most prominently annotations amongst the down-regulated genes. This finding collaborates with our immunohistological observations that majority of the cardiomyocytes exit the cell cycle in the 13-day-old heart. These results are highly consistent with findings that we and other have previously reported [5,
31,32].
Another interesting finding is the prominence of the immune-related GO categories for enrichment of the up-regulated genes. This may be explained by the fact that a newborn mouse has to transit from a sterile intrauterine to an external environment, which is a major patholog-ical event. This event may trigger a stronger role for the immune system so that cardiomyocytes can face the challenges presented by the external environment [33]. Alternatively, the immune system may crosstalk with pathways that regulate cell proliferation to control cardiomyocyte growth and differentiation. We have identified several important gene targets that can be seen distribution within the set of all genes. The normalized enrichment score (NES) is inferred from permutations of the gene set and the false discovery rate (FDR). P values are indicated and the plot on the right shows the relative level of gene expression (red = high, blue = low) in the leading edge subset, corresponding to the most significant genes.
Fig 7. Top gene interaction network based on information from the Ingenuity Pathways Knowledge Base.Genes that are up- or down-regulated are labelled in red and green, respectively. Genes that are colored gray are not differentially expressed between Day 2 and Day 13.
as key players in regulating cardiac proliferation and differentiation. In the cell cycle pathway, cyclin A was one of the genes identified as most significantly down-regulated. Normally, cyclin
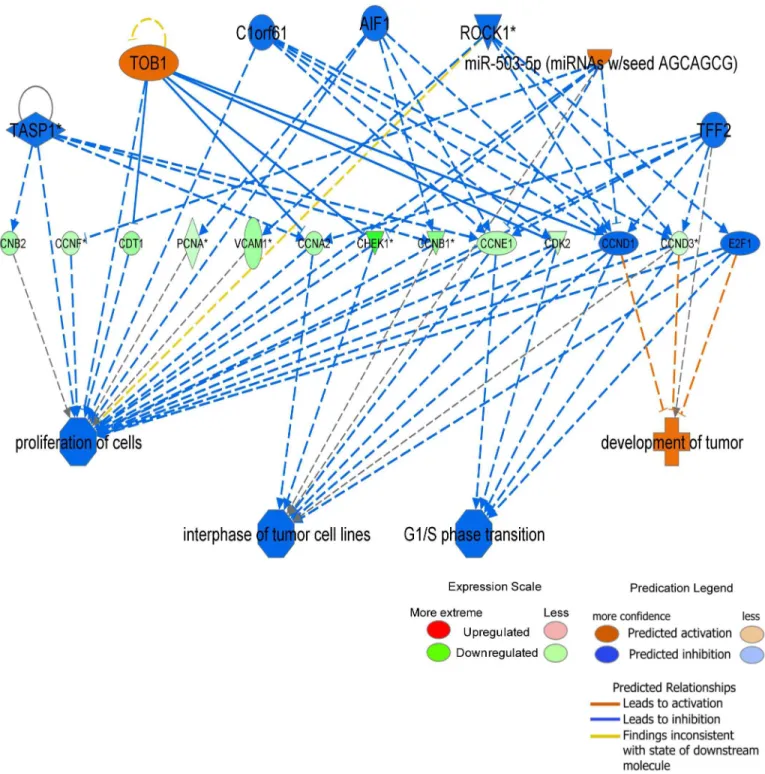
Fig 8. Regulator effects network generated from Ingenuity Pathways Analysis.Upstream regulators are displayed in the top tier, while diseases, functions and phenotypes are displayed in the bottom tier. The dataset genes that connect the upper regulators and the lower diseases and functions are displayed in the middle tier. The causal consistency relationships are represented with orange and blue lines, while the inconsistent relationships are represented as yellow line. Note that some of the dataset genes displayed in the middle tier may have been predicted to be activated or inhibited by upstream regulators, and under such situation is colored orange or blue, respectively (for example CCND1 and E2F1 in the network).
A forms a complex with its cyclin-dependent kinase partners to mediate in both the G1—S and G2—M transitions of the cell cycle. This gene is normally silenced in mammalian
Fig 9. RT-qPCR validation of representative differentially expressed genes.Up- (A) and down-regulated (B) in 13-day-old versus 2-day-old mouse hearts. Relative expression values are presented as means±SD. Significantly different:*P<0.05,**P<0.01, No significance: n.s.
cardiomyocytes shortly after birth. Therefore, re-initiating the expression of this gene may be a crucial step in re-establishing the proliferative ability of cardiomyocytes [34,35].
One important finding from the IPA analysis is the identification of GATA4 and MEF2C in the top network. It has been reported that these genes can elicit cardiomyocyte regenerationin vivofollowing myocardial infarction, induced by ligation of the left anterior descending artery
[36,37]. In related experiments, cardiac fibroblasts at the infarct site have been transfected with retroviruses carrying Gata4, Mef2c and Tbx5. These transfected fibroblasts directly trans-differentiated into functional cardiac-like myocytes, leading to a reduction in the infarct size, improved cardiac function and a reduction of adverse effect from ventricular remodeling for up to 3 months. The newly-formed cardiomyocytes were established around the borders of the infarct site. Furthermore, both studies also revealed that this direct reprogramming of the car-diac fibroblasts was significantly more efficientin vivothan underin vitrotissue culture condi-tions. However, these claims have been recently contradicted [38]. It was reported that Gata4, Mef2c and Tbx5 overexpression in cardiac fibroblasts was inefficient at inducing the molecular signature and electrophysiological activities associated with mature cardiomyocytes.
O'Meara et al [39] have profiled the global gene expression patterns of mouse cardiomyo-cytes during differentiation. They examined the cardiomyocardiomyo-cytes on postnatal day 0, 4, 7 and weeks 8–10 to identify genes and gene networks that change dynamically during the differenti-ation processes. They suggested that cardiac regenerdifferenti-ation involves a transcriptional reversion of the cardiomyocyte differentiation process. Furthermore, Giudice et al. [40]showed that extensive transcriptional changes and alternative splicing occurred in the heart between post-natal day 1 and 28. They demonstrated that alternative splicing played a role in vesicular traf-ficking and intracellular membrane organization. Their findings are consistent with our current data from the gene ontology enrichment analysis. Our reliance on a bioinformatics approach in the current study cannot directly verify the functional relevance of the key genes and regulators that we have identified. For functional follow-up study in the future, we will deliver and over-express adeno-associated virus carrying Gata4, Myh7, TNNI, Hand1, Hif3a and Cyclin A genes into cardiac fibroblasts that occupy the heart infract site. This could be combined with local administration of IGF1 and BMP10 to enhance cardiac regeneration, based on the findings from our results. Theoretically, over-expression of these factors might be able to promote the proliferation of adult cardiomyocytes and also directly reprogram cardiac fibroblasts into new cardiomyocytes.
Supporting Information
S1 Table. Primers of Genes Selected for Validation with RT-qPCR. (XLSX)
S2 Table. Differentially Expressed Gene List for 13- versus 2-day-old Hearts. (XLSX)
S3 Tables. A, B: Down- and up-regulated Gene Ontology Categories. (XLSX)
S4 Table. KEGG Pathways. (XLSX)
S5 Table. Gene Set Enrichment Analysis Report. (XLSX)
Acknowledgments
This study was supported by General Research Fund (CUHK469313).
Author Contributions
Conceived and designed the experiments: KKHL. Performed the experiments: JYG HJS MKT. Analyzed the data: JYG. Contributed reagents/materials/analysis tools: MKT DQC. Wrote the paper: JYG KKHL HJS.
References
1. Go AS, Mozaffarian D, Roger VL, Benjamin EJ, Berry JD, Blaha MJ, et al. Heart Disease and Stroke Statistics—2014 Update: A Report From the American Heart Association. Circulation. 2014; 129(3): e28–e292. doi:10.1161/01.cir.0000441139.02102.80PMID:24352519
2. Parmacek MS, Epstein JA. Cardiomyocyte Renewal. New England Journal of Medicine. 2009; 361 (1):86–8. doi:10.1056/NEJMcibr0903347PMID:19571289.
3. Bergmann O, Bhardwaj RD, Bernard S, Zdunek S, Barnabé-Heider F, Walsh S, et al. Evidence for Car-diomyocyte Renewal in Humans. Science. 2009; 324(5923):98–102. doi:10.1126/science.1164680 PMID:19342590
4. Ptaszek LM, Mansour M, Ruskin JN, Chien KR. Towards regenerative therapy for cardiac disease. The Lancet. 379(9819):933–42. Available: doi:http://dx.doi.org/10.1016/S0140-6736(12)60075-0. 5. Mahmoud AI, Kocabas F, Muralidhar SA, Kimura W, Koura AS, Thet S, et al. Meis1 regulates postnatal
cardiomyocyte cell cycle arrest. Nature. 2013; 497(7448):249–53. Available: doi:10.1038/nature12054 http://www.nature.com/nature/journal/v497/n7448/abs/nature12054.html#supplementary-information. PMID:23594737
6. Laflamme MA, Chen KY, Naumova AV, Muskheli V, Fugate JA, Dupras SK, et al. Cardiomyocytes derived from human embryonic stem cells in pro-survival factors enhance function of infarcted rat hearts. Nat Biotech. 2007; 25(9):1015–24. Available: doi:http://www.nature.com/nbt/journal/v25/n9/ suppinfo/nbt1327_S1.html.
7. McAlister FA, Stewart S, Ferrua S, McMurray JJJV. Multidisciplinary strategies for the management of heart failure patients at high risk for admission: A systematic review of randomized trials. Journal of the American College of Cardiology. 2004; 44(4):810–9. Available: doi:http://dx.doi.org/10.1016/j.jacc. 2004.05.055. PMID:15312864
8. Liu Y, Tang MK, Cai DQ, Li M, Wong WM, Chow PH, et al. Cyclin I and p53 are differentially expressed during the terminal differentiation of the postnatal mouse heart. PROTEOMICS. 2007; 7(1):23–32. doi: 10.1002/pmic.200600456PMID:17154274
9. Tang MK, Kindler PM, Cai DQ, Chow PH, Li M, Lee KKH. Heart-type fatty acid binding proteins are upregulated during terminal differentiation of mouse cardiomyocytes, as revealed by proteomic analy-sis. Cell Tissue Res. 2004; 316(3):339–47. doi:10.1007/s00441-004-0881-yPMID:15064945 10. Feldman MY. Reactions of nucleic acids and nucleoproteins with formaldehyde. Progress in nucleic
acid research and molecular biology. 1973; 13:1–49. Epub 1973/01/01. PMID:4573489.
11. Chen E, Tang MK, Yao Y, Yau WWY, Lo LM, Yang X, et al. Silencing BRE Expression in Human Umbil-ical Cord Perivascular (HUCPV) Progenitor Cells Accelerates Osteogenic and Chondrogenic Differenti-ation. PLoS ONE. 2013; 8(7):e67896. doi:10.1371/journal.pone.0067896PMID:23935848
12. Arnaiz O, Gout J-F, Betermier M, Bouhouche K, Cohen J, Duret L, et al. Gene expression in a paleopo-lyploid: a transcriptome resource for the ciliate Paramecium tetraurelia. BMC Genomics. 2010; 11 (1):547. doi:10.1186/1471-2164-11-547
13. Irizarry RA, Hobbs B, Collin F, Beazer‐Barclay YD, Antonellis KJ, Scherf U, et al. Exploration, normali-zation, and summaries of high density oligonucleotide array probe level data. Biostatistics. 2003; 4 (2):249–64. doi:10.1093/biostatistics/4.2.249PMID:12925520
14. Huang DW, Sherman BT, Lempicki RA. Systematic and integrative analysis of large gene lists using DAVID bioinformatics resources. Nat Protocols. 2008; 4(1):44–57. Available: doi:http://www.nature. com/nprot/journal/v4/n1/suppinfo/nprot.2008.211_S1.html.
16. Kawaguchi N, Smith AJ, Waring CD, Hasan MK, Miyamoto S, Matsuoka R, et al. c-kitpos GATA-4 High Rat Cardiac Stem Cells Foster Adult Cardiomyocyte Survival through IGF-1 Paracrine Signalling. PLoS ONE. 2010; 5(12):e14297. doi:10.1371/journal.pone.0014297PMID:21179204
17. Inagawa K, Miyamoto K, Yamakawa H, Muraoka N, Sadahiro T, Umei T, et al. Induction of Cardiomyo-cyte-Like Cells in Infarct Hearts by Gene Transfer of Gata4, Mef2c, and Tbx5. Circulation Research. 2012; 111(9):1147–56. doi:10.1161/circresaha.112.271148PMID:22931955
18. Kikuchi K, Holdway JE, Werdich AA, Anderson RM, Fang Y, Egnaczyk GF, et al. Primary contribution to zebrafish heart regeneration by gata4+ cardiomyocytes. Nature. 2010; 464(7288):601–5. Available: doi:http://www.nature.com/nature/journal/v464/n7288/suppinfo/nature08804_S1.html. doi:10.1038/ nature08804PMID:20336144
19. Gupta V, Gemberling M, Karra R, Rosenfeld GE, Evans T, Poss KD. An Injury-Responsive Gata4 Pro-gram Shapes the Zebrafish Cardiac Ventricle. Current biology: CB. 2013; 23(13):1221–7. doi:10.1016/ j.cub.2013.05.028PMID:PMC3759223.
20. Zhou L, Liu Y, Lu L, Lu X, Dixon RAF. Cardiac Gene Activation Analysis in Mammalian Non-Myoblasic Cells by Nkx2-5, Tbx5, Gata4 and Myocd. PLoS ONE. 2012; 7(10):e48028. doi:10.1371/journal.pone. 0048028PMID:23144723
21. Huang Y, Harrison MR, Osorio A, Kim J, Baugh A, Duan C, et al. Igf Signaling is Required for Cardio-myocyte Proliferation during Zebrafish Heart Development and Regeneration. PLoS ONE. 2013; 8(6): e67266. doi:10.1371/journal.pone.0067266PMID:23840646
22. D'Amario D, Cabral-Da-Silva MC, Zheng H, Fiorini C, Goichberg P, Steadman E, et al. Insulin-Like Growth Factor-1 Receptor Identifies a Pool of Human Cardiac Stem Cells With Superior Therapeutic Potential for Myocardial Regeneration. Circulation Research. 2011; 108(12):1467–81. doi:10.1161/ circresaha.111.240648PMID:21546606
23. Yu X-Y, Geng Y-J, Li X-H, Lin Q-X, Shan Z-X, Lin S-G, et al. The effects of mesenchymal stem cells on c-kit up-regulation and cell-cycle re-entry of neonatal cardiomyocytes are mediated by activation of insulin-like growth factor 1 receptor. Mol Cell Biochem. 2009; 332(1–2):25–32. doi: 10.1007/s11010-009-0170-xPMID:19507001
24. Urbanek K, Rota M, Cascapera S, Bearzi C, Nascimbene A, De Angelis A, et al. Cardiac Stem Cells Possess Growth Factor-Receptor Systems That After Activation Regenerate the Infarcted Myocardium, Improving Ventricular Function and Long-Term Survival. Circulation Research. 2005; 97(7):663–73. doi:10.1161/01.res.0000183733.53101.11PMID:16141414
25. Burton PBJ, Raff MC, Kerr P, Yacoub MH, Barton PJR. An Intrinsic Timer That Controls Cell-Cycle Withdrawal in Cultured Cardiac Myocytes. Developmental Biology. 1999; 216(2):659–70. Available: doi:http://dx.doi.org/10.1006/dbio.1999.9524. PMID:10642800
26. Tane S, Kubota M, Okayama H, Ikenishi A, Yoshitome S, Iwamoto N, et al. Repression of Cyclin D1 Expression Is Necessary for the Maintenance of Cell Cycle Exit in Adult Mammalian Cardiomyocytes. Journal of Biological Chemistry. 2014; 289(26):18033–44. doi:10.1074/jbc.M113.541953PMID: 24821722
27. Tane S, Ikenishi A, Okayama H, Iwamoto N, Nakayama KI, Takeuchi T. CDK inhibitors, p21Cip1 and p27Kip1, participate in cell cycle exit of mammalian cardiomyocytes. Biochemical and Biophysical Research Communications. 2014; 443(3):1105–9. Available: doi:http://dx.doi.org/10.1016/j.bbrc.2013. 12.109. doi:10.1016/j.bbrc.2013.12.109PMID:24380855
28. Paradis AN, Gay MS, Zhang L. Binucleation of cardiomyocytes: the transition from a proliferative to a terminally differentiated state. Drug Discovery Today. 2014; 19(5):602–9. Available: doi:http://dx.doi. org/10.1016/j.drudis.2013.10.019. doi:10.1016/j.drudis.2013.10.019PMID:24184431
29. Wang F, Gao H, Kubo H, Fan X, Zhang H, Berretta R, et al. T-type Ca(2+) channels regulate the exit of cardiac myocytes from the cell cycle after birth. Journal of molecular and cellular cardiology. 2013; 62:122–30. doi:10.1016/j.yjmcc.2013.05.016PMID:PMC3888788.
30. Eulalio A, Mano M, Ferro MD, Zentilin L, Sinagra G, Zacchigna S, et al. Functional screening identifies miRNAs inducing cardiac regeneration. Nature. 2012; 492(7429):376–81. Available: doi:http://www. nature.com/nature/journal/v492/n7429/abs/nature11739.html#supplementary-information. doi:10. 1038/nature11739PMID:23222520
31. Puente Bao N, Kimura W, Muralidhar Shalini A, Moon J, Amatruda James F, Phelps Kate L, et al. The Oxygen-Rich Postnatal Environment Induces Cardiomyocyte Cell-Cycle Arrest through DNA Damage Response. Cell. 2014; 157(3):565–79. Available doi:http://dx.doi.org/10.1016/j.cell.2014.03.032. doi: 10.1016/j.cell.2014.03.032PMID:24766806
33. Marshall-Clarke S, Reen D, Tasker L, Hassan J. Neonatal immunity: how well has it grown up? Immu-nology Today. 2000; 21(1):35–41. Available: doi:http://dx.doi.org/10.1016/S0167-5699(99)01548-0. PMID:10637557
34. Yoshizumi M, Lee WS, Hsieh CM, Tsai JC, Li J, Perrella MA, et al. Disappearance of cyclin A correlates with permanent withdrawal of cardiomyocytes from the cell cycle in human and rat hearts. The Journal of Clinical Investigation. 1995; 95(5):2275–80. doi:10.1172/jci117918PMID:7738192
35. Chaudhry HW, Dashoush NH, Tang H, Zhang L, Wang X, Wu EX, et al. Cyclin A2 Mediates Cardiomyo-cyte Mitosis in the Postmitotic Myocardium. Journal of Biological Chemistry. 2004; 279(34):35858–66. doi:10.1074/jbc.M404975200PMID:15159393
36. Qian L, Huang Y, Spencer CI, Foley A, Vedantham V, Liu L, et al. In vivo reprogramming of murine car-diac fibroblasts into induced cardiomyocytes. Nature. 2012; 485(7400):593–8. Available: doi:http:// www.nature.com/nature/journal/v485/n7400/abs/nature11044.html#supplementary-information. doi: 10.1038/nature11044PMID:22522929
37. Song K, Nam Y-J, Luo X, Qi X, Tan W, Huang GN, et al. Heart repair by reprogramming non-myocytes with cardiac transcription factors. Nature. 2012; 485(7400):599–604. Available: doi:http://www.nature. com/nature/journal/v485/n7400/abs/nature11139.html#supplementary-information. doi:10.1038/ nature11139PMID:22660318
38. Chen JX, Krane M, Deutsch M-A, Wang L, Rav-Acha M, Gregoire S, et al. Inefficient Reprogramming of Fibroblasts into Cardiomyocytes Using Gata4, Mef2c, and Tbx5. Circulation Research. 2012; 111 (1):50–5. doi:10.1161/circresaha.112.270264PMID:22581928
39. O’Meara CC, Wamstad JA, Gladstone RA, Fomovsky GM, Butty VL, Shrikumar A, et al. Transcriptional Reversion of Cardiac Myocyte Fate During Mammalian Cardiac Regeneration. Circulation Research. 2015; 116(5):804–15. doi:10.1161/circresaha.116.304269PMID:25477501