(Annals of the Brazilian Academy of Sciences)
Printed version ISSN 0001-3765 / Online version ISSN 1678-2690 www.scielo.br/aabc
http://dx.doi.org/10.1590/0001-3765201520140155
Structural Properties of the Brazilian Air Transportation Network
GUILHERME S. COUTO1, ANA PAULA COUTO DA SILVA2, LINNYER B. RUIZ1 and FABRÍCIO BENEVENUTO2
1Universidade Estadual de Maringá, Centro de Tecnologia, Departamento de Informática, Avenida Colombo, 5790, 87020-900 Maringá, PR, Brasil
2Departamento de Ciência da Computação, Universidade Federal de Minas Gerais, Avenida Antônio Carlos, 6627, Pampulha, 31270-010 Belo Horizonte, MG, Brasil
Manuscript received on March 31, 2014; accepted for publication on March 9, 2015 ABSTRACT
The air transportation network in a country has a great impact on the local, national and global economy. In this paper, we analyze the air transportation network in Brazil with complex network features to better understand its characteristics. In our analysis, we built networks composed either by national or by international
flights. We also consider the network when both types of flights are put together. Interesting conclusions
emerge from our analysis. For instance, Viracopos Airport (Campinas City) is the most central and connected
airport on the national flights network. Any operational problem in this airport separates the Brazilian national
network into six distinct subnetworks. Moreover, the Brazilian air transportation network exhibits small world characteristics and national connections network follows a power law distribution. Therefore, our analysis sheds light on the current Brazilian air transportation infrastructure, bringing a novel understanding that may help face the recent fast growth in the usage of the Brazilian transport network.
Key words: Brazilian air transportation network, network science, structural network analysis, complex networks.
Correpondence to: Ana Paula Couto da Silva E-mail: ana.coutosilva@dcc.ufmg.br
INTRODUCTION
Transport networks play an important role on the daily lives of populations. In addition to the impact on the country’s economy as well as on its development, transport networks improve people’s quality of life. Among all transport networks, air transportation network is one of the most important, connecting people in a fast and safe way. In some countries, such as the USA, the use of airplanes to travel from place to place comes from many decades ago. However,
some countries experimented an explosion on using air transpor tation system only few years ago (ANAC 2013).
Brazil is an example of a country that has had an impressive growth in the usage of the air transportation network in the last 10 years. This growth is due to two main factors: the improvement of Brazilian family income and the decrease of the price of airline tickets. In 2003, 37.2
million passengers flew (29 million and 8 million passengers for national and international flights,
million passengers for national and international
flights, respectively). Likewise, the total number of flights almost doubled from 611,091 flights in 2003 (534 thousand national flights and 76 thousand international flights) to 1,126,907 flights in 2012 (989 thousand national flights and 137 thousand international flights) (ANAC 2013).
As the most of air transportation networks, the Brazilian network has a complex structure, with dozens of airports and airline companies, operating
thousand of national and international flights.
Understanding the underlying structural properties of this network is crucial to properly face its fast growth in the last years. Some of the challenges to be faced are, for instance, modernize the airports’ infrastructure that are outdated and establish better
flight routes in order to improve the quality (Pacheco
and Fernandes 2003).
Even though there are many governmental analysis on this topic, we believe that an analysis of the Brazilian air transportation structure, at a network level, is still lacking. The overall analysis
of the network enables the identification of the
most important and central airports, as well as, the infrastructure robustness under airports fail due to, for instance, weather conditions. Furthermore, it is not clear how the properties of the Brazilian air transportation network compare with other country networks. A complex network analysis (Newman 2003, Reka and Barabási 2002) provides an ideal framework to pursue such a study. To the best of
our knowledge, this is the first study that provides
a deeper analysis of the Brazilian air transportation using a large number of complex networks features.
For that purpose, we have collected data from Ageˆncia Nacional de Aviac¸a˜o Civil (ANAC)1, the civil aviation authority that is responsible for
regulating the air transport in Brazil. We built
three networks of nodes (representing the airports) and established links between pairs of airports
connected by flights of 51 airline companies that
operate in the Brazilian airspace (including the four largest Brazilian airline companies: TAM,
Gol/Webjet, Azul/Trip, Avianca). We hope that
our analysis sheds light on the current Brazilian air transportation infrastructure, bringing a novel perspective to understanding its main properties
and characteristics. Our main findings are:
• The Brazilian Air Transportation Network exhibits small world characteristics with low average shortest path length and high
cluste-ring coefficient;
• Airport connections follow a power law distribution, with few hubs connected to many
low-degree neighbors;
• Viracopos Airport (Campinas City) is the most connected and central airport in the national
flights network, being part of a large number of shortest routes;
• Brazilian travelers need, on average, 3
connec-tion flights to reach their destinaconnec-tions. The
maximum number of connections is 7, from Confresa Airport (state of Mato Grosso) to Pato
de Minas Airport (state of Minas Gerais);
• The most central airports are concentrated on the Southest and on the Brazilian coastal region. To reach cities not in these regions many
hops are mandatory;
• Viracopos Airport outage breaks the network into 6 subnetworks, affecting 10% of the passengers.
The rest of the paper is organized as follows.
In Section 2 (See Related Work), we review the main
results found on air transportation networks characte-rization. Afterward, we describe the data we collected and how we modeled the air transportation network in Section 3 (See The Air Transportation Network). In Section 4 (See Air Transportation Network Analysis and Discussion) we discuss our results and their
implications. Lastly, in Section 5 (See Conclusions),
we present our main conclusions and directions for future work.
RELATED WORK
Several papers in the literature have devoted their attention to characterizing and analyzing the airline network from a national and worldwide point of view. In (Guimer et al. 2005) authors analyzed the global structure of the worldwide air transportation network. They found that the worldwide air transportation network follows a scale-free and small-world characteristics and the most connected cities are not necessarily the
most central ones. Furthermore, authors identified
each global role of a city based on its pattern of intercommunity and intracommunity connections.
This result enabled the creation of a scale-specific
representation of the whole network.
The main purpose of (Cheung and Gunes 2012) was to analyze the social network features of the U.S. air transportation network. Authors showed that the network exhibits small-world characteristics and, on average, travelers experien-ced 2 transfers before reaching their destinations. Over the past two decades, network has grown through the years as the number of airports and
the number of flight routes between airports has
increased to meet customer demands. They also show that the air transportation network, unlike other examples of networks, has only a partial power law degree distribution.
Authors in (Bagler 2008), instead, analyzed the air transportation network in India. This network also has a small-world characteristic, with some airports acting as hubs connected to low-degree neighbors.
Chinese airport network is analyzed in (Li and Cai
2004) and it also follows a small-world model. Interestingly, the cumulative degree distributions of both directed and undirected networks obey two-regime power laws with different exponents.
The Italian Airport Network was analyzed in (Guida and Maria 2007). The topological properties of the resulting network have been
examined leading to the confirmation of a
scale-free behavior in the connection distribution. However, the scale-free behavior turned out to be a little bit different from the ones already reported, suggesting that the growth mechanism model underlying the network could be different from the ones proposed so far. This consideration is due to the fact that the outcomes of the investigation strongly suggest a fractal structure for this network. Moreover, the paper shows that
the clustering coefficient is rather comparable or a
little bit smaller than those for a random network, differently from what occurs to some other, where
the clustering coefficients are larger than the
corresponding random values.
Some works that analyze the Brazilian air transportation network can be found in (Pacheco and Fernandes 2003, Costa et al. 2010, Oliveira et al. 2013). Authors in (Pacheco and Fernandes 2003) analyzed how to improve the infrastructure of Brazilian airports. Authors in (Costa et al. 2010) pointed out how many hubs the Brazilian air transportation network should have to improve its infrastructure quality. Furthermore, authors also indicated the main airports which should be transformed into hubs.
The results more in line with our work are presented in (Oliveira et al. 2013). In that work, authors analyze the Brazilian air transportation system. However, differently of our focus on analyzing the global and local characteristic of the network topology, authors focus on studying the hub organization of airports in Brazil. They show that Guarulhos Airport in São Paulo (GRU)
has a crucial role in terms of number of flights and
connections. Then, they investigated the robustness of the network with a single hub, by analyzing the impact of the removal of GRU from the network.
THE AIR TRANSPORTATION NETWORK
DATASET
Many measures - including total number of
passen-gers, total number of flights, or total amount of
cargo - quantifying the importance of Brazilian airports are compiled and publicized in the Agência Nacional de Aviação Civil (ANAC) website2. Data is organized in updated spreadsheets with information
about authorized national and international flights3.
We restrict our analysis to passenger flights
operating according to the data provided in October 20, 20134. As flights do not have significant changes, we can assume that we are using a stable view of the airline network, based on the weekly information. At that time, there were 3, 579 national (interstate
and intrastate flights) and 419 international flights,
respectively. The total number of Brazilian airports is 120, 15 of them operating both national and
international flights. A total number of 53 foreign airports have flights to/from Brazil. The total number of passengers on each flight is the maximum number of allowed passengers on each flight. We do not have access to the number of occupied seats for a specific flight. Therefore, here we present the upper bound
values with respect to the maximum passenger
capacity in each flight.
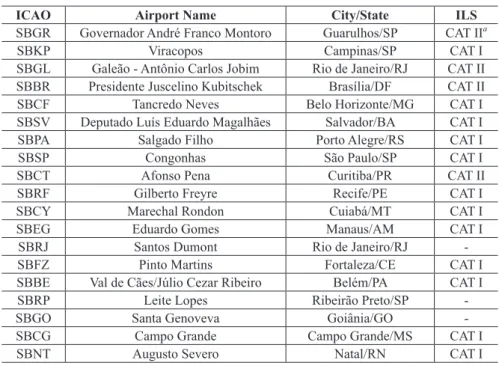
Some Brazilian airports found in the spread-sheets are shown in Table I. It shows the ICAO code5, the airport name and the city of the airport. An additional information6was inserted in Table I to better analyze the air transportation network: the
Instrument Landing System (ILS)7. This instrument helps pilots in landing operations and it is generally
used only when visibility is limited and the pilot cannot see the airport and the runway. The system is divided into three categories of approach from I
to III. In “CAT I” ILS, for instance, pilot needs to
have at least 200 ft of decision height and 1,600 ft
of visibility. In “CAT IIIc” ILS, instead, pilot can
land in any visibility condition. So far, Brazilian
airports are not equipped with the safest ILS
instrument. In this sense, Brazilian airports tend to be more vulnerable to bad weather conditions.
NETWORK MODELS
We focus our analysis on three scenarios that
enable us to better characterize the Brazilian airport infrastructure, as well as to characterize the
types of flights offered to the population. Although
we present a more detailed analysis considering national connections, we also provide insights on international connections. Furthermore, we analyze a network model including both national and international connections. All metrics we used are usual metrics of complex network analysis
(Newman 2003, Reka and Barabási 2002). We
represented the Brazilian airport network as a directed graph G(V, E ), where V is the set of airports and E is the set of links. A link between
two airports exists if there is at least one flight
from one airport to another. Here, we consider two versions of graph G: the unweighted and the weighted one. It is worth noting that we use the weighted version of each graph only for calculating the maximum number of passengers metric. (In this case, the maximum number of passengers is the link weight).
2
http://www2.anac.gov.br/hotran/. Additional information can be found in http://www.infraero.gov.br/index.php/situacao-dos-voos/por-aeroporto.html
3Stop flights were considered as a set of individual flights
4
20th to 26th-October week 5
The International Civil Aviation Organization Code assigned to distinguish uniquely each airport 6Obtained at http://www.aisweb.aer.mil.br/?i=cartas&filtro=1&nova=1
We consider three different network models:
Gnational with national flights, Ginternational with
international flights and Goverall, considering both
national and international flights. Table II presents
the total number of nodes (airports) and links (connections) on each graph.
NETWORK METRICS
We characterize the Brazilian air transportation
network using classical graph theory metrics (a more detailed discussion on each metric can be found in (Newman 2003, Reka and Barabási
2002)). We used the interactive open source graph
visualization and manipulation platform software Gephi (Bastian et al. 2009) for rebuilding and analyzing the graph we modeled.
In-degree and out-degree
The in-degree of node v, kin(v), is the total number
of incoming links. In the same way, the out-degree of node v, kout(v) is the total number of outgoing
links. Then, the degree of node v, k(v), is given by the summation of kin(v) and kout(v). The mean
degree, < k >, of a G is given by:
< k > (G) =
8v2V
∑
k(v)/|V |.
Weighted in and out degrees are a straight-forward definition of the unweighted version.
Average neighborhood overlap
Let N (u) and N (v) be the set of neighbors of nodes u and v, respectively. The neighborhood overlap, no(u, v) of nodes u and v, is given by:
no(u,v) = (N(u) \N(v))/(N(u) [N(v)),
ICAO Airport Name City/State ILS
SBGR Governador André Franco Montoro Guarulhos/SP CAT IIa
SBKP Viracopos Campinas/SP CAT I
SBGL Galeão - Antônio Carlos Jobim Rio de Janeiro/RJ CAT II SBBR Presidente Juscelino Kubitschek Brasília/DF CAT II
SBCF Tancredo Neves Belo Horizonte/MG CAT I
SBSV Deputado Luís Eduardo Magalhães Salvador/BA CAT I
SBPA Salgado Filho Porto Alegre/RS CAT I
SBSP Congonhas São Paulo/SP CAT I
SBCT Afonso Pena Curitiba/PR CAT II
SBRF Gilberto Freyre Recife/PE CAT I
SBCY Marechal Rondon Cuiabá/MT CAT I
SBEG Eduardo Gomes Manaus/AM CAT I
SBRJ Santos Dumont Rio de Janeiro/RJ
-SBFZ Pinto Martins Fortaleza/CE CAT I
SBBE Val de Cães/Júlio Cezar Ribeiro Belém/PA CAT I
SBRP Leite Lopes Ribeirão Preto/SP
-SBGO Santa Genoveva Goiânia/GO
-SBCG Campo Grande Campo Grande/MS CAT I
SBNT Augusto Severo Natal/RN CAT I
TABLE I Main Brazilian Airports.
aGuarulhos has CAT IIIa installed since 2011 but to date is still not certified.
TABLE II
Number of nodes and edges for each connection network.
Scenario Nodes Edges
Gnational 120 726
Ginternational 68 222
also know as Jaccard Coefficient. Then, the
average neighborhood overlap is given by:
< no > =
1 |E|8(u
∑
,v)2Eno(u,v).
Shortest path
Let Pu,v be the set of paths between a given pair of
nodes u and v. We define the shortest path l(u, v) as the one having the lowest number of hops between
source and destination. Let be also L the set of all shortest paths l(u, v), 8(u, v). The mean shortest path < l >, of a graph G is given by:
< l > (G) = 1
|L|8 l(u
∑
,v)2Ll(u,v).
Diameter
Let l(u, v) be the shortest path between nodes u and v. Diameter, d, is defined as the longest shortest path between any pair of nodes in the network:
d(G) =
8 (max u,v)2Vl(u,v).
Diameter property provides an idea of the dispersion in G. In the air transportation network, diameter measure means the biggest trip in number of hops.
Clustering coefficient
We define the clustering coefficient, also known as
network transitivity, as follows. In many networks, if node A is connected to node B and node B to node C, then there is a heightened probability that node A will also be connected to node C. In terms of network topology, transitivity means the presence of a heightened number of triangles in the network,
i.e., sets of 3 nodes connected to each other. We define the clustering coefficient C of G as:
C(G) = 3 x number of triangles in the network number of connected triples of vertices
Where a “connected triple” means a single node
with edges running to an unordered pair of others.
Betweenness
The betweenness βvof node v is the fraction of
shortest paths connecting all pairs of nodes that pass through v. In other words, let σ(j,k)represent the number of shortest paths between nodes j and k, and σ(j,k)(v) the number of those paths that traverse node v. The betweenness of v is thus defined as:
β(v) =
j≠v
∑
≠k2Vσ(j,k) (v) σ(j,k) .
Closeness
The closeness γvof node v captures how close it is
from all other reachable nodes in the network. Given π(v, k), the length of the shortest path between v and any other reachable node k, γv is defined as:
°(v) =
k≠v,
∑
k2Vπ(v,k) -1
.
PageRank
PageRank is an algorithm used by the Google web search engine to rank websites in their search engine results. PageRank works by counting the number and quality of links to a node to determine a rough estimate of how important the node is. The underlying assumption is that more important nodes are likely to receive more links from other nodes (Brin and Page 1998). In the air transportation
network it can assess which airport is more influent
than others. The rank of a node Pi is given by the
sum of all node ranks that point to node Pi divided
by the number of nodes Pipoints to:
r(Pi) = Pj 2BPi
∑
r(Pj)|Pj|
,
rk+1(Pi) = Pj 2BPi
∑
rk(Pj)|Pj|
.
PageRank definition is recursive, and the process
is iterated many times8.
Graph density
The graph density D is defined as a ratio of the number of edges |E| to the number of possible edges (considering the complete graph):
D = 2|E|/(|V|(|V| − 1)).
Connected component of the graph
A directed graph is strongly connected if every node is reachable from every other node. In this sense, the strongly connected components of an arbitrary directed graph form a partition into subgraphs that are themselves strongly connected.
TABLE III
Metrics of different Air Transportation Networks.
Worldwidea
Indiab
Chinac
USAd
Italye
BRAZILf
Average Shortest Path 4.4 4 2.067 3.241 3.74 2.866
Average Clustering 0.62 0.6574 0.733 0.6208 0.1 0.451
Power Law Exponent 1.0 ≈ 2.2 1.65 Partial 1.0512g 0.2/1.7h 1.0522
a(Guimer et al. 2005), b(Bagler 2008), c(Li and Cai 2004), d(Cheung and Gunes 2012), e(Guida and Maria 2007), fOur results, gDegree distribution function is a mixed distribution, hDegree distribution is a combination of two power
law distribution functions with coefficients equal to 0.2 and 1.7.
AIR TRANSPORTATION NETWORK ANALYSIS AND DISCUSSION
This section describes the results obtained from the analysis of our database. First, the Brazilian air transportation network is compared with other country’s airplane networks previously analyzed in the literature. Then, a more detailed analysis about
the national flights is presented indicating some
characteristics of the Brazilian air transportation network. Moreover, we show the community forma-tion and the resiliency analysis of the Brazilian network. Finally the International and the Overall view of the Brazilian airports network is presented showing some peculiarities of the network, such as to which international airports Brazil is connected.
BRAZILIAN AIR TRANSPORTATION NETWORK VERSUS
FOREIGN AIR TRANSPORTATION NETWORKS
Table III shows the comparison of Brazilian airline network against the set of foreign networks found
in literature (Guimer et al. 2005, Bagler 2008, Li
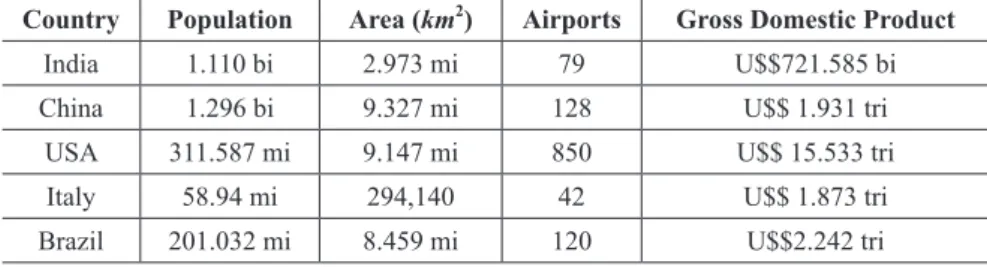
and Cai 2004, Cheung and Gunes 2012, Guida and Maria 2007). To provide a better comparison among the characteristics of different airline networks, Table IV shows some indicators of each country we show in Table III, considering the year of the dataset analyzed in each work found in literature.
First we can note that node degree on the Gnational follows a power law, which means that there are few airports with many connections and many airports with few connections. Such network, whose degree
TABLE IV
Some important indicators of each country.
Country Population Area (km2) Airports Gross Domestic Product
India 1.110 bi 2.973 mi 79 U$$721.585 bi
China 1.296 bi 9.327 mi 128 U$$ 1.931 tri
USA 311.587 mi 9.147 mi 850 U$$ 15.533 tri
Italy 58.94 mi 294,140 42 U$$ 1.873 tri
distribution follows a power law, is called scale-free network. Second, the average shortest path is also low, with few hops to move from place to place. Furthermore, the Brazilian network has lower average clustering value, in comparison to the others. This implies that there are fewer triangles in the network, leading to a low redundancy in paths between airports. From indicators showed in Table IV, we can note that Brazil has a larger number of airports per capita than India and China. USA, as expected, is the country with the most airports, mainly because of its area and its economic power. However, considering only the topological metrics, results reveal that the Brazilian airline network follows a similar structure when compared to other airlines network.
NATIONAL NETWORK CHARACTERISTICS
Next, we consider the 3,579 national flights operated
by the airline companies as well as the 120 airports in
which flights take off from and land at. In this sense,
the national graph version of G has 120 nodes and 726 links. The maximum number of passengers that can move per week is equal to 2, 631, 836. In other words, this number is the total number of passengers
in the case that all flights were completely full. Table V shows the global metrics. We found some
interesting conclusions. The generated graph is connected, meaning that it is possible to reach all airports from another. Airport connectivity is low: on average, each airport connects to another 6 airports (5% of total number of nodes). In the United States, for instance, the mean of connections is 24 airports but it only represents 2.8% of the total number of airports. Furthermore, the average neighborhood overlap is equal to 0.163. Edges with very small neighborhood overlap act as local bridges, since intuitively, edges with very small neighborhood consist of nodes that span over different regions of the graph. In this sense, the value of neighborhood overlap of the Brazilian airline infrastructure reveals that the network is composed by many airports that act as bridges. This kind of infrastructure directly
Passengers in Brazil take, on average, 3 flights
to move from place to place (the average shortest path is equal to 2.86). Interestingly, the largest trip
in Brazil has 7 flights (diameter graph) and is the trip
from Confresa Airport (sate of Mato Grosso) to Pato de Minas Airport (state of Minas Gerais) (cities are
just 1,472 km apart from each other). Finally, the average clustering coefficient is 0.451. This implies that an airport has 45% of chance to be connected to
another airport in the network. Lastly, the maximum number of passengers that can fly every week is, on
average, equal to 21, 932 per airport.
To provide a deeper analysis, we also inves-tigate the local characteristics of the network structure. The local analysis allows us to identify the main airports in Brazil and their roles in the overall operation of the air transportation network. 93.3% of the airports have less than 40 connections. Just 8 airports have more than 40 connections. The airport with the most connections from/to is Viracopos in
Campinas city (SBKP) with 105. It is clear that the
network infrastructure follows a scale-free model, with some airports acting like hubs.
An interesting finding is that Viracopos Airport
plays an important role in the national network
infrastructure. This affirmation is corroborated by
the top-20 most central airports, considering the
Network Measure Value
Connected Components 1 (120 airports) Average Connections 6.05 (5%) Average Weighted Degree 21,932
Diameter 7
Average Shortest Path 2.866
Graph Density 0.051
Average Clustering Coefficient 0.451 Average Neighborhood Overlap 0.163
TABLE V
Network metrics - National Flights.
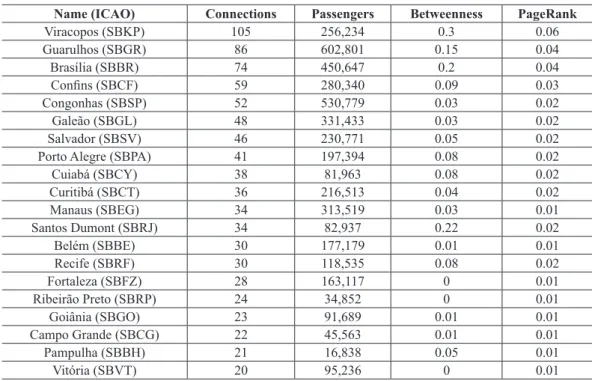
main centrality measures, shown in Tables VI to IX (Airport label is its ICAO9 code). Although Viracopos Airport does not hold the maximum number of passengers per week (Guarulhos Airport has the maximum number of passengers), it is the most frequent airport present in the shortest paths over the network (high betweenness centrality). Furthermore, considering the number of passengers and the airports that have at least
one flight between them, Viracopos has also the highest PageRank centrality. We conjecture that
Viracopos turns to one the most important Brazilian airports after the Azul Airline Company10 creation. Viracopos airport is the main company hub and a large number of routes pass through it, increasing a lot the importance of this airport in the national connections network.
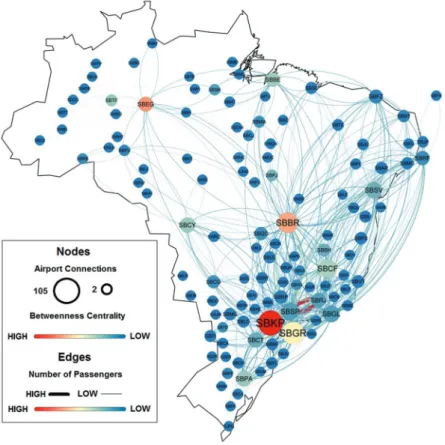
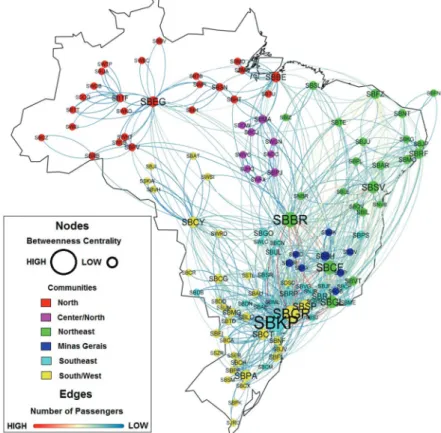
Figure 1 shows a big picture of Brazilian airline network. The node size is proportional to its degree
and the color to its betweenness centrality (red color means high betweenness centrality). Some interesting conclusions can be hold. The most important airports are not well spread over the Brazilian territory. The most connected airports are concentrated in the Southeast region. In some cases, people from North and Northeast
regions need fly to some hub in the Southeast region
in order to go back to some city in those regions. The only airport in North and Northeast region that plays an important role in Brazil airline infrastructure is Manaus
Airport (SBEG). The majority of airports have few
connections and are not placed into the shortest paths in the airline network (the blue ones). As expected, the most important airports are placed in the capital cities.
Edges in Figure 1 represent the total number of passengers between two airports and their thicknesses are proportional to the total number of passengers on the route. The total number of passengers between Congonhas and Santos Dumont Airports (148, 352 passengers per week) is twice the second busiest graph connection, i.e., Congonhas and Brasília Airports (60, 129 passengers per week). The route
Name (ICAO) Connections Passengers Betweenness PageRank
Viracopos (SBKP) 105 256,234 0.3 0.06
Guarulhos (SBGR) 86 602,801 0.15 0.04
Brasília (SBBR) 74 450,647 0.2 0.04
Confins (SBCF) 59 280,340 0.09 0.03
Congonhas (SBSP) 52 530,779 0.03 0.02
Galeão (SBGL) 48 331,433 0.03 0.02
Salvador (SBSV) 46 230,771 0.05 0.02
Porto Alegre (SBPA) 41 197,394 0.08 0.02
Cuiabá (SBCY) 38 81,963 0.08 0.02
Curitibá (SBCT) 36 216,513 0.04 0.02
Manaus (SBEG) 34 313,519 0.03 0.01
Santos Dumont (SBRJ) 34 82,937 0.22 0.02
Belém (SBBE) 30 177,179 0.01 0.01
Recife (SBRF) 30 118,535 0.08 0.02
Fortaleza (SBFZ) 28 163,117 0 0.01
Ribeirão Preto (SBRP) 24 34,852 0 0.01
Goiânia (SBGO) 23 91,689 0.01 0.01
Campo Grande (SBCG) 22 45,563 0.01 0.01
Pampulha (SBBH) 21 16,838 0.05 0.01
Vitória (SBVT) 20 95,236 0 0.01
TABLE VI
Top-20 Airports - Number of Connections - National Flights.
9
Name (ICAO) Passengers Connections Betweenness PageRank
Guarulhos (SBGR) 602,801 86 0.15 0.04
Congonhas (SBSP) 530,779 52 0.03 0.02
Brasília (SBBR) 450,647 74 0.2 0.04
Galeão (SBGL) 331,433 48 0.03 0.02
Santos Dumont (SBRJ) 313,519 34 0.03 0.01
Confins (SBCF) 280,340 59 0.09 0.03
Viracopos (SBKP) 256,234 105 0.3 0.06
Salvador (SBSV) 230,771 46 0.05 0.02
Curitiba (SBCT) 216,513 36 0.04 0.02
Porto Alegre (SBPA) 197,394 41 0.08 0.02
Recife (SBRF) 177,179 30 0.01 0.01
Fortaleza (SBFZ) 163,117 28 0 0.01
Belém (SBBE) 118,535 30 0.08 0.02
Florianópolis (SBFL) 99,775 14 0 0
Vitória (SBVT) 95,236 20 0 0.01
Goiânia (SBGO) 91,689 23 0.01 0.01
Manaus (SBEG) 82,937 34 0.22 0.02
Cuiabá (SBCY) 81,963 38 0.08 0.02
Natal (SBNT) 59,680 17 0 0
São Luís (SBSL) 58,170 16 0 0
Name (ICAO) Betweenness Connections Passengers PageRank
Viracopos (SBKP) 0.30 105 256,234 0.06
Manaus (SBEG) 0.22 34 82,937 0.02
Brasília (SBBR) 0.20 74 450,647 0.04
Guarulhos (SBGR) 0.15 86 602,801 0.04
Confins (SBCF) 0.09 59 280,340 0.03
Belém (SBBE) 0.08 30 118,535 0.02
Cuiabá (SBCY) 0.08 38 81,963 0.02
Tefé (SBTF) 0.08 14 3,523 0.02
Porto Alegre (SBPA) 0.08 41 197,394 0.02
Palmas (SBPJ) 0.05 12 18,714 0.01
Salvador (SBSV) 0.05 46 230,771 0.02
Pampulha (SBBH) 0.05 21 16,838 0.01
Curitiba (SBCT) 0.04 36 216,513 0.02
Santos Dumont (SBRJ) 0.03 34 313,519 0.01
Santarém (SBSN) 0.03 10 25,352 0.01
Congonhas (SBSP) 0.03 52 530,779 0.02
Galeão (SBGL) 0.03 48 331,433 0.02
Marabá (SBMA) 0.02 14 18,286 0.01
Campo Grande (SBCG) 0.01 22 45,563 0.01
Goiânia (SBGO) 0.01 23 91,689 0.01
TABLE VII
Top-20 Airports - Maximum Number of Passengers - National Flights.
TABLE VIII
Congonhas – Santos Dumont Airports concentrates a huge amount of passengers given that São Paulo and Rio de Janeiro are the most important cities in Brazil, both in terms of number of population and economic power.
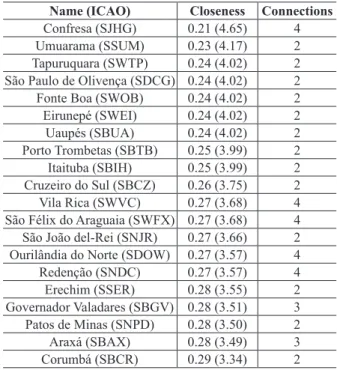
Tables X and XI show the 20 airports with the highest and the lowest closeness centrality values, respectively. Airports with the highest closeness values are placed in the main Brazilian cities (capitals in Southeast, South and coastal region). Airports with the lowest closeness values are place in the North, Northeast Brazilian regions as well as in small cities.
Community structure
Most of real networks show community structure, i.e., groups of nodes that have a high density of links among them, with a lower density of links between different groups. Communities can be build following
some rules based on specific characteristics related to
the entities that formed them. The understanding of community existence as well as the pattern formation is one of many important tasks in network science theory (Iñiguez et al. 2009, Newman 2006, Fortunato 2010). In terms of air transportation networks, the community formation phenomena may shed light on, whether, if the community formation follows the geographical country division.
We verify if Brazilian airports are grouped into different communities. We performed the algorithm
proposed by (Blondel et al. 2008). Communities
are defined based on the airports connections. In
this sense, airports in the same community have many more connections with each other inside the community than with airports outside of the community. Figure 2 shows the community structure of the network. Each color represents a
community found by the algorithm. Interestingly,
the communities structure almost reflects the
Brazilian regions. North (Amazonia) region has the
Manaus Airport (SBEG) as the major one. We also
have a smaller group (pink one) that represents some airports of sates of Tocantins, Pará and Mato Grosso, such as Marabá Airport (SBMA) and Palmas Airport (SBPJ) each with less than 19,000 passengers per week. The remaining airports are small ones with less than 4,000 passengers per week.
The green community is very similar, geogra-phically speaking, to the Northeast Brazilian region. However, this community also includes Brasília,
Confins and Galeão airports, meaning that the
Northeast region is highly dependant on the South Airports. The dark blue community is composed by small airports, mainly from the state of Minas Gerais. The light blue community has Viracopos Airport, the most connected airport considering
national flight connections. Furthermore, it englobes
many airports from the Southeast region. The yellow
Name (ICAO) PageRank Connections Passengers Betweenness
Viracopos (SBKP) 0.06 105 256,234 0.30
Guarulhos (SBGR) 0.04 86 602,801 0.15
Brasília (SBBR) 0.04 74 450,647 0.20
Confins (SBCF) 0.03 59 280,340 0.09
Manaus (SBEG) 0.02 34 82,937 0.22
Congonhas (SBSP) 0.02 52 530,779 0.03
Salvador (SBSV) 0.02 46 230,771 0.05
Porto Alegre (SBPA) 0.02 41 197,394 0.08
Galeão (SBGL) 0.02 48 331,433 0.03
Cuiabá (SBCY) 0.02 38 81,963 0.08
Tefé (SBTF) 0.02 14 3,523 0.08
Belém (SBBE) 0.02 30 118,535 0.08
Curitiba (SBCT) 0.02 36 216,513 0.04
Santos Dumont (SBRJ) 0.01 34 313,519 0.03
Pampulha (SBBH) 0.01 21 16,838 0.05
Recife (SBRF) 0.01 30 177,179 0.01
Fortaleza (SBFZ) 0.01 28 163,117 0.01
Goiânia (SBGO) 0.01 23 91,689 0.01
Ribeirão Preto (SBRP) 0.01 24 34,852 0.00
Campo Grande (SBCG) 0.01 22 45,563 0.01
TABLE IX
Top-20 Airports - PageRank Centrality - National Flights.
TABLE X
Top-20 Airports - Highest Closeness Centrality - National Flights.
Name (ICAO) Closeness(Average
Shortest Path) Connections
Viracopos (SBKP) 0.58 (1.7) 105
Brasília (SBBR) 0.55 (1.8) 74
Guarulhos (SBGR) 0.54 (1.84) 86 Confins (SBCF) 0.52 (1.91) 59
Galeão (SBGL) 0.5 (1.98) 48
Manaus (SBEG) 0.46 (2.13) 34
Belém (SBBE) 0.45 (2.17) 30
Fortaleza (SBFZ) 0.45 (2.18) 28 Congonhas (SBSP) 0.45 (2.2) 52 Curitiba (SBCT) 0.45 (2.21) 36 Salvador (SBSV) 0.44 (2.22) 46 Porto Alegre (SBPA) 0.44 (2.22) 41 Santos Dumont (SBRJ) 0.44 (2.24) 34
Cuiabá (SBCY) 0.44 (2.26) 38
Goiânia (SBGO) 0.43 (2.3) 23
Recife (SBRF) 0.42 (2.33) 30
Ribeirão Preto (SBRP) 0.42 (2.35) 24 Campo Grande (SBCG) 0.42 (2.35) 22
Vitria (SBVT) 0.42 (2.36) 20
community is composed by airports from the South region as well as by the Guarulhos and Congonhas airports. The community analysis provides a nice way of identifying airports dependencies from both structural and economic points of view. Moreover, it is also possible to have some insights of air company’s economics interests.
Resiliency analysis
Resiliency analysis gives important insights on the air-line network robustness under topology changes. For instance, some airports can be closed as a consequence of bad weather conditions or operational
problems. Consequently, routes have to be redefined.
Here, we study the impact on the number of compo-nents as well as on the total number of passengers when some airports are removed from the network.
Our resiliency analysis proceeds as follows.
We perform airports removals targeting the most
central nodes in the network, according to the number of connections, betweenness and number of
passengers. We remove nodes in decreasing order
of their metric values. Consecutive removals are performed until the giant component achieves half of its initial size.
Figures 3 and 4 show the results. Considering the number of components, the worst case happens when airports with the highest betweenness measures are removed from the network. By removing the three airports with the highest betweenness (Viracopos, Guarullhos and Brasília in this order), the network is fragmented into 6 connec-ted components. Considering the percentage of the passengers, the worst case occurs by removing four airports (Guarulhos, Congonhas, Brasília and Galeão Airports in this order). The total number of passengers drops to almost 30% of the total capacity.
This analysis shows how dangerous it is to remove an airport in the network. For instance, let us
consider the Viracopos airport (SBKP). It is the most
important airport considering national connections, in terms of topological characteristics. As expected, its removal can cause many disconnection points. Table I shows that Viracopos airport is equipped
with ILS CAT I which is not suitable for dealing
with extreme weather conditions. Then, Viracopos airport has high chances of being closed due to
bad weather conditions. This fact influences the
network topology stability.
Time analysis
The results in the previous sections do not take
into account any information about flight duration and flight daily distribution. To investigate the
time impact in our analysis, we included the
flight duration in each edge of our graph model.
Including time in our analysis allows to obtain some interesting results.
Figure 5 shows the air transportation network
where nodes are proportional to the time flights
among airports: nodes with largers size represent
airports with greater average flight durations from them. The largest one-hop flight departs from Galeão Airport (SBGL) and arrives at
TABLE XI
The 20 airports with the lowest closeness centrality values.
Name (ICAO) Closeness Connections
Manaus Airport (SBEG) with duration of 245
minutes. The smallest one-hop flight departs from
Ipatinga Airport (SBIP) and arrives at Governador
Valadares Airport (SBGV) with duration of 15 minutes. The results corroborate the metrics previously calculated.
Figure 2 - Airports grouped by different communities. For interpretation of the refe-rences to color in this figure, the reader is referred to the web version of this article.
Figure 3 - Changes to the number of components by the total number of removed airports. For interpretation of the references to color in this figure, the reader is referred to the web version of this article.
Tables XII and XIII show the airports with the largest and smallest average path durations (in minutes) to all airports in the Brazilian air
trans-portation network. We calculate all pairs of shortest paths considering flight duration. It is worth noting
that we are not taking into account the time spent
between connections. We compute the average time
for traveling from one airport to the all anothers in the network. Tables XII and XIII also show the longest travel time calculated from all-to-all paths.
Lastly, we briefly discuss how the interruption
in the airports’ activities, in terms of time duration and period of day, impacts the Brazilian air transpor tation network robustness. Section 4.2.2 (See Resiliency Analysis) shows that Viracopos, Guarulhos, Brasília, Congonhas and Galeão Airports are the most important airports when we focus on network robustness. Figure 6 shows
the daily flight distribution. Flights in Viracopos,
Brasília and Galeão have two peak intervals of
Figure 5 - Brazilian airports and their flights duration representation. For
inter-pretation of the references to color in this figure, the reader is referred to the web version of this article.
flight concentration: [6AM, 10AM] and [6PM and 10PM]. The interruption of the activities during
these intervals severely impacts all network, due to the fact that these airports connect several other airports between themselves. Guarulhos and Congonhas have a smoother distribution during the day, resulting in a worse scenario for the interruption of the activities. The worst consequence in the
network functioning is the severe cascade delay
effect on all flights in the network.
INTERNATIONAL NETWORK CHARACTERISTICS
In order to understand how international flights are
organized in the airline network, we built a graph composed of the Brazilian airports that support
that have flights to Brazil. Graph Ginternationalhas 68 airports, 15 of them in Brazil and 53 of them overseas.
Different from the national view, the generated graph has two components. One englobes Belém (SBBE), Surinam and French Guiana airports. The other component is the giant strongly connected com-ponent covering all other Brazilian and foreign airports. The main global metrics are summarized in Table XIV on average, every international Brazilian airport has connections to 3 other foreign airports. Approximately 7, 208 passengers travel per airport in a week.
Figure 7 shows the two main graph compo nents. Furthermore, node size is proportional to the connec-tions to a given airport: Guarulhos Airport (SBGR) plays the most important role in the airline international
network, followed by the Galeão Airport (SBGL).
Table XV shows the total number of international passengers supported by each airport. Guarulhos and Galeão Airports hold, respectively, 313,275 and 100,886 passengers per week (84% of the interna-tional passengers). This result reinforces the importance
ICAO Average Travel Time (min) Longest Travel Time (min)
SWEI 441.8 617
SBUA 417.01 592
SDCG 417.01 592
SBTT 396.54 570
SWTP 392.22 567
SBCZ 384.72 525
SWOB 382.31 557
SWLB 365.75 533
SBTB 358.54 551
SBJI 355.9 513
SBBV 353.79 521
SBIH 352.52 545
SSZR 343.63 611
SBTF 337.68 512
SWKO 334.06 501
SWBC 333.96 501
SWPI 331 498
SJHG 326.54 521
SBFN 326.3 501
SSUM 325.99 593
TABLE XII
Top-20 largest average time of all paths in the air transportation network.
Name (ICAO) Average Travel Time (min)
Longest Travel Time (min)
Brasília (SBBR) 178.63 355
Viracopos (SBKP) 182.16 409
Confins (SBCF) 185.23 391
Guarulhos (SBGR) 190.21 408
Goiânia (SBGO) 197 395
Congonhas (SBSP) 199.71 458
Galeão (SBGL) 203.86 417
Uberlândia (SBUL) 204.05 425 Santos Dumont (SBRJ) 206.52 458
Curitiba (SBCT) 208.51 473
Ribeirão Preto (SBRP) 210.56 460
Cuiabá (SBCY) 217.06 373
Caldas Novas (SBCN) 217.86 432
Vitória (SBVT) 222.09 457
Navegantes (SBNF) 222.77 474
Londrina (SBLO) 224.28 472
São José R.P (SBSR) 224.34 473
Campo Grande (SBCG) 227.66 446
Ipatinga (SBIP) 227.75 439
Porto Seguro (SBPS) 229.91 466
TABLE XIII
Metric Value
Connected Components 2 (68 airports)
Average Connections 3.265
Average Weighted Degree 7, 208
Diameter 6
Average Shortest Path 2.389
Graph Density 0.049
of Guarulhos and Galeão airports and the need for
efficient contingency policies in both airports.
Figure 8 shows that Brazil has three main
over-seas connections: Miami (KMIA), Buenos Aires (SAEZ) and Lisboa Airports (LPPT). Airports in
Brazil are the main en trances/exits to/from South America of people coming to/from North America
TABLE XIV International Connections.
Figure 6 - Daily distribution of flights. For interpretation of the references to color in this figure, the reader is referred to the web
Name (ICAO) Passengers Connections Passengers (in) Passengers (out)
Guarulhos (SBGR) 313,275 96 156,774 156,501
Galeão (SBGL) 100,886 50 50,443 50,443
Ezeiza (SAEZ) 52,260 16 26,130 26,130
Miami (KMIA) 44,824 14 22,412 22,412
Lisbon (LPPT) 36,868 20 18,434 18,434
Santiago (SCEL) 26,714 4 13,357 13,357
Jorge Newbery (SABE) 25,270 6 12,635 12,635
John F. Kennedy (KJFK) 22,892 4 11,446 11,446
Tocumen (MPTO) 21,964 14 10,982 10,982
Charles de Gaulle (LFPG) 19,366 4 9,683 9,683
Madrid-Barajas (LEMD) 18,544 6 9,272 9,272
Carrasco (SUMU) 15,501 6 7,614 7,887
Frankfurt (EDDF) 15,088 8 7,544 7,544
London Heathrow (EGLL) 14,472 4 7,236 7,236
Jorge Chvez (SPIM) 13,882 8 6,941 6,941
Porto Alegre (SBPA) 13,702 12 6,851 6,851
Brasília (SBBR) 13,662 10 6,831 6,831
El Dorado (SKBO) 9,982 4 4,991 4,991
Confins (SBCF) 9,838 8 4,919 4,919
TABLE XV
Top-20 - Maximum Number of Passengers - International Flights.
and Europe. Considering the current flights, the
maximum number of passengers that are allowed to come to Brazil and to exit from Brazil are 245,232 and 244,959 passengers per week, respectively.
In this section, our analysis considers the national and international connections from/to Brazilian airports. Goverall graph has one component and, in the average, each airport connects to another 5.48 airports. Graph density is low, meaning that the connec tions are too sparse. On average, the
Figure 8 - Brazilian Connections from/to Worldwide. For interpretation of the
refe-rences to color in this figure, the reader is referred to the web version of this article.
total number of passengers is equal to 18,046. The average trip size is equal to 2.76. Table XVI summarizes the results.
Considering both national and international connections, Guarulhos and Viracopos are the most central airports in Brazil, as expected. Guarulhos plays a key role in airline network, dealing with
the largest number of passengers and flights.
Table XVII shows the main centrality measures, considering the top-20 Brazilian airports for the number of connections. As expected, the most connected airports are the state capitals ones and all of them have high closeness centrality.
Resiliency analysis
In this section we briefly discuss the resiliency of
the international network. Our analysis proceed very similarly to the discussion in Section 4.2.2. (See Resiliency Analysis) As for the national network, we perform airports removals targeting the most central nodes in the network, according to the number of connections, betweenness and number of
Metric Value
Connected Components 1 (173 airports) Average Connections 5.48 (3.16%) Average Weighted Degree 18, 046
Diameter 7
Average Shortest Path 2.76
Graph Density 0.03
Average Clustering Coefficient 0.44 Average Neighborhood Overlap 0.12
TABLE XVI
passengers. Furthermore, we only remove Brazilian Airports. Figures 9 and 10 show the results.
From this simple analysis, it is possible to corroborate the importance of Guarulhos and
Galeão Airports as exit point from Brazil to other countries. For all centrality metrics analyzed,
both airports were removed in the first and second
places. For the cases which Guarulhos Airport is
Name (ICAO) Connections Passengers Closeness Betweenness PageRank
Guarulhos (SBGR) 182 916,076 0.61 0.44 0.095
Viracopos (SBKP) 107 257,812 0.51 0.18 0.048
Galeão (SBGL) 98 432,319 0.54 0.1 0.044
Brasília (SBBR) 84 464,309 0.54 0.14 0.035
Confins (SBCF) 67 290,178 0.51 0.05 0.028
Salvador (SBSV) 56 239,251 0.46 0.04 0.023
Porto Alegre (SBPA) 53 211,096 0.46 0.06 0.024
Congonhas (SBSP) 52 530,779 0.43 0.02 0.021
Recife (SBRF) 38 184,673 0.44 0.01 0.015
Cuiabá (SBCY) 38 81,963 0.45 0.05 0.019
Curitiba (SBCT) 38 219,075 0.46 0.03 0.016
Manaus (SBEG) 38 89,475 0.47 0.16 0.022
Santos Dumont (SBRJ) 34 313,519 0.45 0.02 0.014
Belém (SBBE) 34 119,883 0.47 0.08 0.018
Fortaleza (SBFZ) 34 167,800 0.47 0.01 0.014
Ribeirão Preto (SBRP) 24 34,852 0.44 0 0.01
Goiânia (SBGO) 23 91,689 0.44 0.01 0.01
Campo Grande (SBCG) 22 45,563 0.44 0.01 0.01
Pampulha (SBBH) 21 16,838 0.41 0.03 0.012
Natal (SBNT) 21 61,839 0.43 0 0.008
TABLE XVII
Top-20 Brazilian Airports - Number of Connections - National and International Flights.
Figure 9 - Changes on the number of components by the total number of removed airports. For interpretation of the references to color in this figure, the reader is referred to the web version of this article.
removed from the network, only 36% of passengers are allowed to travel abroad. Putting together the Galeão Airport, this number drops to 15%. A similar impact can also be seen on the increase of the number of components in the network.
CONCLUSIONS
In this paper we analyzed the main topological characteristics of the Brazilian air transportation network, based on the set of national and international
flights operated by the Brazilian airports.
The Brazilian network has small world properties and the airport connections follow a power law distribution. Our results showed that the main airports in the Brazilian infrastructure are the Viracopos and Guarulhos airports. Furthermore, travelers need, on average, 3 connection flights to reach their destinations.
We also performed the resiliency analysis of the network robustness under topology changes. We
showed that the Viracopos Airport outage breaks the network into 6 subnetworks, affecting 10% of the passengers.
Some interesting analysis can be performed based on the results discussed in this work. For instance, it is important to know the impact of closing an airport, for a given amount of hours. Furthermore, it is also interesting to have some
insights on how long the transfers are. We can
also analyze the ticket prices across the Brazilian
regions. We plan to address these issues next.
ACKNOWLEDGMENTS
This research was funded by the authors’ individual grants from grants from Conselho Nacional
de Desenvolvimento Científico e Tecnológico
(CNPq), Coordenação de Aperfeiçoamento de Pessoal de Nível Superior (CAPES), Instituto Nacional de Ciência e Tecnologia de Sistemas Micro e Nanoeletrônicos (INCT NAMITEC) and Fundação de Amparo à Pesquisa do estado de Minas Gerais (FAPEMIG).
RESUMO
A rede de transporte aéreo em um país tem um grande impacto na economia local, nacional e global. Neste artigo, analisamos a rede de transporte aéreo no Brasil através de métricas de redes complexas para o melhor entendimento
de suas características. Em nossa análise, definimos redes
compostas por voos nacionais ou internacionais. Também consideramos a rede onde ambos os tipos de voos são reunidos. Conclusões interessantes emergem da nossa análise. Por exemplo, o Aeroporto de Viracopos (cidade de Campinas) é o aeroporto mais central e conectado na rede de voos nacionais. Qualquer problema operacional neste aeroporto separa a rede brasileira em 6 subredes distintas. Mais ainda, a rede de conexão aérea nacional brasileira possui características de mundo pequeno e a rede das conexões nacionais segue uma distribuição de lei de potência. Portanto, nossa análise possibilita compreender a infraestrutura da rede de transporte aéreo
Brasileira, trazendo um novo entendimento para ajudar a
lidar com o rápido crescimento recente do uso da rede de transporte aéreo no Brasil.
Palavras-chave: Rede brasileira de Transporte Aéreo, ciência de redes, análise da estrutura da rede, redes complexas.
REFERENCES
ANAC - AGÊNCIA NACIONAL DE AVIAÇÃO CIVIL. 2013.
Yearbook of Air Transport. Statistical and Economic Data 2012. Brasília, DF, Brazil 1: 7-50.
BAGLER G. 2008. Analysis of the airport network of India as a complex weighted network. Physica A 387(12): 2972-2980.
BASTIAN M, HEYMANN S AND JACOMY M. 2009. Gephi: An open source software for exploring and manipulating networks. In: Proceedings of Internacional AAAI Conference on Weblogs and Social Media 1: 361-362. BLONDEL V, GUILLAUME J, LAMBIOTTE R AND MECH E. 2008.
Fast unfolding of communities in large networks. J Stat Mech 1: 2-11.
BRIN S AND PAGE L. 1998. The anatomy of a large-scale hypertextual web search engine. Comput Netw ISDN Syst 30(1-7): 107-117.
COSTA TF, LOHMANN G AND OLIVEIRA AV. 2010. A model to identify airport hubs and their importance to tourism in Brazil. J Res Trans E 26(1): 3-11.
FORTUNATO S. 2010. Community detection in graphs. Phys Rep 486(3-5): 75-174.
GUIDA M AND MARIA F. 2007. Topology of the Italian airport network: A scale-free small-world network with a fractal structure? Chaos, Solitons & Fractals 31(3): 527-536. GUIMER R, MOSSA S, TURTSCHI A AND AMARAL LAN. 2005.
The worldwide air transportation network: Anomalous centrality, community structure, and cities’ global roles. Proc Natl Acad Sci USA 102(22): 7794-7799.
IÑIGUEZ G, KERTÉSZ J, KASKI KK AND BARRIO RA. 2009.
Opinion and community formation in coevolving networks. Phys Rev E 80: 066119.
LI W AND CAI X. 2004. Statistical analysis of airport network of China. Phys Rev E 69: 04610-046112
NEWMAN MEJ. 2003. The structure and function of complex
networks. SIAM Rev 45(2): 167-256.
NEWMAN MEJ. 2006. Modularity and community structure in
networks. Proc Natl Acad Sci USA 103(23): 8577-8582. OLIVEIRA D, CARVALHO M AND MENEZES R. 2013. Using
network sciences to evaluate the brazilian airline network. In: Du DZ and Zhang G (Eds), Computing and Combinatorics. Lect Notes Comput Sc 7936: 849-858. Springer.
PACHECO R AND FERNANDES E. 2003. Managerial efficiency
of brazilian airports. Transport Res A-Pol 37(8): 667-680. REKA A AND BARABÁSI AL. 2002. Statistical mechanics of