Distributed Parallel Architecture for "Big Data"
Catalin BOJA, Adrian POCOVNICU, Lorena BĂTĂGAN
Department of Economic Informatics and Cybernetics Academy of Economic Studies, Bucharest, Romania
[email protected], [email protected], [email protected]
This paper is an extension to the "Distributed Parallel Architecture for Storing and Pro-cessing Large Datasets" paper presented at the WSEAS SEPADS’12 conference in Cam-bridge. In its original version the paper went over the benefits of using a distributed parallel architecture to store and process large datasets. This paper analyzes the problem of storing, processing and retrieving meaningful insight from petabytes of data. It provides a survey on current distributed and parallel data processing technologies and, based on them, will pro-pose an architecture that can be used to solve the analyzed problem. In this version there is more emphasis put on distributed files systems and the ETL processes involved in a distribut-ed environment.
Keywords: Large Dataset, Distributed, Parallel, Storage, Cluster, Cloud, MapReduce,
Hadoop
Introduction
A look back to the immediate history shows that the data storing capacity is con-tinuously increasing, while the cost per GB stored is decreasing, figure 1. The first hard disk came from IBM in 1956, it was called The IBM 350 Disk Storage and it had a ca-pacity of 5 MB, [10-11]. In 1980, IBM 3380 breaks the gigabyte-capacity limit providing storage for 2.52 GB. After 27 years, Hitachi GST that acquired IBM drive division in 2003, deliver the first terabyte hard drive. Af-ter only two years, in 2009, WesAf-tern Digital launches industry’s first two terabyte hard drive. In 2011, Seagate introduces the world’s first 4TB hard drive, [11].
Fig. 1. Average HDD capacity (based on [13])
In terms of price [12], the cost per gigabyte decreased from an average of 300.000 $ to a merely an average of 11 cents in the last 30
years, figure 2. As a fact, in 1981 you must use 200 Seagate units, each having a five megabytes capacity and costing 1700$, to store one gigabyte of data.
Fig. 2. Average $ cost per GB (based on [13])
0.6 exabytes (EB) in 2011 to 6.3 EB in 2015, [8]. The expansion of data communications has promoted different data services, social, economic or scientific, to central nodes for storing and distributing large amounts of da-ta. For example, Facebook social network hosts more than 140 billion photos, which is more than double compared to 60 billion pic-tures at the end of 2010. In terms of storage, all these snapshots data take up more than 14 petabytes. In other fields, like research, the Large Hadron Collider particle accelerator near Geneva, will produce about 15 petabytes of data per year. The SETI project is record-ing each month around 30 terabytes of data which are processed by over 250.000 com-puters each day, [14]. The supercomputer of the German Climate Computing Center (DKRZ) has a storage capacity of 60 petabytes of climate data. In the financial sector, records of every day financial opera-tions generate huge amounts of data. Solely, the New York Stock Exchange records about one terabyte of trade data per day, [15]. Despite this spectacular evolution of storage capacities and of deposits size, the problem that arises is to be able to process it. This is-sue is generated by available computing power, algorithms complexity and access speeds. This paper makes a survey of differ-ent technologies used to manage and process large data volumes and proposes a distributed and parallel architecture used to acquire, store and process large datasets. The objec-tive of the proposed architecture is to
imple-ment a cluster analysis model.
2 Processing and storing large datasets As professor Anand Rajaraman questioned,
more data usually beats better algorithm
[15]. The question is used to highlight the ef-ficiency of a proposed algorithm for the Net-flix Challenge, [17]. Despite the statement is still debatable, it brings up a true point. A given data mining algorithm yields better re-sults with more data and it can reach the same accuracy of results of a better or more complex algorithm. In the end, the objective of a data analysis and mining system is to process more data with better algorithms, [15].
In many fields more data is important be-cause it provides a more accurate description of the analyzed phenomenon. With more da-ta, data mining algorithms are able to extract a wider group of influence factors and more subtle influences.
Today, large datasets means volumes of hun-dreds of terabytes or petabytes and these are real scenarios. The problem of storing these large datasets is generated by the impossibil-ity to have a drive with that size and more important, by the large amount of time re-quired to access it.
Access speed of large data is affected by the disk speed performances [22], Table 1, inter-nal data transfer, exterinter-nal data transfer, cache memory, access time, rotational latency, that generate delays and bottlenecks.
Table 1. Example of disk drives performance (source [22]) Interface HDD
Spindle [rpm]
Average rotational latency [ms]
Internal transfer [Mbps]
External transfer [MBps]
Cache [MB]
SATA 7,200 11 1030 300 8 – 32
SCSI 10,000 4.7 – 5.3 944 320 8
High-end SCSI 15,000 3.6 – 4.0 1142 320 8 – 16
SAS 10,000 / 15,000 2.9 – 4.4 1142 300 16
Despite the rapid evolution of drives capaci-ty, described in figure 1, the large datasets of up to one petabytes can only be stored on multiple disks. Using 4 TB drives requires
rate of 300 MB/s then the entire dataset is read in 38.5 days. A simple solution is to read from the all disks at once. In this way, the entire dataset is read in only 3.7 hours. If we take into consideration the communica-tion channel, then other bottlenecks are gen-erated by the available bandwidth. In the end, the performance of the solution is reduced to the speed of the slowest component.
Other characteristics of large data sets add supplementary levels of difficulty:
many input sources; in different econom-ic and social fields there are multiple sources of information;
redundancy, as the same data can be pro-vided by different sources;
lack of normalization or data representa-tion standards; data can have different formats, unique IDs, measurement units; different degrees of integrity and
con-sistency; data that describes the same phenomenon can vary in terms of meas-ured characteristics, measuring units, time of the record, methods used.
For limited datasets the efficient data man-agement solution is given by relational SQL databases, [20], but for large datasets some of their founding principles are eroded [3], [20], [21].
3 Proposed Approach
The next solutions provide answers to the question regarding how to store and process large datasets in an efficient manner that can justify the effort.
3.1 Large Data Sets Storage
When accessing large data sets, the storage file system can become a bottle neck. That's why a lot of thought was put into redesigning the traditional file system for better perfor-mance when accessing large files of data.
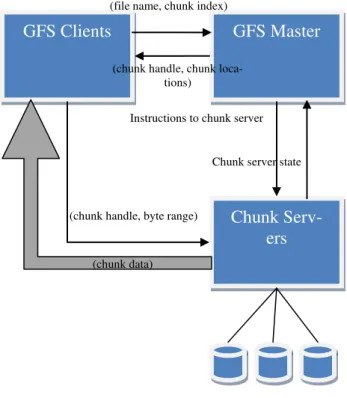
Fig. 3. Simplified GFS Architecture
In a distributed approach, the file system aims to achieve the following goals:
it should be scalable; the file system should allow for additional hardware to be added to increase storing capacity and/or performance.
it should offer high performance; the file system should be able to locate the data of interest on the distributed nodes in a timely manner.
it should reliable; the file system should be able to recreate from the distributed nodes the original data in a complete and undistorted manner.
it should have high availability; the file system should account for failures and incorporate mechanisms for monitoring, error detection, fault tolerance and auto-matic recovery.
Google, one of the biggest search engine ser-vices providers, which handles “big web da-ta” has published a paper about the file sys-tem they claim it's being used by their busi-ness called "The Google File System".
From an architecture point of view the Google File System (GFS) comprises of a "single master", multiple "chunk servers" and it's being accessed by multiple "clients".
GFS Clients GFS Master
Chunk Serv-ers (file name, chunk index)
(chunk handle, chunk loca-tions)
(chunk handle, byte range)
(chunk data)
Instructions to chunk server
In the simplified version of the GFS architec-ture, figure 3 it shows how the GFS clients communicate with the master and with the chunk servers. Basically the clients are ask-ing for a file and the GFS master tells them which chunk servers contain the data for that file. Then the GFS clients make a request for the data at those respective chunk servers. Then GFS chunk servers transmit the data di-rectly to the GFS clients. No user data actual-ly passes the GFS master, this way it avoids having the GFS master as a bottleneck in the data transmission.
Periodically, the GFS master communicates with the chunk servers to get their state and to transmit them instructions.
Each chunk of data is identified by an immu-table and globally unique 64 bit chunk handle assigned by the master at the time of chunk creation [33].
The chunk size is a key differentiator from more common file system. GFS uses 64 MB for a chunk, limiting this way the number or requests to the master for chunk locations, it reduces the network overhead and it reduces the metadata size on the master, allowing the master to store the metadata in memory. Hadoop, a software framework derived from Google's papers about MapReduce and GFS, offers a similar file system, called Hadoop Distributed Files System (HDFS).
What GFS was identifying as "Master" it's being called NameNode in HDFS and the GFS "Chunk Servers" can be found as "Datanodes" in HDFS.
3.2 ETL
The Extract, Transform and Load (ETL) pro-cess provides an intermediary transfor-mations layer between outside sources and the end target database.
In literature [29], [30] we identified ETL and ELT. ETL refers to extract, transform and load in this case activities start with the use of applications to perform data transfor-mations outside of a database on a row-by-row basis, and on the other hand ELT refers to extract, load and transform which implied the use first the relational databases, before performing any transformations of source
da-ta into da-target dada-ta.
The ETL process [32] is base on three ele-ments:
Extract – The process in which the data is read from multiple source systems into a single format. In this process data is ex-tracted from the data source;
Transform – In this step, the source data is transform into a format relevant to the solution. The process transform the data from the various systems and made it consistent;
Load – The transformed data is now writ-ten into the warehouse.
Usually the systems that acquire data are op-timized so that the data is being stored as fast as possible. Most of the time comprehensive analyses require access to multiple sources of data. It’s common that those sources store raw data that yields minimal information un-less properly process.
This is where the ETL or ELT processes come into play. An ETL process will take the data, stored in multiple sources, transform it, so that the metrics and KPIs are readily ac-cessible, and load it in an environment that has been modeled so that the analysis queries are more efficient [23]. An ETL system is part of a bigger architecture that includes at least one Database Management System, DBMS. It is placed upstream from a DBMS because it feeds data directly into the next level.
The ETL tools advantages are [29], [30], [31]:
save time and costs when developing and maintaining data migration tasks;
use for complex processes to extract, transform, and load heterogeneous data into a data warehouse or to perform other data migration tasks;
in larger organizations for different data integration and warehouse projects ac-cumulate;
such processes encompass common sub-processes, shared data sources and tar-gets, and same or similar operations; ETL tools support all common databases,
(sub-)processes due to a collaborative de-velopment platform and provide central scheduling.
Portability: usually the ETL code can be developed one a specific target database and ported later to other supported data-bases.
When developing the ETL process, there are two options: either takes advantage of an ex-isting ETL tool, some key players, in this domain, are: IBM DataStage, Ab Initio, Informatica or custom code it. Both ap-proaches have benefits and pitfalls that need to be carefully considered when selecting what better fits the specific environment. The benefits of an in-house custom built ETL process are:
Flexibility; the custom ETL process can be designed to solve requirements specif-ic to the organization that some of the ETL tools may have limitation with; Performance; the custom ETL process
can be finely tuned for better perfor-mance;
Tool agnostic; the custom ETL process can be built using skills available in-house;
Cost efficient: custom ETL processes usually use resources already available in the organization, eliminating the addi-tional costs with licensing an ETL tool and training the internal resources on us-ing that specific ETL tool.
3.3 MapReduce, Hadoop and HBase
MapReduce (MR) is a programming model and an associated implementation for pro-cessing and generating large data sets, [18]. The model was developed by Jeffrey Dean and Sanjay Ghemawat at Google. The foun-dations of the MapReduce model are defined by a map function used top process key-value pairs and a reduce functions that merges all intermediate values of the same key.
The large data set is split in smaller subsets which are processed in parallel by a large cluster of commodity machines.
Map function [27] takes an input data and produces a set of intermediate subsets. The MapReduce library groups together all
in-termediate subsets associated with the same intermediate key and send them to the Re-duce function.
The Reduce function, also accepts an inter-mediate key and subsets. This function merg-es together thmerg-ese subsets and key to form a possibly smaller set of values. Normally just zero or one output value is produced per Re-duce function.
In [26] is highlight that many real world tasks such used MapReduce model. This model is used for web search service, for sorting and processing the data, for data min-ing, for machine learning and for a big num-ber of other systems.
The entire framework manages how data is split among nodes and how intermediary query results are aggregate.
A general MapReduce architecture can be il-lustrated as Figure 4.
Fig. 4. MapReduce architecture (based on [28])
The MR advantages are [1], [6], [7], [18], [20], [24], [27]:
the model is easy to use, even for pro-grammers without experience with paral-lel and distributed systems;
structure; in fact the architecture can use data that has an arbitrary format;
fault tolerance;
the framework is available from high lev-el programming languages; one such so-lution is the open-source Apache Hadoop project which is implemented in Java; the query language allows record-level
manipulation;
projects as Pig and Hive [34] are provid-ing a rich interface that allows program-mers to do join datasets without repeating simple MapReduce code fragments; Hadoop is a distributed computing platform, which is an open source implementation of the MapReduce framework proposed by Google [28]. It is based on Java and uses the Hadoop Distributed File System (HDFS). HDFS is the primary storage system used by Hadoop applications. It is uses to create mul-tiple replicas of data blocks for reliability, distributing them around the clusters and splitting the task into small blocks. The rela-tionship between Hadoop, HBase and HDFS can be illustrated as Figure 5.
HBase is a distributed database. HBase is an open source project for a database, distribut-ed, versiondistribut-ed, column-orientdistribut-ed, modeled af-ter Google’ Bigtable [25].
Fig. 5. The relationship between Hadoop, HBase and HDFS (based on [28])
Some as the features of HBASE as listed at [25] are:
convenient base classes for backing Hadoop MapReduce jobs with HBase ta-bles including cascading, hive and pig source and sink modules;
query predicate push down via server side scan and get filters;
optimizations for real time queries ; a Thrift gateway and a REST-ful Web
service that supports XML, Protobuf, and binary data encoding options
extensible JRuby based (JIRB) shell; support for exporting metrics via the
Hadoop metrics subsystem to files or Ganglia; or via JMX.
HBase database stores data in labeled tables. In this context [28] the table is designed to have a sparse structure and data is stored in table rows, and each row has a unique key with arbitrary number of columns.
3.4 Parallel database systems
A distributed database (DDB) is a collection of multiple, logically interconnected data-bases distributed over a computer network. A distributed database management system, distributed DBMS, is the software system that permits the management of the distribut-ed database and makes the distribution trans-parent to the users. A parallel DBMS is a DBMS implemented on a multiprocessor computer. [21]. The parallel DBMS imple-ments the concept of horizontal partitioning [24] by distributing parts of a large relational table across multiple nodes to be processed in parallel. This requires a partitioned execution of the SQL operators. Some basic operations, like a simple SELECT, can be executed in-dependently on all the nodes. More complex operations are executed through a multiple-operator pipeline. Different multiprocessor parallel system architectures [21], like share-memory, share-disks or share nothing, define possible strategies to implement a parallel DBMS, each with its own advantages and drawbacks. The share-nothing approach dis-tributes data across independent nodes and has been implemented by many commercial systems as it provides extensibility and avail-ability.
Based on the above definitions, we can con-clude that parallel database systems improve performance of data processing by paralleliz-ing loadparalleliz-ing, indexparalleliz-ing and queryparalleliz-ing data. In distributed database systems, data is stored in HDFS
HBase Hadoop
Input
Input
Input Output
Output
different DBMSs that can function inde-pendently. Because parallel database systems may distribute data to increase the architec-ture performance, there is a fine line that sep-arates the two concepts in real implementa-tions.
Despite the differences between parallel and distributed DBMSs, most of their advantages are common to a simple DBMS, [20],[35]: stored data is conform to a well-defined
schema; this validates the data and pro-vides data integrity;
data is structured in a relational paradigm of rows and columns;
SQL queries are fast;
the SQL query language is flexible, easy to learn and read and allows program-mers to implement complex operations with ease;
use hash or B-tree indexes to speed up access to data;
can efficiently process datasets up to two petabytes of data.
Known commercial parallel databases as Te-radata, Aster Data, Netezza [9], DATAllegro, Vertica, Greenplum, IBM DB2 and Oracle Exadata, have been proven successful be-cause:
allow linear scale-up, [21]; the system can maintain constant performance as the database size is increasing by adding more nodes to the parallel system;
allow linear speed-up, [21]; for a data-base with a constant size, the perfor-mance can be increased by adding more components like processors, memory and disks;
implement inter-query, intra-query and intra-operation parallelism, [21];
reduced implementation effort; reduced administration effort; high availability.
In a massively parallel processing architec-ture (MPP), adding more hardware allows for more storage capacity and increases queries speeds. MPP architecture, implemented as a data warehouse appliance, reduces the im-plementation effort as the hardware and software are preinstalled and tested to work on the appliance, prior to the acquisition. It
also reduces the administration effort as it comes as a single vendor out of the box solu-tion. The data warehouse appliances offer high availability through built-in fail-over capabilities using data redundancy for each disk.
Ideally, each processing unit of the data warehouse appliance should process the same amount of data at any given time. To achieve that, the data should be distributed uniformly across each processing unit. Data skew is a measure to evaluate how data is distributed across each processing unit. A data skew of 0 means that the same number of records is distributed on each processing unit. A data skew of 0 is ideal.
By having each processing unit do the same amount of work it ensures that all processing units finish their task about the same time, minimizing any waiting times.
Another aspect that has an important impact on the query performance is having the all the data that is related on the same pro-cessing unit. This way the time required to transfer data between the processing units is eliminated. For example, if the user requires the sales by country report, having both the sales data for a customer and his geographic information on the same processing unit will ensure that the processing unit has all the in-formation that it needs and each processing unit is able to perform its tasks independent-ly.
The way data is distributed across the parallel database nodes influence the overall perfor-mance. Though the power of the parallel DBMS is given by the number of nodes, this can be also a drawback. For simple queries the actual processing time can be much smaller to the time needed to launch the par-allel operation. Also, nodes can become hot spots or bottle necks as they delay the entire system.
4 Proposed architecture
new ones. The bottom-up approach is more efficient, but more difficult to implement, because it can suggests, based on real eco-nomic data, relations between ecoeco-nomic fac-tors that are specific to the cluster model. The difficulty comes from the large volume of economic data that needs to be analyzed. The architecture, described in figure 6, has three layers:
the input layer implements data acquisi-tion processes; it gets data from different sources, reports, data repositories and ar-chives which are managed by govern-mental and public structures, economic agencies and institutions, NGO projects; some global sources of statistical eco-nomic data are Eurostat, International Monetary Fund and World Bank; the problem of these sources is that they use independent data schemes and bringing them to a common format it is an inten-sive data processing stage taking into consideration national data sources or crawling the Web for free data, the task becomes a very complex one;
the data layer stores and process large da-tasets of economic and financial records; this layer implements distributed, parallel processing;
the user layer provides access to data and manage requests for analysis and reports. The ETL intermediary layer placed between the first two main layers, collects data from the data crawler and harvester component, converts it in a new form and loads it in the parallel DBMS data store. The ETL normal-ize data, transforms it based on a predefined structure and discards not needed or incon-sistent information.
The ETL layer inserts data in the parallel dis-tributed DBMS that implements the Hadoop and MapReduce framework. The objective of the layer is to normalize data and bring it to a common format, requested by the parallel DBMS.
Using an ETL process, data collected by the data crawler & harvester gets consolidated, transformed and loaded into the parallel DBMS, using a data model optimized for da-ta retrieval and analysis.
It is important that the ETL server also sup-ports parallel processing allowing it to trans-form large data sets in timely manner. ETL tools like Ab Initio, DataStage and Informatica have this capability built in. If the ETL server does not support parallel pro-cessing, then it should just define the trans-formations and push the processing to the target parallel DBMS.
Fig. 6. Proposed architecture
The user will submit his inquiries through a front end application server, which will con-vert them into queries and submit them to the parallel DBMS for processing.
intensive and to link them by ETL services that will act as data buffers or cache zones. Also the ETL will support the transformation effort.
For the end user the architecture is complete-ly transparent. All he will experience is the look and feel of the front end application. Based on extensive comparisons between MR and parallel DBMS, [6], [20], [24], we conclude that there is no all-scenarios good solution for large scale data analysis because: both solutions can be used for the same
processing task; you can implement any parallel processing task based either on a combinations of queries or a set of MR jobs;
the two approaches are complementary; each solution gives better performance over the other one in particular data sce-narios; you must decide with approach saves time for the needed data processing task;
the process of configuring and loading da-ta into the parallel DBMS is more com-plex and time consuming than the setting up of the MR architecture; one reason is that the DBMS requires complex schemas to describe data, whereas MR can process data in arbitrary format;
the performance of the parallel DBMS is given by system fine tune level; the sys-tem must be configured accordingly to the tasks needed to complete and to the avail-able resources;
common MR implementations take full advantage of the reduced complexity by processing data with simple structure, be-cause the entire MR model is built on the key-value pair format; a MR system can be used to process more complex data, but the input data structure must be integrated in a custom parser in order to obtain ap-propriate semantics; not relaying on a common recognized data structure has an-other drawback as data is not validated by default by the system; this can conduct to situations in which modified data violates integrity or other constraints; in contrast, the SQL query language used by any par-allel DBMS, takes full advantage of the
data schema in order to obtain a full de-scription of the data; the same schema is used to validate data;
DBMSs use B-trees indexes to achieve fast searching times; indexes can be de-fined on any attributes are managed by the system; MR framework does not ment this built-in facility and an imple-mentation of a similar functionality is done by the programmers who control the data fetching mechanism;
DBMSs provide high level querying lan-guages, like SQL, which are ease to read and write; instead the MR use code frag-ments, seen as algorithms, to process rec-ords; projects as Pig and Hive [34] are providing a rich interface based on high– level programming languages that allows programmers to reuse code fragments. parallel DBMSs have been proved to be
more efficient in terms of speed but they are more vulnerable to node failures. A decision which approach to take must be made taking into consideration:
performance criteria;
internal structure of processed data; available hardware infrastructure; maintenance and software costs.
A combined MR-parallel DBMS solution, [36] can be a possibility as it benefits from each approach advantages.
5 Conclusion
Processing large datasets obtained from mul-tiple sources is a daunting task as it requires tremendous storing and processing capaci-ties. Also, processing and analyzing large volumes of data becomes non-feasible using a traditional serial approach. Distributing the data across multiple processing units and parallel processing unit yields linear im-proved processing speeds.
experi-ence is transparent. Despite the number of layers that are behind the scenes, all that it is exposed to him is a user friendly interface supplied by the front end application server. In the end, once the storing and processing issues are solved, the real problem is to search for relationships between different types of data [3]. Others has done it very successfully, like Google in Web searching or Amazon in e-commerce.
Acknowledgment
This work was supported from the European Social Fund through Sectored Operational Programmer Human Resources Development
2007-2013, project number POSDRU/89/1.5/S/59184, “Performance and
excellence in postdoctoral research in Roma-nian economics science domain”.
References
[1] T. White, Hadoop: The Definitive Guide, O’Reilly, 2009
[2] G. Bruce Berriman, S. L. Groom, “How Will Astronomy Archives Survive the Data Tsunami?,” ACM Queue, Vol. 9
No. 10, 2011, http://queue.acm.org/detail.cfm?id=2047
483
[3] P. Helland, “If You Have Too Much Da-ta, then “Good Enough” Is Good Enough,” Vol. 9 No. 5, ACM Queue, 2011
[4] Apache Hadoop,
http://en.wikipedia.org/wiki/Hadoop [5] Apache Software Foundation, Apache
Hadoop,
http://wiki.apache.org/hadoop/FrontPage [6] J. Dean, S. Ghemawat, “MapReduce: A
Flexible Data Processing Tool,” Com-munications of the ACM, vol. 53, no. 1,
2010
[7] M. C. Chu-Carroll, Databases are ham-mers; MapReduce is a screwdriver,
Good Math, Bad Math, 2008,
http://scienceblogs.com/goodmath/ 2008/01/databases_are_hammers_mapre duc.php
[8] Cisco, Cisco Visual Networking Index: Global Mobile Data Traffic Forecast
Update, 2010–2015, http://www.cisco.com/en/US/solutions/c ollateral/ns341/ns525/ns537/ns705/ns82 7/white_paper_c11-520862.html
[9] D. Henschen, “New York Stock Ex-change Ticks on Data Warehouse Appli-ances,” InformationWeek, 2008,
http://www.informationweek.com/news/ software/bi/207800705
[10]IBM, IBM 350 disk storage unit,
http://www-03.ibm.com/ibm/history/exhibits/storage /storage_profile.html
[11]Wikipedia, History of IBM magnetic
disk drives, http://en.wikipedia.org/wiki/History_of_
IBM_magnetic_disk_drives
[12]Wikipedia, History of hard disk drives, http://en.wikipedia.org/wiki/History_of_ hard_disks
[13]I. Smith, Cost of Hard Drive Storage Space,
http://ns1758.ca/winch/winchest.html
[14]Seti@home, SETI project,
http://setiathome.berkeley.edu/
[15] A. Rajaraman, More data usually beats better algorithms, part I and part II,
2008,
http://anand.typepad.com/datawocky/20 08/03/more-data-usual.html
[16]J. Good, How many photos have ever
been taken?, Sep 2011,
http://1000memories.com/blog/
[17]J. Bennett, S. Lanning, “The Netflix Prize,” Proceedings of KDD Cup and Workshop 2007, San Jose, California, 2007
[18]J. Dean, S. Ghemawat, “MapReduce: simplified data processing on large clus-ters,” Commun. ACM, Vol. 51, No. 1,
pp. 107–113, 2008.
[19]S. Messenger, Meet the world's most powerful weather supercomputer, 2009,
http://www.treehugger.com/clean- technology/meet-the-worlds-most-powerful-weather-supercomputer.html [20]A. Pavlo, E. Paulson, A. Rasin, D.J.
Proceedings of the 2009 ACM SIGMOD International Conference, 2009.
[21]M. Tamer Özsu, P. Valduriez, “Distrib-uted and Parallel Database System,”
ACM Computing Surveys, vol. 28, 1996, pp. 125 – 128
[22]Seagate, Performance Considerations,
http://www.seagate.com/www/en-us/support/before_you_buy/speed_consi derations
[23]P. Vassiliadis, “A Survey of Extract-Transform-Load Technology,” Interna-tional Journal of Data Warehousing & Mining, Vol. 5, No. 3, pp. 1-27, 2009
[24]M. Stonebreaker et al., “MapReduce and Parallel DBMSs: Friends or Foes,”
Communications of the ACM
53(1):64--71 2010.
[25]Apache HBASE,
http://hbase.apache.org/
[26]H. Yang, A. Dasdan, R. Hsiao, D. Par-ker, “Map-reduce-merge: simplified re-lational data processing on large clus-ters,” Rain (2007), Publisher: ACM, Pages: 1029-1040 ISBN: 781595936868 ,
http://www.mendeley.com/research/map reducemergesimplified-relational-data-processing-on-large-clusters/
[27]J. Dean, S. Ghemawat, “MapReduce: Simplified Data Processing on Large Clusters,” USENIX Association OSDI ’04: 6th Symposium on Operating Sys-tems Design and Implementation,
http://static.usenix.org/event/osdi04/tech /full_papers/dean/dean.pdf
[28]X. Yu, “Estimating Language Models Using Hadoop and Hbase,” Master of Science Artificial Intelligence,
Universi-ty of Edinburgh, 2008,
http://homepages.inf.ed.ac.uk/miles/msc-projects/yu.pdf
[29]ETL Architecture Guide
http://www.ipcdesigns.com/etl_metadata /ETL_Architecture_Guide.html
[30] W. Dumey, A Generalized Lesson in ETL Architecture Durable Impact
Con-sulting, Inc., June 11, 2007, Available
online at:
http://www.scribd.com/doc/55883818/A
-Generalized-Lesson-in-ETL-Architecture
[31] A. Albrecht, METL: Managing and Inte-grating ETL Processes, VLDB ‘09,
Au-gust 2428, 2009, Lyon, France Copy-right 2009 VLDB Endowment, ACM, http://www.vldb.org/pvldb/2/vldb09-1051.pdf
[32]R. Davenport, ETL vs ELT, June 2008, Insource IT Consultancy, Insource Data Academy,
http://www.dataacademy.com/files/ETL-vs-ELT-White-Paper.pdf
[33]S. Ghemawat, H. Gobioff and Shun-Tak Leung (GOOGLE) - The Google File System,
http://www.cs.brown.edu/courses/cs295-11/2006/gfs.pdf
[34]C. Olston, B. Reed, U. Srivastava, R. Kumar and A. Tomkins, “Pig Latin: A Not-So-Foreign Language for Data Pro-cessing,” In SIGMOD ’08, pp. 1099– 1110, 2008.
[35]S. Pukdesree, V. Lacharoj and P. Sirisang, “Performance Evaluation of Distributed Database on PC Cluster Computers,” WSEAS Transactions on Computers, Issue 1, Vol. 10, January
2011, pp. 21 – 30, ISSN 1109-2750. [36]A. Abouzeid, K. Bajda-Pawlikowski,
D.J. Abadi, A. Silberschatz and A. Rasin, “HadoopDB: An architectural hy-brid of MapReduce and DBMS technol-ogies for analytical workloads,” In Pro-ceedings of the Conference on Very Large Databases, 2009.
Catalin BOJA is Lecturer at the Economic Informatics Department at the Academy of Economic Studies in Bucharest, Romania. In June 2004 he has graduated the Faculty of Cybernetics, Statistics and Economic Informatics at the Academy of Economic Studies in Bucharest. In March 2006 he has grad-uated the Informatics Project Management Master program organized by the Academy of Economic Studies of Bucharest. He is a team member in various undergoing university research projects where he applied most of his project management knowledge. Also he has received a type D IPMA certification in project man-agement from Romanian Project Manman-agement Association which is partner of the IPMA or-ganization. He is the author of more than 40 journal articles and scientific presentations at conferences. His work focuses on the analysis of data structures, assembler and high level programming languages. He is currently holding a PhD degree on software optimization and on improvement of software applications performance.
Adrian POCOVNICU is a PhD Candidate at Academy of Economic Stud-ies. His main research areas are: Multimedia Databases, Information Retriev-al, Multimedia Compression Algorithms and Data Integration. He is a Data Integration Consultant for ISA Consulting, USA.
![Fig. 1. Average HDD capacity (based on [13])](https://thumb-eu.123doks.com/thumbv2/123dok_br/18181383.331174/1.893.439.771.631.814/fig-average-hdd-capacity-based.webp)
![Table 1. Example of disk drives performance (source [22])](https://thumb-eu.123doks.com/thumbv2/123dok_br/18181383.331174/2.893.186.745.872.1058/table-example-disk-drives-performance-source.webp)
![Fig. 4. MapReduce architecture (based on [28])](https://thumb-eu.123doks.com/thumbv2/123dok_br/18181383.331174/5.893.492.700.564.892/fig-mapreduce-architecture-based.webp)
![Fig. 5. The relationship between Hadoop, HBase and HDFS (based on [28]) Some as the features of HBASE as listed at [25] are:](https://thumb-eu.123doks.com/thumbv2/123dok_br/18181383.331174/6.893.137.457.737.985/relationship-hadoop-hbase-hdfs-based-features-hbase-listed.webp)

