Universidade Nova de Lisboa Faculdade de Ciências e Tecnologia
Departamento de Informática
A Debugging Engine for
Parallel and Distributed
Programs
João Manuel dos Santos Lourenço
Dissertação apresentada para a obtenção do Grau de Doutor em Informática pela Universidade Nova de Lisboa, Faculdade de Ciências e Tecnologia.
Acknowledgements
I would like to express my gratitude to all those that, directly or indirectly, have con-tributed to make this thesis possible.
First and foremost, to my supervisor, José Cardoso e Cunha, to whom I’m in debt for the necessary guidance on my research work and, at the same time, for providing me with the desired freedom to pursue my own path. He was also the local task le-ader for the research projects which motivated this research work, and I owe him for including me in his working team. The chance I was given to participate in the project meetings and to know and discuss my work with other researchers were invaluable contributions to the maturity of my research.
To Vítor Duarte, who was my closest research companion, and has always been a kind friend, ready to attend me in is office room, no matter the reason was research, teaching, systems administration or a light chat.
To Pedro Medeiros and Paulo Lopes, who have volunteered to fulfill some of my teaching duties, providing me with some extra time to write this dissertation. Pedro also shares the office room with me, and he contributes to our informal, friendly and respectful working environment.
to Cecília Gomes, who kindly made a review of a draft of this dissertation; and to Jorge Custódio for the friendly companionship.
To all my colleagues at Departamento de Informática of FCT/UNL, for their contri-bution to make every working day a pleasant journey.
To those that worked with me in the development and validation ofFiddle, namely Ricardo Anastácio, Pedro Augusto and Vítor Moreira, when students at Universidade Nova de Lisboa; and Denise Stringini and Mairo Pedrini, from Universidade Federal do Rio Grande do Sul, Brazil. Mairo deserves a special reference, for his courage in “digging” into the source code of Fiddle and his wiseness in correcting some of the remaining known bugs.
Summary
In the last decade a considerable amount of research work has focused on distributed debugging, one of the crucial fields in the parallel software development cycle. The productivity of the software development process strongly depends on the adequate definition of what debugging tools should be provided, and what debugging method-ologies and functionalities should these tools support.
The work described in this dissertation was initiated in 1995, in the context of two research projects, the SEPP (Software Engineering for Parallel Processing) and HPCTI (High-Performance Computing Tools for Industry), both sponsored by the European Union in the Copernicus programme, which aimed at the design and implementation of an integrated parallel software development environment. In the context of these projects, two independent toolsets have been developed, the GRADE and EDPEPPS parallel software development environments.
Our contribution to these projects was in the debugging support. We have de-signed a debugging engine and developed a prototype, which was integrated the both toolsets (it was the only tool developed in the context of the SEPP and HPCTI projects which achieved such a result). Even after the closing of those research projects, further research work on distributed debugger has been carried on, which conducted to the re-design and re-implementation of the debugging engine.
Sumário
Na última década uma quantidade considerável de trabalhos de investigação focaram a sua atenção na depuração distribuída, um dos tópicos cruciais no ciclo de desenvolvi-mento de programas paralelos. A produtividade do processo de desenvolvidesenvolvi-mento de software depende fortemente da definição adequada das ferramentas de depuração que deverão ser disponibilizadas, e de quais as funcionalidades e metodologias de depuração que deverão ser suportadas por essas ferramentas.
O trabalho descrito nesta dissertação for iniciado em 1995, no contexto de dois pro-jectos de investigação, SEPP (Software Engineering for Parallel Processing) e HPCTI (High-Performance Computing Tools for Industry), ambos patrocinados pela União Europeia no contexto do programa Copernicus, e que visavam o desenvolvimento de um ambiente integrado de desenvolvimento de aplicações paralelas. No contexto destes projectos, foram desenvolvidos dois ambientes disjuntos de desenvolvimento de aplicações paralelas e distribuídas, oGRADEe oEDPEPPS.
A nossa contribuição para estes projectos concentrou-se no suporte à depuração. Desenhámos e implementámos um protótipo de um depurador paralelo, que foi inte-grado em ambos os ambientes de desenvolvimento de aplicações paralelas (foi a única ferramenta desenvolvida no contexto daqueles projectos a fazê-lo). Mesmo depois do término daqueles projectos, a investigação em depuração distribuída continuou, con-duzindo ao redesenho e re-implementação do depurador distribuído.
Sommaire
Dans la dernière décade, une quantité considérable de travaux de recherche se sont focalisés sur le débogage distribué, un des principaux aspects du cycle de développe-ment de programmes parallèles. La produtivité du procès de développedéveloppe-ment de logi-ciel dépend beaucoup de la définition correcte des outils de débogage qui devront être disponibles. Il faut aussi définir les capacités et les méthodologies qui devront être soutenues par ces outils.
Le travail décrit dans cette thèse a été commencé en 1995, dans le contexte des deux projets de recherche, SEPP (Software Engineering for Parallel Processing) et HPCTI (High-Performance Computing Tools for Industry), avec l’appui de l’Union Eu-ropéenne, dans le contexte du programme Copernicus, et qui cherchaient à développer un environnement intégré de développement d’applications parallèles. Dans le con-texte de ces projets-là, on a développé deux différents environnements de développe-ment d’applications paralèlles distribuées, leGRADEet leEDPEPPS.
Notre apport pour ces projets s’est centré sur le support du débogage. On a dessiné et on a mis en oeuvre un prototype d’un débogueur parallèle, qui a été intégré dans les deux environnements de développement d’applications parallèles (c’était le seul outil développé dans le contexte de ceux projets-là à faire ça). Même après la fin des projets, la recherche sur le débogage distribué ne s’est pas arrêtée, conduisant à une nouvelle mise en oeuvre de l’épurateur distribué.
Contents
1 Introduction 1
1.1 Introduction . . . 2
1.2 Motivation . . . 5
1.3 Contributions of this Thesis . . . 7
1.4 Outline of the Dissertation . . . 9
2 Debugging of Parallel and Distributed Programs 11 2.1 Basic Concepts . . . 12
2.1.1 The Program Specification and Behavior . . . 13
2.1.2 Program Correctness . . . 14
2.2 Distributed Computations . . . 19
2.2.1 Observation of Global States . . . 22
2.2.2 Detection of Global Predicates . . . 23
2.3 Distributed Debugging Methodologies . . . 24
2.3.1 Interactive Debugging of Remote Processes . . . 24
2.3.2 Trace, Replay and Debugging . . . 25
2.3.3 Integrated Testing, Active Control and Debugging . . . 25
2.3.4 Automated Detection of Global Predicates . . . 26
2.3.5 Distributed Debugging Based on Static Analysis . . . 26
2.3.6 Distributed Debugging Based on Dynamic Analysis . . . 27
2.3.7 Distributed Debugging Based onPostmortemAnalysis . . . 27
3 Fiddle: a Distributed Debugging Engine 29 3.1 Introduction . . . 30
3.2 Techniques for Distributed Debugging . . . 30
3.2.1 Sequential Debugging Techniques . . . 31
3.2.2 Distributed Debugging Techniques . . . 31
3.2.3 Tool Integration Issues . . . 32
3.3 A Proposal for a Distributed Debugging System . . . 33
CONTENTS
3.4.1 The Target Program and Processes . . . 36
3.4.2 The Client Tools . . . 36
3.4.3 The Debugging Engine Core . . . 37
3.4.4 The Debugging Engine API . . . 39
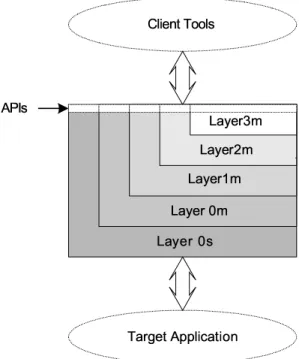
3.5 The Architecture of the Debugging Engine . . . 42
3.5.1 Layer0s . . . 42
3.5.2 Layer0m . . . 43
3.5.3 Layer1m . . . 44
3.5.4 Layer2m . . . 45
3.5.5 Layer3m . . . 46
3.6 Extending the Debugging Engine . . . 47
3.6.1 Internal extensibility . . . 47
3.6.2 External Extensibility . . . 48
3.6.3 Cooperation and Integration Ability . . . 49
3.7 Summary . . . 50
4 The Fiddle Architecture and Implementation 51 4.1 Introduction . . . 52
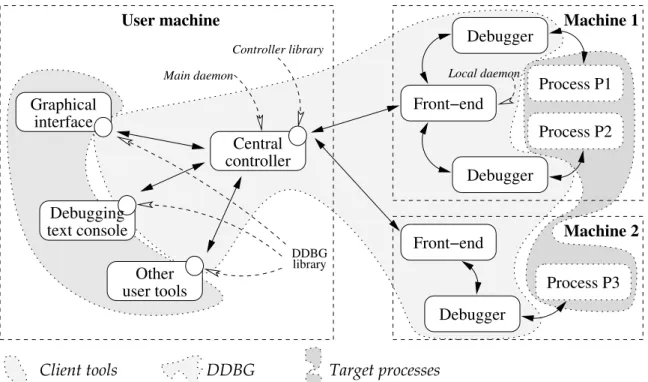
4.2 The DDBG Distributed Debugger . . . 52
4.2.1 The DDBG Architecture . . . 53
4.2.2 Evaluation of DDBG . . . 54
4.3 The Fiddle Debugging Engine . . . 55
4.3.1 Fiddle Software Architecture . . . 55
4.3.2 Internal Communication in Fiddle . . . 64
4.4 Summary . . . 72
5 Validation of the Debugging Engine 75 5.1 Introduction . . . 76
5.2 Internal Validation . . . 77
5.2.1 Functional and Operational Dependencies Between Layers . . . . 77
5.2.2 Fiddle_J: A Java Object Oriented Wrapper for Fiddle Libraries . . 78
5.3 Debugging Consoles . . . 79
5.4 Fiddle Graphical User Interfaces . . . 80
5.4.1 Fiddle Graphical Interface (FGI) . . . 81
5.4.2 PArallel Debugger Interface (PADI) . . . 84
5.5 Composition of Testing and Debugging Tools . . . 85
5.5.1 Deterministic Execution and Interactive Program Analysis (DEIPA) 87 5.6 Integration in Software Development Environments . . . 89
5.6.1 Integration of DDBG in GRADE . . . 90
5.6.2 Integration of DDBG in EDPEPPS . . . 92
CONTENTS
5.7 Integration with a Visualizer . . . 97
5.8 Summary . . . 98
6 Conclusions and Future Work 101 6.1 Conclusions . . . 102
6.2 Future Work . . . 102
A TheFiddleAPI 105 A.1 Fiddle Utilities Library . . . 106
A.1.1 Double Linked List (chain_t ) . . . 106
A.1.2 Warning or Fatal Error Message Display . . . 110
A.2 FiddleLayer0sServices . . . 110
A.2.1 Basic Data Types . . . 110
A.2.2 Management Services . . . 115
A.2.3 Process Control Services . . . 116
A.2.4 Process Inspection Services . . . 118
A.2.5 Thread-related Services . . . 119
A.2.6 Miscellaneous Services . . . 120
A.3 FiddleLayer0mServices . . . 120
A.3.1 Management Services . . . 120
A.3.2 Process Control Services . . . 121
A.3.3 Process Inspection Services . . . 122
A.3.4 Thread-related Services . . . 123
A.3.5 Miscellaneous Services . . . 123
A.4 FiddleLayer1mServices . . . 123
A.4.1 Management Services . . . 123
A.4.2 Process Control Services . . . 124
A.4.3 Process Inspection Services . . . 125
A.4.4 Thread-related Services . . . 126
A.4.5 Miscellaneous Services . . . 126
A.5 FiddleLayer2mServices . . . 126
A.5.1 Management Services . . . 126
A.5.2 Process Control Services . . . 127
A.5.3 Process Inspection Services . . . 128
A.5.4 Thread-related Services . . . 129
CONTENTS
List of Figures
1.1 State vs. temporal perspective of a distributed program . . . 6
2.1 Definition of “bug” . . . 16
2.2 Specification and programming bugs . . . 17
2.3 Process-time diagram with consistent and inconsistent cuts . . . 20
2.4 distributed debugging methodologies . . . 24
2.5 distributed debugging methodologies . . . 27
3.1 The debugging engine logical organization . . . 35
3.2 The debugging engine layered architecture . . . 37
3.3 The debugging engine logical layers . . . 39
3.4 TheLayer0ssoftware architecture . . . 43
3.5 TheLayer0msoftware architecture . . . 44
3.6 TheLayer1msoftware architecture . . . 44
3.7 TheLayer2msoftware architecture . . . 45
3.8 Internal extensibility of the debugging engine . . . 48
3.9 External extensibility of the debugging engine . . . 48
3.10 Cooperation ability of the debugging engine . . . 49
3.11 Integration ability of the debugging engine . . . 49
4.1 TheDDBGsoftware architecture . . . 53
4.2 TheLayer0ssoftware architecture . . . 56
4.3 TheLayer0sinternal data flow and processing . . . 56
4.4 TheLayer0msoftware architecture . . . 57
4.5 TheLayer0minternal data flow and processing . . . 58
4.6 TheLayer1msoftware architecture . . . 59
4.7 TheServer0minternal data flow and processing . . . 59
4.8 TheLayer1minternal data flow and processing . . . 60
4.9 TheLayer2msoftware architecture . . . 62
4.10 TheServer1minternal data flow and processing . . . 62
LIST OFFIGURES
4.12 Thetkinstructure . . . 65
4.13 Thetkoutstructure . . . 66
4.14 Thetkinstructure . . . 68
4.15 Thetkoutstructure . . . 68
4.16 Serialization oftkoutinto JML and XML formats . . . 70
4.17 Codification from JML and XML formats into binarytkout . . . 70
4.18 Processing times for XML file . . . 71
4.19 Sofwtare metrics forFiddle . . . 73
5.1 A debugging engine as the center of a testing and debugging environment 77 5.2 Java object oriented wrapper forFiddlelibraries (Fiddle_J) . . . 78
5.3 TwoFiddle(Layer2m) consoles operating upon the same target process . . 79
5.4 The interaction between the debugging consoles andFiddle . . . 80
5.5 FiddleGraphical Interface (FGI) . . . 81
5.6 FGIsupport for debuggingPVMprograms . . . 83
5.7 PArallel Debugger Interface (PADI) . . . 85
5.8 Relationship betweenPADIandFiddle. . . 86
5.9 Tool composition ofSTEPSandFiddleusingDEIPA . . . 87
5.10 SamplePVMprograms andTeSSfile . . . 88
5.11 The integration ofDDBGwithinGRADE . . . 91
5.12 Support of long time running debugging services inGRED . . . 92
List of Tables
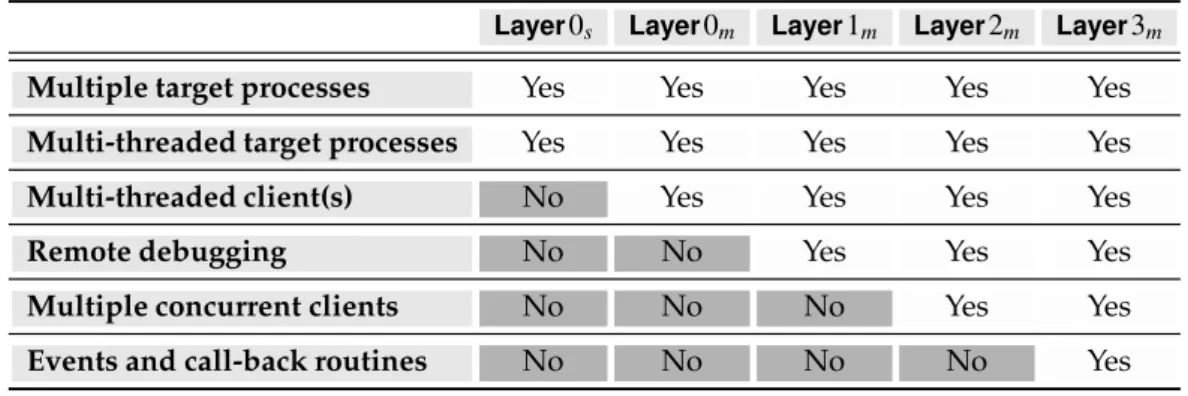
3.1 The debugging engine internal layers and their functionalities . . . 38 3.2 The debugging engine API . . . 41
LIST OFTABLES
1
Introduction
Contents
1.1 Introduction . . . 2
1.2 Motivation . . . 5
1.3 Contributions of this Thesis . . . 7
1.4 Outline of the Dissertation . . . 9
1. INTRODUCTION 1.1. Introduction
1.1
Introduction
There is a long and hard way to go, since someone realises that there is a problem which could be solved with the aid of a computer, until the moment the computer is contributing towards such goal. One of the most important steps in such a path is the design and development of a computer program which will correctly meet the
requirements of the problem to be solved.
Developing a computer program is, indubitably, a complex task. There is the need to analyse the application requirements and to produce a valid model which describes a solution. Such model will then be carefully specified in a programming language and refined successively until its description fits the machine language of a specific com-puter architecture. Once such stage is reached, the specification (comcom-puter program) will be executed by the computer.
If there were no mistakes in any of the software development stages, the computer program will, supposedly, be correct and will implement a solution for the initial prob-lem. However, experience shows that, frequently, there were mistakes or misconcep-tions at some of the stages. Such mistakes or misconcepmisconcep-tions will not only compromise some of the activities at that specific stage but also in the following ones. The final pro-gram will then be an inadequate, incomplete, and/or erroneous solution to the initial problem.
Defining program correctness isn’t an easy task. Like beauty, program correctness strongly depends on the eye of the beholder. A program may be correct from the point of view of the implementer if it satisfies all the previously defined requirements, but may be incorrect from the client perspective if the requirements were incomplete or incorrectly defined. To minimize the risk of building useless computer programs, a software development methodology should be followed [Roy70]. Even when such a software development methodology is carefully followed, there may be discrepancies between the theoretically correct value or behavior and the computed or observed be-havior. In such cases the program is said to contain an error (or a set of errors).
The final aim is, ideally, to generate bug free programs at the first try. However, often this is not the case and, thus, a careful testing of the individual program compo-nents (unit testing) and of the full program (program testing) is mandatory. Whenever an unexpected behavior is observed, additional verifications are required to determine if, although unexpected, the observed behavior is or isn’t acceptable. In the latter, a de-bugging methodology should then be followed to diagnose and correct the undesired behavior.
A computer program may present different kinds of malfunctions, or even not to operate at all, due to program errors. According to their nature, such errors may be classified in the following categories:
1. INTRODUCTION 1.1. Introduction
an ambiguous or incomplete definition of the requirements of the proposed solu-tion;
b) Algorithmic errorsresult from the application of an inadequate algorithm to
imple-ment the devised specification;
c) Logical errorsresult from the inadequate comprehension of the algorithm and lead to
a faulty implementation, which may cause the program to fail intermittently due to a conjunction of factors, or to fail permanently, by not implementing the algorithm at all;
d) Coding errors result from an inadequate understanding of the programming
lan-guage being used or from mistakes when writing the source code. Unpredictable behavior due to unpredicted input, wrong array indexing and use of uninitialized variables are examples of such errors;
e) Architectural errorsare those due to the underlying system layers, such as the
oper-ating system or message passing libraries, typically out of the control of the appli-cation software developers.
Many of the above errors could be avoided or, at least, minimized, if a formal spec-ification language could be used to specify the desired program behavior and, later, have its behavior observed and automatically matched against that specification. Re-search has been conducted towards such goals [Jac02, Abr96, Spi95, Cho78] but is usu-ally limited to small examples, and some authors argue that writing such formal de-scriptions for larger programs is impracticable [Fet88].
Some coding errors, such as lexical and syntactical errors, may be efficiently de-tected by a compiler-based static analysis of the source code and reported to the soft-ware developer as a compiler fatal-error, forcing its immediate elimination. Even other non-trivial errors, such as the potential usage of uninitialized variables may be de-tected by static analysis and reported to the software developer as a compiler warning (non-fatal error).
Just a subset of the coding errors are commonly detected at compile-time. All the others rely on the software developer perception to detect any misbehaviors, to analyse the program source code and to devise a possible correction.
The term debugging is usually associated with the process of locating, diagnosing and correcting errors of the logical and coding classes which are only detectable during program execution.
Non-intrusive debugging is based on the static analysis of the source code and on
1. INTRODUCTION 1.1. Introduction
about the error and to devise a correction. This approach, however, strongly depends on the cause of the error and on the software developer skills for such analysis and, frequently, the nature of the error can’t be found this way.
Intrusive debugging modifies the program behavior by changing the program itself
or, at least, by controlling its execution, and can only be used in reproducible errors, when subsequent runs of the program behave identically wrong. Changing the pro-gram itself, by adding a few memory dump commands (e.g., printing variable values) is, by far, the most common approach for program debugging. Even if acceptable for very simple programs, such an approach is of very limited effectiveness for larger and more complex programs. The most effective approach to intrusive debugging is based in the usage ofdebuggers.
Debugger(n.)
A program for locating operational errors in another program. The debugger usu-ally enables the developer to step through the malfunctioning portion of the pro-gram to examine data and check operational conditions.
Inhttp://docs.sun.com/db/doc/805-4368/6j450e60d
Debuggers depend on the computer hardware, operating system and also on the programming language. This last dependency is more relevant if the debugger sup-portssource-level debugging, i.e., allow the software developer to use the source code as
the basic reference for debugging instead of the target machine code.
For a given set of input data, sequential programs are typically deterministic and their errors are reproducible. Such characteristics make them the perfect targets for controlled execution by a debugger, single stepping over the sequence of machine in-structions (or source-lines, in case of a source-level debugger) and examining process core memory (including variable values) whenever needed. Although there is always space for innovation, the techniques and technologies behind the debugging of sequen-tial programs are quite stable and of widespread use nowadays.
Concurrent programs are intrinsically non-deterministic and repeated executions of the same program with the same input data may originate different behaviors. As such, their controlled execution by a debugger may pose an unacceptable degree of intrusion and hide/mask an error. The simple act of observing the execution of a concurrent program is another source of intrusion, which may have serious implications on a non-deterministic program behavior.
1. INTRODUCTION 1.2. Motivation
obtained in such a way is outdated and may even be inconsistent, precluding reason-ing about the program behavior. To avoid such situations, special concerns must be considered to ensure that all the reasoning about the program state is based on valid (consistent) global states.
Global states are built based on observations of the execution of program compo-nents. What should be observed and how, depends on the abstraction level and the programming model being used. Different abstraction levels may be considered, and the debugging activity may focus in individual processes or their interactions. For example, one may be interested in knowing the state of the communication channels at a certain point or in a temporal perspective reporting the processes and messages associated with those channels in specific time intervals.
Typically, although not always, one would like to observe the program state at the same abstraction level as the one used for the program development. For example, if the used programming language allowed the software developer to ignore the proces-sor registers level, normally it should also be ignored during debugging. However this is not always true, and the debugger should provide the means to deal with the mul-tiple abstraction-levels associated with the program and its execution environment, giving the software developer the freedom to chose, at any point, which ones should be considered and which ones should be left out.
A distributed program is a collection of sequential processes which interact among themselves. As such, debugging a distributed programs encompasses all the difficul-ties of debugging sequential programs and, additionally, many new ones, such as the need to deal with multiple flows of control (multiple threads and/or processes), pro-cess interactions, non-determinism, additional failure sources, multiple programming models and abstractions, and the lack of production quality software development en-vironments with specific support for concurrency, parallelism and/or distribution.
Although there are a few commercial distributed debuggers [Etn00, Mos88], dis-tributed debugging is still a fruitful research topic with much ongoing work in dif-ferent points of the globe. The international conferences specifically dedicated to the topic of (distributed) debugging, such as the past ACM/ONR Workshops on Paral-lel and Distributed Debugging (1989 [acm89], 1991 [acm91] and 1993 [acm93]) and the International Workshops on Automated Debugging (1993 [Fri93], 1995 [Duc95], 1997 [Duc97], 2000 [Duc01] and 2003 [RB03]), are rich information resources about the ongoing research on this field and confirm its relevance as a specialized research topic.
1.2
Motivation
The usage of symbolic debuggers to help in the location and identification of program errors is a major step over moread-hocmethodologies, such as inserting variable
1. INTRODUCTION 1.2. Motivation
browsing the (potentially) large amount of output produced by those print statements. Symbolic debuggers for sequential programs are, essentially, state based. This means they support a debugging methodology based on stopping the program execution at specific points and examining its computation state (variables, stack, registers, etc).
Program development for distributed systems has motivated the redesign of some programming languages and models, and the development of new ones. Understand-ing distributed computations in both state and temporal perspectives (see Figure 1.1) involves a set of new difficulties, such as non-determinism, lack of global components (memory, clock, etc.), multiple execution flows, and variable communication delays. As debuggers are expected to help the software developer understanding the program behavior, distributed debuggers should help the developer to cope with such new dif-ficulties. ✁✂✄☎✆✝ ✞ ✄✁✆✟✄✁✠ ✡☛ ☞✁ ✌ ✆☎✠✁✟✟ ✍ ☞ ✁✎ ✡ ✏ ✁✟✟✝✑✁ ✒ ✡ ✝ ✡ ✁ ✄✁✆✟✄✁✠ ✡☛ ☞✁ ☛ ✂✁
Figure 1.1: State vs. temporal perspective of a distributed program
The first and more natural approach to distributed debugging is to extend a se-quential debugger to interact with more than one process, providing the software de-veloper with a single debugging interface to access all the processes of the distributed program. However, the considerable number of adaptations needed to allow a set of sequential debuggers to operate upon distributed programs, and the even larger number of new features that should be addressed and supported, would have strong implications upon the size and complexity of the debugger program itself, with the consequent difficulties in its maintenance.
1. INTRODUCTION 1.3. Contributions of this Thesis
Another basic requirement for distributed debuggers is to provide transparent ac-cess to remote proac-cesses, using a global naming scheme independent of proac-cess local-ization and freeing the software developer from the burden of knowing which process is running where.
The complexity of a distributed debugging tool will increase as the number of re-quired debugging functionalities grows or changes over time. An approach to reduce considerably the overall complexity of the distributed debugger, is to precisely defin-ing the core functionalities as a minimal set of services, and support an extension mech-anism. Additional services, developed as external modules, can then be incorporated into the distributed debugger as extensions.
One basic requirement to support extensions, is to decouple the debugging engine from the debugging user interface. In such a way, the functionalities provided by the debugging engine may grow incrementally and independently from the user interface; and multiple independent user interfaces can be allowed to operate concurrently upon the same target processes, exploring the basic functionalities provided by the debug-ging engine and some of the functionalities provided by one or more extensions.
For a better understanding of the distributed computation, it is desirable for the software developer to have multiple perspectives of the target program, probably pro-vided by different tools. For example, having a graphical editor of a visual parallel programming language providing an high-level view of the source code, a distributed debugger providing a state-based view, and a computation visualizer providing a time-based view. Different tools have different coordination requirements and oper-ate accordingly to different coordination models, from loosely-coupled cooperations with simple interactions, to tightly-coupled integrations with complex data and con-trol interactions.
The debugging engine proposed in this thesis follows the line of thinking presented above, aiming at the provision of basic debugging services for distributed programs and the support for interoperability and integration with other software development tools. It provides a complete set of process-level services, such as breakpointing and single-stepping, which was extended to include additional distributed debugging ser-vices, such as monitoring and replaying, the possibility to cooperate with other tools, such as computation visualizers, and the ability to be integrated inparallel software de-velopment environments.
1.3
Contributions of this Thesis
We may summarize the research work discussed in this thesis as:
soft-1. INTRODUCTION 1.3. Contributions of this Thesis
ware architecture in Linux based machines, and evaluated the debugging engine by designing, implementing and evaluating a set of experiments which explore its functionalities.
The above contributions can be further detailed as:
a) Requirements for the debugging of distributed programs. We have studied how the
software development and execution environments influence the functionalities re-quired from a distributed debugger, and how the testing methodology and user’s (software developer’s) perspective influences how those functionalities may be ex-plored;
b) Definition of the debugging engine. We have focused in the definition of a debugging
engine which would satisfy three main requisites:
b.1) Minimalism. To include a set of core basic services which are essential to the
debugging of distributed programs and to the support of the other requisites; b.2) Extensibility. To allow the evolution of the distributed debugger, the support
of more complex functionalities, and the adaptation of the debugger to specific needs;
b.3) InteroperabilityandIntegrability.To support the exchange of data and control
in-formation with other software development tools. We define interoperability as a loosely-coupled cooperation and integrability as a tightly-coupled coop-eration between two tools;
c) Design of a software architecture for the debugging engine. The defined debugging
en-gine was structured in (five) functional layers, each new layer based upon the pre-vious one and incrementally providing a new set of services;
d) Implementation of the debugging engine. We have made two major implementations
of the debugging engine: DDBG, which implemented an initial specification of the debugging engine; andFiddle, which implemented the specification and used the software architecture that is described in this dissertation;
e) Design and implementation of extensions to the debugging engine. The debugging
en-gine was defined to incorporate a minimal core set of services, and to provide the means for other services to be incorporated as extensions. In this context, a set of extensions providing complementary services were designed, implemented and incorporated into the debugging engine;
f) Evaluation of the debugging engine. A considerable number of experiments using
1. INTRODUCTION 1.4. Outline of the Dissertation
involved the full development of client tools which explored the available function-alities. In both cases, they allowed to validate the design and the implementation of the debugging engine.
1.4
Outline of the Dissertation
This dissertation contains seven chapters, whose contents are summarized below:
Chapter 1. This Chapter introduces the motivation to the debugging activity and its role as one important task in the software development process, enumerates the main contributions of this thesis and presents an outline of the dissertation, with a brief summary of each of the remaining Chapters;
Chapter 2. In this Chapter a brief overview is presented of the main dimensions in-volved in the debugging of parallel and distributed programs;
Chapter 3. This Chapter introduces the main requirements for distributed debugging and how traditional debugging services fulfill some of those requirements, fol-lowed by presentation of the software architecture of a debugging engine which fulfills some of those requirements, and how this debugging engine may be ex-tended with complementary functionalities which may cover the remaining re-quirements;
Chapter 4. This Chapter illustrates how the debugging engine described in the pre-vious Chapter has been instantiated in two prototypes: the DDBG (Distributed DeBuGger) andFiddle(Flexible Interface for Distributed Debugging: Library and Engine);
Chapter 5. This Chapter presents a set of case studies, where one of the debugging engine implementations (DDBG or Fiddle) have been used, and how they con-tributed to the operational and functional validations of the debugging engine and its implementations; and
1. INTRODUCTION 1.4. Outline of the Dissertation
2
Debugging of Parallel and Distributed
Programs
Contents
2.1 Basic Concepts . . . 12
2.2 Distributed Computations . . . 19
2.3 Distributed Debugging Methodologies . . . 24
2. DEBUGGING OFPARALLEL ANDDISTRIBUTEDPROGRAMS 2.1. Basic Concepts
2.1
Basic Concepts
A computer program is defined in the Lectric Law Library’s Lexicon [Lex] as,
Computer Program— A set of statements or instructions to be used directly or
indirectly in a computer in order to bring about a certain result.
According to the Hyper Dictionary [Dica], computer programs may be split in two groups, system software and applications, defined as
System Software— System software is any software required to support the
pro-duction or execution of application programs but which is not specific to any partic-ular application. Examples of system software would include the operating system, compilers, editors and sorting programs;
Applications— A complete, self-contained program that performs a specific
func-tion directly for the user. Examples of applicafunc-tion programs would include an ac-counts package or a CAD program.
Relying on the above definition of computer program, a process can be defined as [Dica]
Process— The sequence of states of an executing program. A process consists of
the program code (which may be shared with other processes which are executing the same program), private data, and the state of the processor, particularly the values in its registers. It may have other associated resources such as a process identifier, open files, CPU time limits, shared memory, child processes, and signal handlers.
Associated to the execution of a process is the concept ofcurrent state, which implies
the knowledge of what has already been done, what is currently being done, and what still remains to be done.
The same computer program may be executed again and again, each time in a new process, so that each new process provides a new execution context. It is also possi-ble to have multiple instances of the same or different computer programs executing concurrently in the same computing node, in amultitaskingsystem.
Multitasking — A technique used in an operating system for sharing a single
processor between several independent jobs. [. . . ] A multitasking operating system should provide some degree of protection of one task from another to prevent tasks from interacting in unexpected ways such as accidentally modifying the contents of each other’s memory areas.
Such multitasking systems are, in general, capable of isolating and hiding each pro-cess from the others, providing an execution environment which simulates exclusive-ness on the access to the computing and computer resources.
2. DEBUGGING OFPARALLEL ANDDISTRIBUTEDPROGRAMS 2.1. Basic Concepts
Thread— A control (execution) flow in a process.
When a process contains a single control flow, i.e., a single thread, it is common to associate the single control flow to the process itself and omit the references to the thread. However, some programs may use multiple control flows evolving concur-rently “inside” the execution environment provided by the process. Such programs are said to be multi-threaded.
In [Dica] multithreading is defined as
Multithreading— Differs from multitasking in that threads share more of their environment with each other than do processes under multitasking. Threads may be distinguished only by the value of their program counters and stack pointers while sharing a single address space and set of global variables. There is thus very little protection of one thread from another, in contrast to processes in multitasking.
Summarizing, one can say that programs are a passive entity and contain a set of in-structions to be executed by the computer. Processes are active entities, resulting from particular instantiations of programs being executed. The programs directed towards the end-user are called applications, while those associated with the management of system (computer) resources are called system programs. Some processes contain a single control flow while some others do contain multiple control flows, and are said to be single- or multi-threaded processes respectively. Systems that allow the time sharing of the CPU between multiple processes (and their control flows) are said to support multitasking.
Due to the isolation factors, usually it makes no difference whether a program is being executed in a single or in a multitasking environment. In what concerns to tithreading, the situation is quite different, and the program must be aware of the mul-tiple control flows and use them explicitly.
2.1.1 The Program Specification and Behavior
A computer program has, necessarily, a goal, which depends on the accomplishment of a set of (intermediate) objectives. Such set of objectives informally define the intended program behavior.
Frequently, such behavior model exists uniquely in the mind of the developer, being constructed, adapted, extended and corrected as the need arises. Even when there is an initial written specification of such intended behavior, it is frequently done in a very high-level description language with no formal grounding, such as natural language. This results in incomplete, ambiguous or even inconsistent behavior descriptions, with negative implications to the program development process and its assessment.
be-2. DEBUGGING OFPARALLEL ANDDISTRIBUTEDPROGRAMS 2.1. Basic Concepts
havior. Unfortunately this is not the usual case and, to be able to express the intended program behavior, the developer has to perform abstraction and simplification efforts, recurring to a limited number of concepts and under the syntactic and semantics re-strictions and limitations of the programming language.
Programming language is defined in [Dica] as
Programming Language— A formal language in which computer programs are
written. The definition of a particular language consists of both syntax (how the various symbols of the language may be combined) and semantics (the meaning of the language constructs).
Languages are classified as low level if they are close to machine code and high level if each language statement corresponds to many machine code instructions.
Programs are converted to machine code (CPU instructions) by compilers or inter-preters, defined in [Dica] as
Compiler— A program that converts another program from some source language
(or programming language) to machine language (object code) which is output to a file for later execution. Some compilers output assembly language which is then converted to machine language by a separate assembler.
A compiler is distinguished from an assembler by the fact that each input statement does not, in general, correspond to a single machine instruction or fixed sequence of instructions.
Interpreter— A program which executes other programs. [. . . ] ]It may be possible
to execute the same source code either directly by an interpreter or by compiling it and then executing the machine code produced.
The compilers and interpreters verify that the program strictly complies to the syn-tactic rules of the programming language and also do some simple semantic verifica-tions, such as detecting that a variable is used before being initialized. However, such semantic verifications are quite far from the intended program behavior in the mind of the programmer.
Due to the limitations of programming languages in the expressiveness of the in-tended program behavior, and of compilers/interpreters in its verification, one can (and should) also verify the program behavior during execution, theobserved behavior,
against the intended behavior specification. The success in such verification simply allows the developer to have “some confidence” that its specification (program) was correct, but does not constitute a formal proof of program correctness.
2.1.2
Program Correctness
2. DEBUGGING OFPARALLEL ANDDISTRIBUTEDPROGRAMS 2.1. Basic Concepts
software development tools available, are some examples of the many factors that may influence the correction of a computer program.
Program errors result from a mental mistake made by the programmer, and are defined in [Dica] as,
Error— A discrepancy between a computed, observed, or measured value or
con-dition and the true, specified, or theoretically correct value or concon-dition.
Incorrect steps, processes and data definitions are examples of errors. The execution of a program containing errors may originate faults, defined in [Dica] as,
Fault— A manifestation of an error in software.
Sometimes programs are able to handle some predicted faults. In these cases, al-though they are still manifestations of program errors, these faults are benign, as they allow the program execution to proceed. Serious or unpredicted faults may be the origin of process (or even system) failures. A failure is defined in [Dica] as,
Failure — The inability of a system or system component to perform a required
function within specified limits.
Errors in software are generically calledbugs, and the process of locating,
diagnos-ing and correctdiagnos-ing software errors calleddebugging.
In [Dicb] there is a definition of bug which includes some interesting historical ref-erences. Such definition is duplicated in Figure 2.1 on the next page.
Bugs can also be classified according to the way they behave or manifest them-selves. The following definitions are also from [Dicb].
i) Bohr bug(n.) [from quantum physics]
A repeatable bug; one that manifests reliably under a possibly unknown but well-defined set of conditions. Antonym of heisenbug.
Inhttp://info.astrian.net/jargon/terms/b/Bohr_bug.html
ii) Mandelbug(n.) [from the Mandelbrot set]
A bug whose underlying causes are so complex and obscure as to make its behavior appear chaotic or even non-deterministic. This term implies that the speaker thinks it is a Bohr bug, rather than a heisenbug.
Inhttp://info.astrian.net/jargon/terms/m/mandelbug.html
iii) Heisenbug (n.) [from Heisenberg’s Uncertainty Principle in quantum
physics]
2. DEBUGGING OFPARALLEL ANDDISTRIBUTEDPROGRAMS 2.1. Basic Concepts
2. DEBUGGING OFPARALLEL ANDDISTRIBUTEDPROGRAMS 2.1. Basic Concepts
schroedinbug. InC, nine out of ten heisenbugs result from uninitialized auto variables, fandango on core phenomena (esp. lossage related to corruption of the malloc arena) or errors that smash the stack.
Inhttp://info.astrian.net/jargon/terms/h/heisenbug.html
iv) Schroedinbug (n.) [MIT: from the Schroedinger’s Cat thought-experiment
in quantum physics]
A design or implementation bug in a program that doesn’t manifest until someone reading source or using the program in an unusual way notices that it never should have worked, at which point the program promptly stops work-ing for everybody until fixed. Though (like bit rot) this sounds impossible, it happens; some programs have harbored latent schroedinbugs for years.
Inhttp://info.astrian.net/jargon/terms/s/schroedinbug.html
The correctness of a program is related to some specification of its intended be-havior. Ideally, in order to ensure program correctness, we would like to have a well-defined formal notation to describe application behaviour rigorously and without am-biguity. Such an approach would allow the automatic generation of correct program code. In order to achieve a reasonable level of efficiency, such an approach usually re-lies upon a series of program transformations, from the high-level specification down to the executable code, with the guarantee of always generating equivalent program representations. In such an approach, bugs can only appear at the level of the applica-tion specificaapplica-tion, in relaapplica-tion to its intended behavior:specification bugs.
However, such an approach cannot be applied in general, so a programmer be-comes responsible for the mappings from some expression (formal or informal) of the intended behaviour, that is converted to a program code. Depending on the expres-siveness of the programming model and language used, such task can be greatly facil-itated. However, such an activity gives the opportunity to introduce another kind of bugs,programming bugs. Figure 2.2 illustrates such concepts.
specification bugs
programming bugs
Application
specification Program application
behavior Intended
Figure 2.2: Specification and programming bugs
The lack of a formal specification of program behaviour makes the debugging ac-tivity extremely complex, as specification and programming bugs both tend to appear mixed at the program code level.
2. DEBUGGING OFPARALLEL ANDDISTRIBUTEDPROGRAMS 2.1. Basic Concepts
In the past fifty years, there was a huge amount of work concerning the debug-ging of sequential applications. Several significant debugdebug-ging techniques were devel-oped, addressing both specification and programming bugs, depending on the kind of programming models and languages (e.g., imperative or declarative). In order to analyse the behaviour of a sequential program, a state-based approach is appropriate, supported by an interactive debugger. This allows the inspection of the succession of computation states (steps), also aided by placing breakpoints at desired conditions or regions of code. Due to its deterministic behavior, it is easy to re-execute the pro-gram under a given set of input conditions in order to repeatedly examine its behavior in detail. Sequential debugging is also made simpler because the program execution follows only one thread of control.
The observation of the program execution during debugging does not change the original program behaviour, except for real-time applications.
Parallel and distributed applications introduce several distinct aspects that make them much more difficult to debug.
Adistributed programconsists of a collection of sequential processes which cooperate
by using some communication model. This definition also includes the concept of a parallel program, although the latter term is more usually applied when there is a
need to meet the application performance requirements by exploiting simultaneous execution of program units in distinct physical processors. In this text, the termparallel and distributedis often used, in order to highlight the use of multiple processors, on one
hand, and in order to focus our attention on distributed architectures without global clock, no global shared memory, and no bounds on message transmission times, on the other hand.
The following aspects make distributed debugging much more difficult than se-quential debugging:
i) The large number of concurrent and interacting entities;
ii) The intrinsic non-deterministic behavior of a distributed program;
iii) The difficulties of constructing accurate, up-to-date, and consistent observations of the global states of a distributed computation;
iv) The perturbation due to the observation and control mechanisms.
The concept of adistributed computationrepresents possible behaviors which result
from executing a distributed program in a distributed systems (that is, supported by the operating system plus the hardware layers).
2. DEBUGGING OFPARALLEL ANDDISTRIBUTEDPROGRAMS 2.2. Distributed Computations
In the following section of Chapter, a brief survey is presented of the theory of distributed computations in order to explain the reasons why it is so difficult to debug distributed programs. In the remaining sections of the Chapter, an overview of the main distributed debugging approaches is presented.
2.2
Distributed Computations
Depending on the programming language used, the operational semantics of a dis-tributed program can be defined in terms of events that correspond to process control and communication actions. Such active computational entities (e.g., processes) and their state transitions, described by events, are mapped into the lower level primitive events defined by the underlying architecture of the distributed system.
Usually, for the study of distributed computations, a distributed program (system) is defined as a collection of processes that communicate using a basic message-passing model with the classicalsendand receiveprimitives. Such a system has asynchronous
characteristics, with arbitrary process speeds and message transmission delays, and lacks a global physical time reference.
Such nondeterminism makes it very difficult to evaluate correctness properties that should hold for all possible executions of a distributed program, and not only for one observed execution. Also the generated computation usually follows distinct execu-tion paths when repeatedly running the same distributed program, with a given set of input conditions.
There are two main concepts for helping us to describe all possible execution runs of a distributed program. One is the concept of local history of each sequential process that is involved in the execution of the distributed program. The other concept is the causal precedence ordering of events, defined by the sequential process ordering and the event dependences originated in process interactions.
AprocessPiis defined as a sequence ofevents, which defines its local historyhi. Two
main types of events are considered: internal events represent local state transitions
made by Pi alone, not involving any other processes;interactionevents represent
pro-cess communications corresponding to message send and receive actions. The totally ordered events inPi’s local history represent the evolution of the values of all the Pi’s
variables and of the interactions involvingPiin a distributed execution.
hi={e0i,e1i, ...,eif}
A process starts with its event e0i, that is the initialization event of Pi. It defines
the process initial state, denoted by s0i. In general, the kth event in the process his-tory, denoted byeki, produces the local state ski, as the state immediately right aftereki occurrence. One can assumeeif is the termination event ofPi, andsif isPi’s final state.
A prefix ofhi, for example up to and including thekth event, is denoted byhki and it
2. DEBUGGING OFPARALLEL ANDDISTRIBUTEDPROGRAMS 2.2. Distributed Computations
Aglobal history(H) is defined by the union of all local histories.
A fixed number (n) of processes is usually assumed without loss of generality. Among all the event orderings represented by H, only some of them can possibly occur that are compatible with the causal precedence relationship (7→) as defined by Lamport [Lam78]. Evente7→e′ iffecausally precedese′. Event e||e′ iff neithere7→e′ nore′7→e.
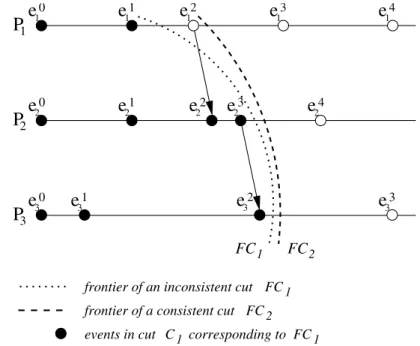
A distributed computation is formally defined as a partially ordered set (poset) defined by the (H,7→) pair. Intuitively, this reflects all physically feasible event com-binations that must be obeyed by all possible executions of a distributed program by a distributed system. Distributed computations may be represented by a process-time diagram where the event causality chains replace the classical notion of instant physi-cal time in a centralized system with a global clock.
e10 e
1 1 e 1 2 e 1 3 e 1 4
e20
e30
e21 e 2 2 e 2 3 e 2 4
e31 e
32 e33
P1
P2
P3
1
FC FC2
C1 FC1
events in cut corresponding to
2
FC frontier of a consistent cut
1
FC frontier of an inconsistent cut
Figure 2.3: Process-time diagram with consistent and inconsistent cuts
Distributed debugging relies upon the observation of the global states of a dis-tributed computation. Aglobal stateis an-tuple of local states of all involved processes.
S=s1∪s2∪. . .∪sn
where si is the local state of Pi (1≤i≤n) corresponding to some prefix of Pi’s local
history. The initial global state (denoted byS0) of a distributed computation is defined by the initial local states of all processes i.e. s0i for 1≤i ≤n. The final global state
of a distributed computation (denoted by Sf) is defined by the final local states of all processes i.e. sif for 1≤i≤n. The difficulty with the intermediate global statesis that
all combinations of local state tuples cannot occur in real executions of a distributed program.
In relation to a process-time diagram like in Figure 2.3, the concept of a cutis
de-fined as a subset of the global history, that represents a partial global history. The
2. DEBUGGING OFPARALLEL ANDDISTRIBUTEDPROGRAMS 2.2. Distributed Computations
frontier of a cut intuitively represents a view of the global progress up to a certain point in the execution in terms of the last occurred events. For example, in Figure 2.3 on the facing page there is a well-defined unique global state corresponding to each frontier of a cut, that gives the last occurred local states for each process.
However, onlyconsistent cuts are significant for the purpose of meaningful
obser-vations. A consistent cut isleft closedunder the7→relationship, i.e. ∀e,e′∈H:e∈Cc∧e′7→e⇒e′∈Cc
Intuitively, a consistent cut incorporates all the past of its own events. A cut that would include some eventeand not all events causally precedinge, cannot correspond to a possible view of a distributed execution.
A consistent global state is the global state defined by thefrontier of a consistent cut.
A consistent global state represents a global state that can possibly occur during a distributed program execution because it represents a view of the global state that respects the causal precedence among events. In Figure 2.3 on the preceding pageFC2 is a consistent global state andFC1is not.
The consistent cut and consistent global state concepts can be used as a basis to de-fine observation models for distributed computation that can be used for distributed debugging purposes. An intuitive notion of thecurrent state of a distributed
compu-tation can be visually caught by considering the events (and states) to the left of a
consistent cut, as equivalent to a past history, and the events to therightof a consistent
cut, as the ones in the future. This suggests one could consider an incremental pro-gression of the distributed computation, followed by the user under the control of a distributed debugger, wheresuccessiveconsistent global states would be examined for
evaluation of correctness predicates. Indeed this is an important research direction in distributed debugging, but it has several inherent difficulties that will be discussed in the following.
In order to understand the behavior of a distributed program one has to consider all intermediate consistent global states that can possibly occur starting by the initial stateS0until the final stateSf. For each execution of a distributed program, a distinct set of consistent global states may be followed so each execution generates a distinct sequences of states, due to the nondeterminism of a distributed system. However, to ensure correctness, one needs to reason in terms of all such possible sequences of consistent global states.
The concept ofconsistent runrepresents a possible observation of a distributed
com-putation where all the events appear in a total ordering that extends (i.e. is compatible to) the partial ordering defined by Lamport’s causal precedence relation.
2. DEBUGGING OFPARALLEL ANDDISTRIBUTEDPROGRAMS 2.2. Distributed Computations
properties of a distributed program. This approach is in general infeasible due to the large combinatory of global states that would have to be examined. Moreover, the problem of constructing individual global states poses additional difficulties.
More complete presentations of these concepts may be found in [BR94,CL85,Mat89]
2.2.1
Observation of Global States
The intuitive notion of global state of a distributed computation corresponds to a col-lection of local states that could be viewed by some ideal external observer. In a dis-tributed system, an external observer can only build such a view through message exchange with each remote individual process. The following aspects are related to this observation problem:
i) The global state can beobsoleteat the time the global view is actually constructed
by the external observer. This occurs in case the observation is performed online, during actual execution. If the observation is performed offline, in a postmortem
analysis of the global histories, this problem does not arise.
ii) The observed global state must be a consistent cut of the distributed computation. Observation of inconsistent cuts may occur due to the unpredictable message de-livery orderings in a distributed system. An inconsistent sequence of events may be built by the observer that does not preserve the causal precedence relationship. Algorithms to build consistent cuts are thus required [BFR95, CL85].
iii) Multiple independent observers may build distinct views of the same distributed computation. The presentation of uniform views of a distributed computation to multiple concurrent and independent observers requires an adequate coordina-tion between them.This is an issue that has not been considered in most of existing distributed debugging tools. However, it has high relevance due to the emergence of integrated development environments where several concurrent tools act as ob-servers (and sometimes controllers) of an ongoing distributed computation.
The difficulties of the observation depend on the adopted distributed debugging approach:
i) Off-line. In this approach, it is possible to analyse global histories that were
gen-erated by a previous execution or by a simulation of the program model. These methods always deal with complete histories.
ii) Online. In this approach, it is necessary to develop algorithms to construct global
2. DEBUGGING OFPARALLEL ANDDISTRIBUTEDPROGRAMS 2.2. Distributed Computations
The main approaches to construct observations of a distributed computation use an online external observer or monitor process. All existing approaches make specific assumptions on the message delivery rules that should be enforced by the distributed system, ranging from FIFO ordering between pairs of processes to causal delivery of messages. A discussion of the implementation of such delivery rules is beyond the scope of our work. A complete survey may be found in [BM93, Clá03].
2.2.2 Detection of Global Predicates
A general method underlies the work by several authors to support the distributed debugging activity, according to the three following steps.
i) Global predicate specification. This step starts by the identification of desired or undesired program properties corresponding to a set of correctness criteria. These properties are then expressed as global predicates which are boolean expressions involving conditions on the local variables of multiple processes or on the states of communication channels.
ii) Evaluation of global predicates. This step is responsible for the detection of global predicates using off-line or online approaches. The problem of evaluating gen-eral forms of global predicates has been studied and found NP-hard, so sevgen-eral authors have focused on the evaluation of restricted forms of global predicates, such as conjunctive and disjunctive. Although restricted, such global predicates are still useful in distributed debugging. An important distinction is established amongstable properties, such as deadlock and termination, andunstable properties
of a distributed program, which may dynamically change their truth values dur-ing the computation. The detection of unstable properties is obviously more dif-ficult. It cannot be ensured by online observations based on the global snapshot approach, as the constructed state may miss the point of the computation where that property holds. Concerning the online construction of consistent run, even if the property holds for a certain consistent global state in that constructed run, this does not gives information about how it behaves in other possible runs. Ex-tended forms of global properties have been proposed by several authors that try to express the program behavior in terms of the entire distributed computation, in-stead of related to a single global state.Several authors have exploited approaches for building and traversal the entire space of consistent global states, which are ad-equate for evaluation of both stable and unstable predicates. Other authors have tried to exploit specific and simplified forms of global predicates, e.g., consistent global predicates, in order to avoid an exhaustive search of that space. These ap-proaches are further discussed in [CG98, CM91, HPR93, BM93, GCMK96, TG93].
2. DEBUGGING OFPARALLEL ANDDISTRIBUTEDPROGRAMS 2.3. Distributed Debugging Methodologies
For example, if the detected global predicate corresponds to a bug situation, a dis-tributed debugger should be able to stop the execution and restore the local states of all processes in a meaningful consistent global states that satisfy the detected global predicate.
2.3
Distributed Debugging Methodologies
Distributed debugging methodologies can be classified according to the level of sup-port they provide to the user concerning the activities of global predication specifica-tion and detecspecifica-tion, and the search for the causes of the bugs.
to obtain reproducible behavior
the result of applying each method
the required aspect
provided by the following method in the chain to analyze
alternative paths
to evaluate local correctness properties
correctness predicate specification state based debugging
deterministic re−execution
systematic state exploration
Interactive debugging of remote processes
and debugging Trace, replay
Integrated testing, active control and debugging
active control and debugging
GP detection,
Figure 2.4: distributed debugging methodologies
In the following, these approaches are successively discussed, starting from the simpler approaches to the more complex ones. These approaches are complementary to each other, in the sense that each approach tries to overcome a limitation of the previous approach in the sequence.
2.3.1
Interactive Debugging of Remote Processes
2. DEBUGGING OFPARALLEL ANDDISTRIBUTEDPROGRAMS 2.3. Distributed Debugging Methodologies
main distinction between existing distributed debuggers of this kind is related to the functionalities and design of their architectures.
This approach is important as a first step. However, it does not handle the nonde-terminism behavior of a distributed program.
2.3.2 Trace, Replay and Debugging
In order to address the nondeterminism, this approach is based on collecting a trace of the relevant events generated by a distributed computation, during a first program run. The trace describes a computation path (a consistent run) that can be analysed at a
postmortemstage. If erroneous situations are found, the program can be re-executed
un-der the control of a supervisory mechanism. This mechanism uses the traced sequence of events to force the execution to follow the same path as the ones in the previous run. This allows the user to examine the behavior of that path within a cyclic inter-active debugging session, in a reproducible way. In such a session, the user may use the observation and control functionalities provided by the previous approach. The trace and replay technique has been the focus of intensive research in the past decade, mostly concerning the reduction of the probe effect and of the volume of the traced information [Net94, Net93, FCdK95, LMC87, RK98, Wit88, RBC+03]. However, not all
commercial debuggers include such a facility.
From the view point of distributed debugging, there is a limitation in this approach if it gives no support to analyse other computation paths besides the traced one. If the first run which is used to collect the trace is a ’free’ run i.e. under the control of no supervisory mechanism, the resulting trace describes only a randomly occurring path from the large set of possible paths. This gives no guarantee that such is an (the) interesting path to consider for analysis. Indeed, it is highly unlikely this will be the case.
Although this approach improves on the first one, it still needs to be complemented by the following approach.
2.3.3 Integrated Testing, Active Control and Debugging
This approach tries to overcome the above mentioned limitation of a simple passive trace and replay approach. Multiple authors have proposed approaches for the active control of distributed program execution for debugging purposes. They try to provide a facility to enforce the execution of specific runs of a distributed computation in order to ease the location of erroneous situations. They differ in the way they generate and specify the desired consistent run that a controlled execution should follow. In the following, one of these approaches is briefly described for illustrative purposes.
2. DEBUGGING OFPARALLEL ANDDISTRIBUTEDPROGRAMS 2.3. Distributed Debugging Methodologies
analysis and debugging stage. The goal of the testing phase is to assist the user in the generation of interesting runs that may exhibit violations of correctness properties. In general it is not feasible (or even possible) to provide a completely automated testing phase. An interactive testing tool is useful to cooperate with the user to specify and refine the conditions and regions of program code that should be considered for anal-ysis. The testing phase is then used to generate a sequence of commands that will be used to drive a program run, in order to exercise the paths defined by the above test-ing scenarios. Such a run can then be the subject of a trace and replay approach, and integrated in a cyclic debugging session.
The main advantage of this methodology is that it allows the user to interactively ’walk’ through the testing and debugging phases, until one is convinced about the sat-isfaction of the correctness properties that are being investigated. Another advantage of this approach is that it combines the advantages of static and dynamic analysis in order to help the user to understand program behavior (cf below).
The main problem with this approach is that it basically relies upon the user convic-tion that all relevant scenarios were specified and generated, tested and analysed, so that one gets confidence on distributed program correctness. There is no full guarantee that no important situations went unnoticed. Still, this approach has been the basis of intensive research and has produced interesting results [LCK+97].
2.3.4
Automated Detection of Global Predicates
This approach is an attempt to help the user increasing the confidence on the re-sults of the previous approach, by allowing the specification of the correctness cri-teria in terms of global predicates. Such global predicates are then automatically evaluated by detection algorithms, working off-line or on-line distributed debug-ging [Bat95, Bat88, CG98, CM91, Clá03]. As the efficient evaluation of global predi-cates is limited to restricted classes of global predipredi-cates, this approach may be seen as complementary to the testing and debugging approach. Their integration seems a promising research direction to improve.
2.3.5
Distributed Debugging Based on Static Analysis
This approach uses the program code as a basis and it does not require actual program execution. It relies on formal models of program behavior that can be used to check certain kinds of properties, usually expressed as temporal logic formulas. However, model checking techniques can only be used to analyse certain properties and do not give information on dynamic properties that depend on actual runtime program be-havior, e.g., termination. Also, they usually incur great computational costs in their search for all allowable state transitions in the modelled computation space.