47
Performance Analysis of Various Filters for Image Noise Removal in
Different Noise Environment
R. Srinivas
1, Satarupa Panda
2Abstract
In this paper, a comparative study on three types of noise as Salt & Pepper noise, Gaussian Noise and Speckle noise has been undertaken under six different noise densities varying from 10% to 60% with the use of four filters as Average filter(AF), Adaptive Median filter(AMF), Standard Median filter(SMF) and Alpha Trimmed Mean filter (ATMF). The result comparison has been done with the help of Mean Square Error (MSE), Peak Signal to Noise Ratio (PSNR) and Gain (%) to find a better method for the removal of noise in image in different noise conditions during acquisition.
Keywords
Filters, Noise, Mean Square Error, Peak Signal to Noise Ratio
1.
Introduction
Noise is any unwanted information added to the image when transmitted through any digital media. As a result, the image may get dirty spots like dots, speckles and stains.[1,3] These dots may be taken as impulses like salt & pepper noise or speckle noise and continuously varying signal as Gaussian noise [10]. To remove the speckles or dots we have several linear and non-linear approaches [2]. The linear method of noise removal is based on the mean value of the neighboring pixels whereas the nonlinear method depends on the median value of the pixel window. The Average Filter (AF) and Alpha Trimmed Mean Filter (ATMF) come under linear filters and the Standard Median Filter (SMF) and the Adaptive Median Filter (AMF) falls in nonlinear category. In this paper, these filters are used for the removal of noise of the input image and their behaviour is studied under different noise environments [4].
R. Srinivas, Associate Professor, Department of Computer Science and Engineering, Aditya Institute of Technology and Management, Tekkali, Andhra Pradesh, India.
Satarupa Panda, Department of Computer Science and Engineering, Aditya Institute of Technology and Management,Tekkali, Andhra Pradesh, India.
The probability density function of the noise used in this paper is given below:
Salt & Pepper Noise:
These are dark pixels on light background and bright pixels on dark background. It is also called as impulse noise [8] whose probability density function is given:
p(z)= Px , for z=x
p(z)=Py , for z=y
p(z)= 0 , Otherwise
If y>x, gray level y will appear as light dot in the image else x will appear as dark dot.
Gaussian Noise:
These are randomly distributed normal noise expressed as:
Where z is gray level, µ is mean of z, σ is standard deviation, σ2
is called variance of z
Speckle Noise:
The distribution noise is given as: J=I + n*I
Where J is the distribution speckle noise image, I is the input image and n is the uniform noise image
Performance Parameters
The results are evaluated in the form of Mean Square Error (MSE) and Peak Signal to Noise Ratio (PSNR) [10] defined as:
Where M1 (i , j ) is the input image matrix and
M2 ( i , j)is the filtered image matrix and
M*N is the size of the image
Where R is the maximum value of pixel present in the image [9].
2.
Simulation and Results
48 Noise [2, 3]. This image is then filtered by using four
noise filters like Average Filter, Adaptive Median Filter, Alpha Trimmed Mean Filter and Standard Median Filter at different noise densities varying from 10% to 60%. [5]Next, the performance comparison among the filters is done based on MSE, PSNR (in dB) and Gain (%) value. The same procedure is followed in each individual filtering experiment and all the experimental results are carried out on MATLAB version 7.
Fig 1: house.jpg
The results of MSE and PSNR values for the final output image are listed in the tables below for comparison with the previous calculated unfiltered values using various noise types at different noise densities [5].
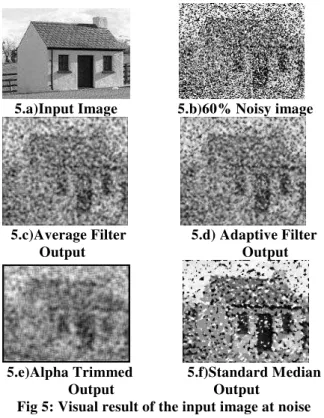
Table 1, Table 2 and Table 3 shows the MSE, PSNR and Gain values respectively for the experiments conducted using salt and pepper noise. The first section of Table 1 and Table 2 indicates the results obtained from the noisy image directly without any filter. The remaining sections represent the filtered output for the test image at different noise densities. In comparing the sections, the result after filtering shows an improvement of values. [1, 6] It is clear that the Standard Median Filter (SMF) performs efficiently in removing salt & pepper noise compared to the other filters resulting in least MSE value and highest PSNR. But it fails in higher densities (here 60%).
Table 1:Comparison of MSE values of various filters at different noise densities using salt &
pepper noise
10% 20% 30% 40% 50
%
60%
Before Filtering
3407.6 5285. 6
6919.2 8810.4 0654.0 12056.0
Average Filter
1392.8 1818. 4
2053. 9
2457. 2
2903. 5
3509.2
Adaptive Filter
1499.5 1951.4 2696.4 2797.5 634.0 3793.3
Alpha trimmed
2850.5 2869.1 2986.1 3011.9 339.5 4584.2
Median Filter
785.53 1027.1 1806.8 2190.6 387.5 5373.0
Table 2: Comparison of PSNR (in dB) of various filters at different noise densities using salt &
pepper noise
10% 20% 30% 40% 50% 60%
Before Filtering
12.80 10.89 9.73 8.68 7.85 7.31
Average Filter
16.69 15.53 15.00 14.22 13.50 12.67
Adaptive Filter
16.37 15.22 13.82 13.66 12.52 12.34
Alpha Trimmed
13.58 13.55 12.93 13.37 12.89 11.51
Median Filter
19.17 18.01 15.56 14.72 13.83 10.82
Table 3: Comparison of Gain (%) of various filters at different noise densities using salt &
pepper noise
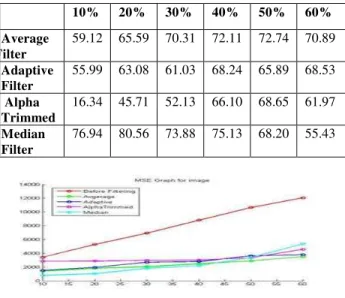
10% 20% 30% 40% 50% 60%
Average Filter
59.12 65.59 70.31 72.11 72.74 70.89
Adaptive Filter
55.99 63.08 61.03 68.24 65.89 68.53
Alpha Trimmed
16.34 45.71 52.13 66.10 68.65 61.97
Median Filter
76.94 80.56 73.88 75.13 68.20 55.43
Fig 2: MSE graph for the image using salt & pepper noise where x-axis contains noise densities
and y-axis contains MSE values for the filters
Fig 3:PSNR graph for the image using salt & pepper noise where x-axis contains noise densities
49
Fig 4: Gain plot for the image using salt & pepper noise where x-axis contains noise densities and
y-axis contains Gain values for the filters
Fig 2, Fig 3 and Fig 4 shows the output for the image where the x-axis contains the noise densities (10%-60%) and y-axis represents the MSE, PSNR and Gain value respectively. From the Gain plot using salt & pepper noise, it can be noticed that the standard median filter gives best results at lower densities but inefficient at higher noise [7]. The Average Filter (AF) is efficient at higher densities with lowest error than the other filters. The Adaptive Median Filter (AMF) also follows the average filter but is less effective at few densities. The Alpha Trimmed Mean Filter (ATMF) has a poor result in removing salt & pepper noise.
5.a)Input Image 5.b)60% Noisy image
5.c)Average Filter 5.d) Adaptive Filter Output Output
5.e)Alpha Trimmed 5.f)Standard Median Output Output
Fig 5: Visual result of the input image at noise density 60% using salt & pepper noise
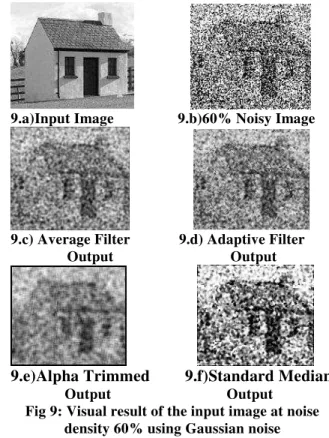
Table 4, Table 5 and Table 6 are the results of MSE, PSNR and Gain computed for the test image using Gaussian Noise at different noise intervals. The standard median filter (SMF) which is efficient in removing salt & pepper noise shows a poor result in removing Gaussian Noise. The Alpha Trimmed filter is also inefficient for suppressing Gaussian noise. The Average Filter and Adaptive filter results in lesser MSE.[5] The Average Filter works efficiently in all noise densities and it has a least Mean Square Error (Fig 6) and highest Peak Signal to Noise Ratio (Fig 7) in removing Gaussian Noise. Comparing the Gain plots (Fig 8) between the filters, the Average Filter has a highest gain value. The visual results of the noisy image with noise density 60% is compared in Fig 9
Table 4: Comparison of MSE of various filters at different noise densities using Gaussian noise
10% 20% 30% 40% 50% 60%
Before Filtering
5290.4 6956.7 9038.2 9512.2 10792 11420
Average Filter
1426.5 1912.9 2347.3 2552.4 2759.1 3136.9
Adaptive Filter
1569.8 2013.8 2495.5 2669.3 2997.0 3310.2
Alpha trimmed
3071.1 3324.3 3558.6 3774.8 3990.5 4250.5
Median Filter
1815.1 2698.4 3590.9 4133.8 4853.8 5469.4
Table 5: Comparison of PSNR (in dB) of various filters at different noise densities using Gaussian
noise.
10% 20% 30% 40% 50% 60%
Before Filtering
10.89 9.70 8.56 8.34 7.79 7.55
Average Filter
16.58 5.31 14.42 14.06 13.72 13.16
Adaptive Filter
16.17 15.09 14.15 13.86 13.36 12.93
Alpha Trimmed
13.25 12.91 12.61 12.35 12.12 11.84
Median Filter
15.54 13.8 12.57 11.96 11.26 10.75
Table 6: Comparison of Gain (%) of various filters at different noise densities using Gaussian
noise
10% 20% 30% 40% 50% 60%
50 Filter
Adaptive Filter
70.32 71.05 2.38 71.93 72.22 71.01
Alpha Trimmed
49.94 52.21 0.62 60.31 63.02 62.78
Median Filter
65.69 61.21 60.26 56.54 55.02 52.10
Fig 6:MSE graph for the image using Gaussian noise where x-axis contains noise densities and
y-axis contains MSE
Fig 7: PSNR graph for the image using Gaussian noise where x-axis contains noise densities and
y-axis contains PSNR values for the filters
Fig 8: Gain plot for the image using Gaussian noise where x-axis contains noise densities and
y-axis contains Gain values for the filters
9.a)Input Image 9.b)60% Noisy Image
9.c) Average Filter 9.d) Adaptive Filter Output Output
9.e)Alpha Trimmed
9.f)Standard Median
Output Output Fig 9: Visual result of the input image at noise
density 60% using Gaussian noise
Table 7, Table 8 and Table 9 are the MSE, PSNR and Gain values computed for different filters using Speckle Noise at different noise densities. In removing the Speckle Noise, the Average Filter is efficient. It has highest PSNR (Fig 11) and least MSE (Fig 10). The Adaptive Filter also shows a lesser MSE graph (Fig 10) than the other filters in low noise density values. The alpha trimmed filter and standard median filter are comparatively less effective in removing Speckle noise. The visual results of the image are listed in Fig 13.
Table 7: Comparison of MSE of various filters at different noise densities using Speckle noise
10% 20% 30% 40% 50% 60%
Before Filtering
3055.6
4752.2
6619.5 6895.1 9169.9 9487.3
Average Filter
1311.3
1780.3
2098.6 2242.3 2721.2 3548.8
Adaptiv e Filter
1411.7
1640.9
2765.2 2510.1 2782.9 3397.5
Alpha trimmed
2178.3
3174.6
3356.7 3711.5 3617.4 4007.4
Median Filter
1523.8
2254.1
51
Table 8: Comparison of PSNR (in dB) of various filters at different noise densities using Speckle
noise
10% 20% 30% 40% 50% 60%
Before Filtering
3.27 11.36 9.92 9.74 8.50 8.35
Average Filter
6.45 15.62 14.91 14.62 13.78 12.62
Adaptive Filter
16.63
15.97 3.71 14.13 13.68 12.81
Alpha Trimmed
14.74
13.11
2.87 12.43 12.54 12.10
Median
Filter 16.30 14.60
14.21 12.85 13.07 11.46
Table 9: Comparison of Gain (%) of various filters at different noise densities using Speckle
noise
10% 20% 30% 40% 50% 60%
Average Filter
57.08 62.53 68.29 67.47 70.32 62.59
Adaptive Filter
53.79 65.47 58.22 63.59 69.65 64.18
Alpha trimmed Filter
28.71 33.19 49.29 46.17 60.55 57.76
Median Filter
50.13 52.56 62.74 51.15 65.04 51.11
Fig 10: MSE graph for the image using Speckle noise where x-axis contains noise densities and
y-axis contains MSE values for the filters
Fig 11: PSNR graph for the image using Speckle noise where x-axis contains noise densities and
y-axis contains PSNR values for the filters
Fig 12: Gain plot for the image using Speckle noise where x-axis contains noise densities and
y-axis contains Gain values for the filters
13. a)Input Image 13.b)60% Noisy Image
13. c) Average Filter 13.d) Adaptive Filter Output Output
13.e)Alpha Trimmed 13.f)StandardMedian Output Output
Fig 13: Visual result of the input image at noise density 60% using Speckle Noise
3.
Conclusion
By de-noising the noisy test image using different filters at various noise densities, we conclude from the results (Fig 2 to Fig 13) that
a) In removal of Salt & pepper noise, Standard Median Filter (SMF) is efficient in removing low density noise (upto 50%) and the Average Filter is efficient removing high density noise (60% and more).
52 Average Filter has comparatively better
results in all noise densities.
c) The performance of the Average filter after de-noising Speckle noise is better than other filters. The Adaptive Filter gives good response in lowest densities (10%-20%) but fails in higher density values.
d) The Alpha Trimmed Filter is not found efficient enough in removing any of the noises.
References
[1] Pawan Patidar, Manoj Gupta, Sumit Srivastava and Ashok Kumar Nagawat, ―Image De-noising by Various Filters for Different Noise‖, International Journal of Computer Applications (0975 –8887), Volume 9– No.4, November 2010. [2] Shiv Singh, Dr. G.C.Lall, ―Performance Analysis of Various Impulse Noise Reduction Techniques in Images‖, International Journal of Advanced Research in Computer Science and Software engineering,Volume 2, Issue 6, June 2012 ISSN: 2277 128X.
[3] Chanchal Srivastava, Saurabh Kumar Mishra, Pallavi Asthana, G. R. Mishra, O.P. Singh, ― Performance Comparison of Various Filters and Wavelet Transform for Image De-Noising‖, IOSR Journal of Computer Engineering, e-ISSN: 2278-0661, p- ISSN: 2278-8727Volume 10, Issue 1 (Mar. - Apr. 2013), PP 55-63.
[4] Neenu Raju, V. Karunakaran, ―An Efficient Method for Removing Impulse Noise From The Image‖, International Journal of Computer Science and Management Research, Vol 2 Issue 3 March 2013.
[5] Hadi Sadoghi Yazdi, Faranak Homayouni, ―Impulsive Noise Suppression of Images Using Adaptive Median Filter‖, International Journal of Signal Processing, Image Processing and Pattern Recognition, Vol. 3, No. 3, September, 2010.
[6] CH.Sravana Lakshmi, V.Ambika, K.Suri Babu, ―Impulse Noise Removal In images Using Modified Trimmed Median Filter:Matlab Implementation And Comparative Study‖, International Journal of Engineering Research and Applications, ISSN: 2248-9622 ,Vol. 2, Issue 5, September- October 2012, pp.2163-2166. [7] Zhou Wang and David Zhang, ―Progressive
Switching Median Filter for the Removal of Impulse Noise from Highly Corrupted Images‖, IEEE Transactions on Circuits And Systems—II: Analog and Digital Signal Processing, VOL. 46, NO. 1, January 1999.
[8] Srinivasan, K. S., and David Ebenezer. "A new fast and efficient decision-based algorithm for removal of high-density impulse noises." Signal Processing Letters, IEEE 14, no. 3 (2007): 189-192.
[9] Geoffrine Judith.M.C and N.Kumarasabapathy, ―Study and Analysis of Impulse Noise reduction Filters‖, Signal & Image Processing: An International Journal, Vol.2, No.1, March 2011. [10]Mr. Salem Saleh Al-amri, Dr. N.V. Kalyankar,
―A Comparative Study of Removal Noise from Remote Sensing Image‖, International Journal of Computer Science Issues, Vol. 7, Issue. 1, No. 1, January 2010.
R. Srinivas presently working as Associate Professor in the Dept. of CSE, AITAM Tekkali. He has 14 years of experience in teaching (Academics) and has 6 international publications. He is the member of CSI and ISTE.
Ms. SatarupaPanda is presently a 2nd year M Tech student in Dept. of CSE, AITAM Tekkali. She has one year of Teaching Experience and has 2 International Conference publications.
.