Overlapping DNA Methylation Dynamics in
Mouse Intestinal Cell Differentiation and
Early Stages of Malignant Progression
Marta Forn1¤, Anna Díez-Villanueva1, Anna Merlos-Suárez2, Mar Muñoz1, Sergi Lois1,
Elvira Carriò1, Mireia Jordà1, Anna Bigas3, Eduard Batlle2,4, Miguel A. Peinado1
*
1Institute of Predictive and Personalized Medicine of Cancer (IMPPC) 08916 Badalona, Barcelona, Spain, 2Institute for Research in Biomedicine (IRB Barcelona) 08028 Barcelona, Spain,3Institut Hospital del Mar d’Investigació Mèdica (IMIM) 08003 Barcelona, Spain,4Institució Catalana de Recerca i Estudis Avançats (ICREA), Barcelona, Spain
¤ Current address: Butenandt Institute of Physiological Chemistry, Ludwig‐Maximilians‐Universität München, Munich, Germany
Abstract
Mouse models of intestinal crypt cell differentiation and tumorigenesis have been used to characterize the molecular mechanisms underlying both processes. DNA methylation is a key epigenetic mark and plays an important role in cell identity and differentiation programs and cancer. To get insights into the dynamics of cell differentiation and malignant transfor-mation we have compared the DNA methylation profiles along the mouse small intestine crypt and early stages of tumorigenesis. Genome-scale analysis of DNA methylation to-gether with microarray gene expression have been applied to compare intestinal crypt stem cells (EphB2high), differentiated cells (EphB2negative),ApcMin/+adenomas and the corre-sponding non-tumor adjacent tissue, together with small and large intestine samples and the colon cancer cell line CT26. Compared with late stages, small intestine crypt differentia-tion and early stages of tumorigenesis display few and relatively small changes in DNA methylation. Hypermethylated loci are largely shared by the two processes and affect the proximities of promoter and enhancer regions, with enrichment in genes associated with the intestinal stem cell signature and the PRC2 complex. The hypermethylation is progres-sive, with minute levels in differentiated cells, as compared with intestinal stem cells, and reaching full methylation in advanced stages. Hypomethylation shows different signatures in differentiation and cancer and is already present in the non-tumor tissue adjacent to the adenomas inApcMin/+mice, but at lower levels than advanced cancers. This study provides a reference framework to decipher the mechanisms driving mouse intestinal tumorigenesis and also the human counterpart.
OPEN ACCESS
Citation:Forn M, Díez-Villanueva A, Merlos-Suárez A, Muñoz M, Lois S, Carriò E, et al. (2015) Overlapping DNA Methylation Dynamics in Mouse Intestinal Cell Differentiation and Early Stages of Malignant Progression. PLoS ONE 10(5): e0123263. doi:10.1371/journal.pone.0123263
Academic Editor:Jorg Tost, CEA - Institut de Genomique, FRANCE
Received:September 12, 2014
Accepted:February 17, 2015
Published:May 1, 2015
Copyright:© 2015 Forn et al. This is an open access article distributed under the terms of the
Creative Commons Attribution License, which permits unrestricted use, distribution, and reproduction in any medium, provided the original author and source are credited.
Data Availability Statement:All relevant data are within the paper and its Supporting Information files. Additional genomic data has been submitted to the GEO database (accesion number GSE61318).
Introduction
The intestine is a fascinating organ exposed to very dynamic environmental factors including food, toxins and a complex microbiota. A powerful immunological system developed during breastfeeding and weaning provides protection against a wide variety of harmful agents [1]. Nev-ertheless, the maintenance of a life-long functionality (basically the capability to absorb nutri-ents) and resisting the multiple hazards is accomplished through an intensive regeneration of intestinal mucosa [1]. Deregulation of cell proliferation and differentiation processes may lead to malignant transformation and propagation of intestinal cancer stem cells [2]. In the mouse, the intestinal epithelial layer has a turnover of 5 days and is folded forming the crypts [3]. Two dis-tinct pools of Intestinal Stem Cells (ISCs) coexist in the crypt bottom: the quiescent ISCs at +4 position (Paneth cells precursors and crypt restorers after injury) and the rapidly cycling crypt-based columnar cells, which are responsible for crypt homeostasis [4]. The cellular differentiation occurs along the crypt axis and the terminally differentiated cells of the small intestine migrate towards the tips of villi (protrusions into the small intestine lumen). Important methodological advances have been made in crypt’s cells isolation and propagation [3,5,6] allowing the charac-terization of the expression signatures of the different cellular fractions [2,7,8,9,10,11,12,13,14]. DNA methylation is the main epigenetic modification of DNA and, together with other epi-genetic marks, regulates cellular homeostasis. In mammalian cells DNA methylation mostly occurs at the 5’-position of cytosine within the CpG dinucleotide, which is not equally distrib-uted along the genome, clustering in regions called CpG islands [15]. DNA methylation pro-files show important differences among tissues [16] and several studies have reported a role for DNA methylation in cellular differentiation [17,18,19,20,21,22], including the intestine [23]. Pioneering investigations proposed a crypt niche model based on DNA methylation profiles [24] and, more recently, Kaaij et al [25] have shown an impact of transcription factor binding on shaping the DNA methylation landscape during differentiation of stem cellsin vivo. More-over, Sheaffer et al have demonstrated that dynamic DNA methylation at enhancers is required for stem cell differentiation in the small intestine [23].
The disruption of the epigenetic landscape is considered to be a common hallmark of many widespread diseases including cancer [26]. While tumor progression is characterized by global DNA hypomethylation [27] and hypermethylation of selected CpG islands (reviewed in [28,29]), most tissue specific DNA methylation changes occur in the lower CpG density regions that lie in close proximity of CpG island, known as CpG island shores [30]. It is well known that intestinal stem cell dynamics and premalignant disease is accompanied by DNA methyla-tion changes [31], but it is yet unclear how the epigenetic control of cell differentiation is over-ridden in early stages of cell transformation [32].
Besides genome-wide DNA methylation profiles have been investigated in murine intestinal cell differentiation [23,25] and mouse intestinal adenomas [33], no study to date has addressed the concurrent and comparative analysis of both processes. We aim to identify the epigenetic determi-nants that set either the normal program of differentiation or the aberrant and progressive repro-gramming into malignant cells. We have analyzed the DNA methylation profiles along the mouse small intestine crypt and early stages of tumorigenesis (ApcMin/+mice adenomas) using a sensitive and feasible genome-wide approach. Gene expression analyses were performed to determine the impact of DNA methylation in transcriptional regulation and the cellular expression signature.
Materials and Methods
Tissues and cell lines: ethical statement
All mice used were in a C57BL/6J background housed in centralized accredited research animal facilities, staffed with trained husbandry, technical, and veterinary personnel. Animal care,
DNA Methylation Dynamics in Intestinal Cell Differentiation and Cancer
The funders had no role in study design, data collection and analysis, decision to publish, or preparation of the manuscript.
monitoring, and sacrifice were conducted in accordance with protocols approved by the Animal Care and Use Committees of the Barcelona Science Park (PCB) and the Barcelona Biomedical Research Park (PRBB), and the Ethical Committee for Animal Experimentation of the Govern-ment of Catalonia. Food and water were provided to the micead libitum. Ten adult wild type an-imals (>8 weeks old) were euthanized in a chamber with a saturated CO2atmosphere. Intestines were extracted and cellular fractions from small intestine were obtained by purification of intesti-nal crypt cell based on theEphB2surface levels as described [7]. FourApcMin/+mice were also used for this study. The general condition ofApcMin/+mice was monitored daily using animal fit-ness and weight controls throughout the experiment. When animal suffering was detected, they were administering with analgesics (Buprenorphine in a dose of 0.05–0.1 mg/kg of weight). When deteriorating clinical alterations were observed mice were euthanized in a chamber with a saturated CO2atmosphere. Adenomas and normal colon tissue were obtained fromApcMin/+
mice as previously described [34]. Mouse colon carcinoma cell line CT26 was obtained from the American Type Culture Collection (ATCC).
Experimental design
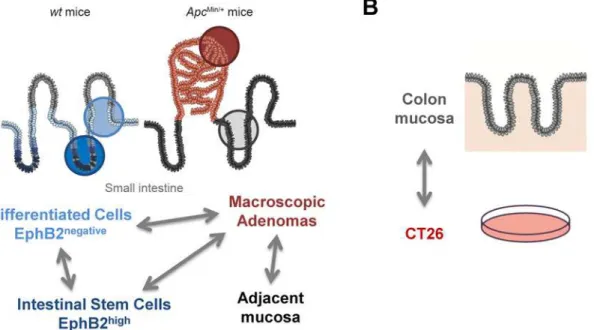
Two experimental settings were designed for analysis of DNA methylation profiles (Fig 1). The first setting allowed the comparison ofEphB2highsmall intestine stem cells (ISC) with the EphB2negativecounterpart (differentiated cells) and adenomas and their adjacent non-tumor tis-sue fromApcMin/+mice. Intestinal crypts were sorted into four populations of cells representing different levels of differentiation based on the presence ofEphB2(EphB2high,EphB2medium, EphB2lowandEphB2negative). The ISC gene expression signature [7] was analyzed to confirm the profile of the fractions and only the extreme fractions (EphB2high, andEphB2negative) were included in the study to avoid overlap among differentiation stages. In a second setting, we compared colon and small intestine mucosa from healthy mice and the CT26 cell line. All
Fig 1. Simplified scheme of the experimental design to identify differential DNA methylation in intestinal cell differentiation and cancer.SettingA examines changes related with cell differentiation processes and early stages of intestinal cancer. SettingBallows the identification of differences between the large intestine and the CT26 colon cancer cell line representing advanced stages of cancer progression. Illustration of the intestinal epithelium is based on schemes published in reference [82].
samples were analyzed by AIMS-Seq in duplicate. Validation of the DNA methylation and gene expression results were performed in additional samples obtained using the same proce-dures. The list of samples analyzed in this study and the molecular studies performed in each one are summarized in Table A inS1 File.
AIMS-Seq
To compare the DNA methylation profiles at the genome scale we have applied next generation sequencing to the products of the Amplification of InterMethylated Sites technique (AIMS-Seq) (S1 Fig). AIMS allows the identification of differentially methylated DNA fragments flanked by twoXmaIsites (CCCGGG) when two or more samples are compared [35]. AIMS principles and protocol have been described in detail elsewhere [35,36]. Briefly, genomic DNA (obtained by conventional phenol–chloroform extraction) was digested using the methylation-sensitive en-zymeSmaI (Roche Diagnostics, GmbH, Mannheim, Germany) during 16h at 25°C, which gener-ates blunt ends in the unmethylated sites. A second digestion with the methylation-insensitive isoschizomerXmaI (New England Biolabs, Boston, MA) was performed (6h at 37°C) generating cohesive ends in the methylated targets. The fragments flanked by cohesive ends (methylated) were selectively ligated to specific adaptors (5’CCGGTCAGAGCTTTGCGAAT and
5’CCGAATTCGCAAAGCTCTGA) using T4 DNA ligase (New England Biolabs, Boston, MA). Products were purified with Illustra DNA and Gel Band Purification Kit (GE Healthcare, Piscat-away, NJ, USA). Fragments flanked by the adaptor were amplified by PCR with primer
(ATTCGCAAAGCTCTGACCGGG). PCR product was purified with the JETQUICK PCR Spin Kit (Genomed, St. Louis, MO, USA), sheared with Covaris S2 system and the library was clus-tered and sequenced in Illumina GA2 devices. Reads (36 nucleotides long) were mapped with Bowtie [37] against the mouse genome build NCBI37/mm9. Only reads mapping uniquely inside virtual amplicons of the AIMS universe were taken into account for analysis of differential dis-play. The AIMS virtual universe includes all the mouse genome fragments flanked by two XmaI sites and with a length range between 20 and 2000 bp. A total of 50,745 virtual amplicons were considered (Table B inS1 File). The number of reads mapping inside each amplicon represent an arbitrary indicator of methylation level of the affected XmaI sites. By comparing the number of reads mapped to a given amplicon in two different samples, it is possible to detect differential methylation: the sample with a higher number of reads will be more methylated in a given re-gion. Total-sum scaling normalization was applied considering the number of reads mapping in-side virtual amplicons (Table C inS1 File). Reproducibility assays were performed to test the variability of the technique. Due to limited availability of cells, AIMS-Seq was performed with 300 ng of genomic DNA for of intestinal crypt fractions and adenomas. Normal tissues, adeno-mas and cell lines were analyzed using 1000 ng of DNA. Results generated with different amounts of genomic DNA were not comparable due to the differential display of a large number of amplicons (data not shown).
Differentially methylated regions (DMRs) were revealed as differentially represented ampli-cons determined using the DESeq R package [38], considering significantly different those amplicons that had a log2 fold change value3 and adjusted p-value0.01. Differentially methylated domains (DMD) were identified using the circular binary segmentation method developed to analyze DNA copy number data [39]. Only genomic regions>50 kb and encom-passing a minimum of five AIMS-Seq amplicons were considered. AIMS-Seq amplicons locat-ed in X and Y chromosomes were excludlocat-ed in the global quantification of DMRs.
Bisulfite treatment
Bisulfite treatment was performed using the EZ DNA methylation kitTM (Zymo Research). Specific genomic regions were amplified by nested PCR (primers are listed in Table D inS1 File) and the purified product was sequenced with the BigDye Terminator v3.1 Cycle Sequencing Kit (Applied Biosystems, Foster City, CA, USA).
Gene expression
RNA was extracted with RNeasy Mini or RNeasy Micro Kit (Qiagen), according to manufactur-er’s instructions and including the DNase digestion step. Labeled RNA was hybridized following one color protocol into SurePrint G3 Mouse 8x60K Agilent arrays. Data analysis was performed using the TMEV software applying Limma statistics (two class analysis) [40]. Gene expression differences with log2 fold change1.2 and with a FDR0.01 were considered significant.
Genomic annotation and functional analysis
AIMS-Seq amplicons were annotated according to the overlap of the two flanking XmaI with selected genomic elements in the NCBI37/mm9 assembly. Genomic elements were down-loaded from the mm9 annotation database at the UCSC browser (http://hgdownload.soe.ucsc. edu/goldenPath/mm9/database/).
Genes exhibiting changes at either DNA methylation or expression were analyzed for functional enrichment using the Functional Annotation Chart from DAVID Bioinformatics Resources 6.7 (http://david.abcc.ncifcrf.gov/) and taking into account the Gene Ontology classification (GO FAT category) and KEGG pathway [41]. FDR0.05 was considered significant.
Results
Genome-wide analysis of DNA methylation by AIMS-Seq
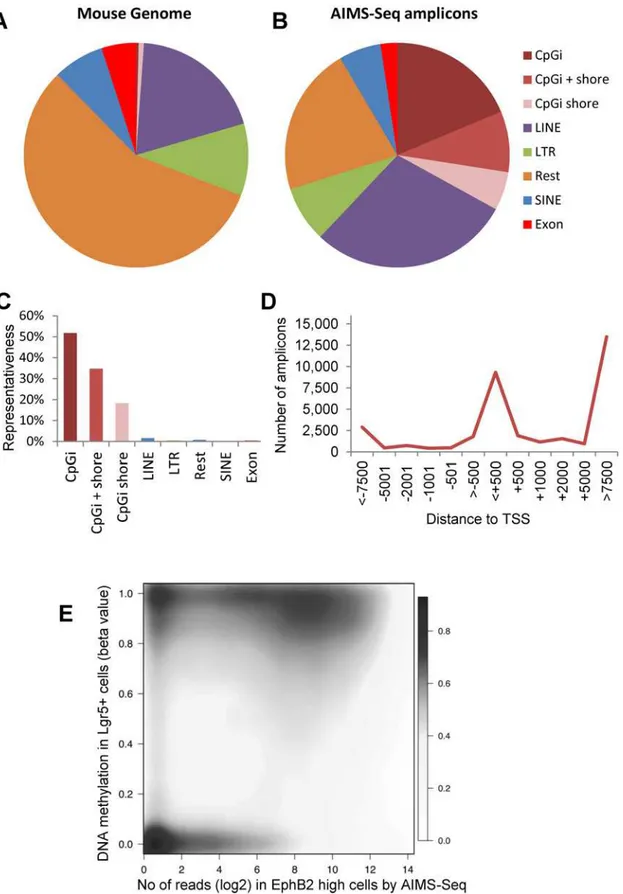
AIMS-Seq generated an average of 14 million of reads uniquely mapped in the mouse genome (Table C inS1 File). Technical replicates were performed in samples pooled from several ani-mals (intestinal crypts cell fractions) and biological replicates in tissues and cell lines (Table A inS1 File). Taking into account PCR limitations, only reads mapping inside canonical ampli-cons (ranging in size from 20 to 2,000 bp) were ampli-considered (S1B Fig). Noteworthy, 92–98% of all reads mapping unambiguously were located inside the AIMS-Seq virtual universe (Table C inS1 File).
Fig 2. Genomic representativeness of AIMS-Seq. A, Mouse genome composition according to the different genetic elements considered.B, Relative distribution of AIMS-Seq amplicons in the mouse genome.C, Coverage of genetic elements by AIMS-Seq amplicons.D, Distribution of AIMS-Seq amplicons regarding its distance to the transcription start site (TSS) of the closest gene.E, Density distribution of AIMS-Seq amplicons according to the number of reads detected in ISCs compared with the beta values of the amplicon flanking CpGs determined in Lgr5+ cells analyzed by WGBS (data from reference [25]).
doi:10.1371/journal.pone.0123263.g002
Differential DNA methylation along intestinal cell differentiation and
tumor progression
The number of reads assigned to each canonical amplicon was normalized according to the total number of reads mapping unambiguously in the mouse genome (Table C inS1 File) and used as an index of DNA methylation for sample comparisons. Differentially methylated re-gions (DMRs) in cell differentiation along the small intestine crypt and early states of tumori-genesis were determined using the DESeq package (seeMaterial and methods).
Validation studies by direct bisulfite sequencing were applied to a subset of the DMRs de-tected by AIMS-Seq. Illustrative examples are shown inFig 3andS2 Fig. It is of note that most differences detected by AIMS-Seq in the cell differentiation process corresponded to moderate changes in the levels of DNA methylation. In some cases, the methylation change only affected part of the amplicon. This may be the case ofXmaIsites located in the boundaries of certain ge-nomic elements as CpG islands or CpG island shores.
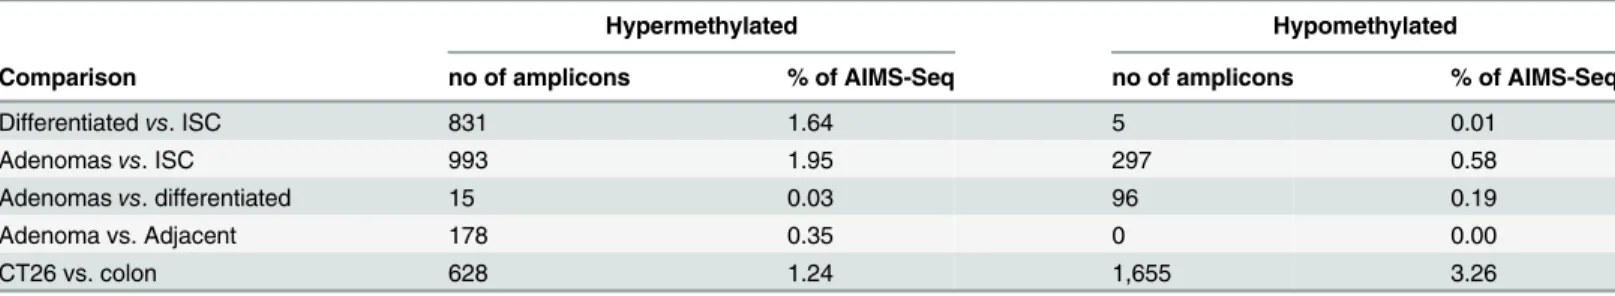
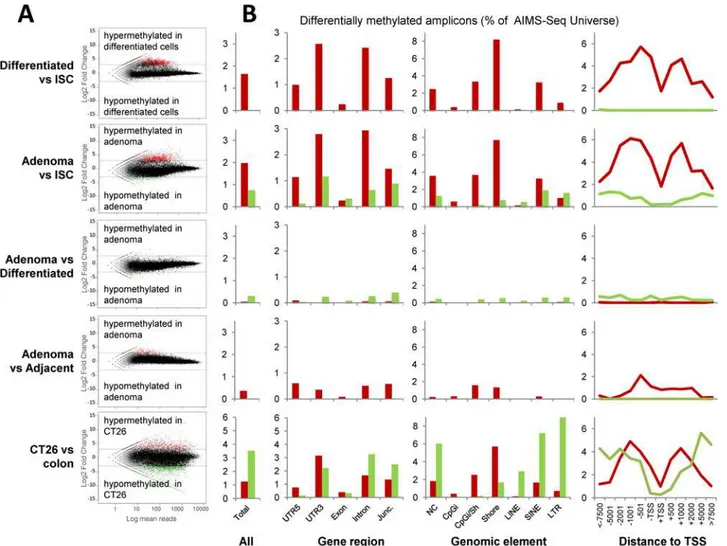
At the global level, only 1.6% of AIMS-Seq amplicons displayed changes in small intestine dif-ferentiated cells versus intestinal stem cells, with an overwhelming prevalence of hypermethyla-tions (n = 831) versus hypomethylahypermethyla-tions (n = 5) (Table 1andFig 4). In adenomas, 2.7% of amplicons were found differentially methylated when compared with intestinal stem cells. Inter-estingly, hypermethylations represented the most abundant changes in adenomas and a large proportion of them were shared with differentiated cells (Table 1). About 2/3 of the hypermethy-lations within 2kb of the TSS were shared by differentiated cells and adenomas (S3 Fig), which indicates they are not specific of the transformation process. This hypothesis is also supported by the lower overlap (about 1/5) with the hypermethylations detected in CT26 cells. Nevertheless, it remains to be elucidated whether they are required for cell transformation. Alternatively, hypo-methylations in adenomas versus ISCs were observed to a lesser extent than hyperhypo-methylations (Fig 4); and unlike hypermethylations, they appeared to be specific of the tumor process, because they were absent in the cell differentiation process. When compared with differentiated cells (from healthy animals) and adjacent tissue (fromApcMin/+mice), adenomas showed a low num-ber of DMRs with opposite trends: prevalence of hypomethylations respect normal differentiated cells but hypermethylations versus the adjacent tissue (Table 1).
Finally, the colon carcinoma cell line CT26, representing an advanced stage of the tumor process, presented alterations in 4.5% of amplicons with a predominance of hypomethylations (Table 1andFig 4).
Genetic features of differentially methylated loci
Regarding the genomic distribution of DMRs, the proportion of both hypermethylations and hypomethylations in different genetic elements was quite different depending on the compari-sons considered (Fig 4andS2 Fig). Results are summarized in Tables E to I inS1 Fileand the lists of DMRs together with the most relevant biological information are reported in Tables J thru R inS1 File.
Gains of methylation, as the most prominent trend in intestinal cell differentiation, affected 3’UTRs, introns, CpG island shores, non coding RNAs and frequently occurred in the proximi-ties of TSSs but excluding the TSS itself (Fig 4). Hypomethylations affected all genomic ele-ments with no specific enrichment (Fig 4). Moreover, hypermethylations exhibited by the adenomas affected CpG island shores and 5’UTRs of genes.
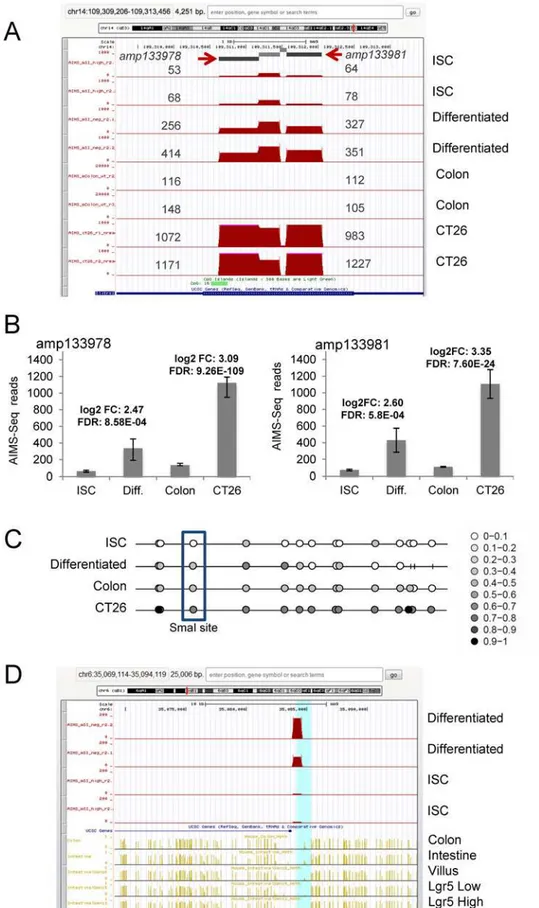
Fig 3. AIMS-Seq analysis. A, Distribution of normalized reads obtained by AIMS-Seq in the genomic region neighboring the Slitrk1 gene. Amplicons amp133978 and amp133981 are indicated by arrows and the
whereas hypomethylations show a broader genomic impact, being more prominent in gene desert regions and repetitive sequences (Fig 4and Tables E thru I inS1 File).
Functional impact of differentially methylated genes during intestinal
differentiation and cancer
To gain insights into the biological implications of DNA methylation changes we analyzed functional enrichment of genes with DMRs within 2Kb of the TSS (Tables J-R inS1 File). Hypomethylations were not enriched in any specific functional category in any of the compari-sons performed. On the other hand, developmental and regulatory processes were enriched in the hypermethylated compartment of differentiated cells and adenomas as compared with ISCs (Table S inS1 File). Interestingly, in addition to these categories, CT26 cells also exhibited significant enrichment of hypermethylation in genes related with cell migration and adhesion (Table S inS1 File), which are critical to convey invasive features to malignant cells.
Genome-wide analysis of DNA methylation in multiple mouse tissues has shown that most tissue specific DMRs occur at distalcis-regulatory elements [42]. Therefore we analyzed the distribution of DMRs detected by AIMS-Seq in regard to the localization of predicted enhanc-ers as reported in adult mouse intestine [42]. Interestingly, both cell differentiation and malig-nant transformation showed enrichment of hypermethylations in the vicinity or overlapping with predicted enhancers, whereas hypomethylations only affected enhancer regions during the differentiation process (S4 Fig).
Chromosomal domains with coordinated differential methylation during
intestinal cell differentiation and cancer
To determine the occurrence of regional changes in the DNA methylation profiles during the cell differentiation and transformation processes, we compared the differential represen-tation of AIMS-Seq reads along the mouse genome by applying CGH-like analysis
number of reads mapped in each one is shown next to the peak in four types of cells (ISC, differentiated, colon and CT26 cells) analyzed in duplicate.B, Both amplicons showed statistically significant differences according to the defined criteria (seeMaterial and methods) in the comparison ISC vs. Differentiated cells and normal colon vs. CT26 cells. The logarithm of the fold change (log2FC) and the false discovery rate (FDR) are indicated for two comparisons between samples.C, Methylation profile of CpGs surrounding the XmaI site of amp133978 in four samples. The profile was represented using the Methylation plotter tool [83] and the methylation level of each CpG (beta value) is represented by a grey scale lollipop from white (unmethylated) to black (fully methylated) according to the scale. Sticks represent CpGs not determined. The CpG corresponding to the 3’XmaI site is boxed.D, Comparison of the differential methylation detected by AIMS-Seq in ISC and differentiated cells with data generated by WGBS in related samples. Note the progressive increase of methylation from intestinal stem cells (Lgr5+) to more differentiated states. WGBS data were obtained from references [25,42].
doi:10.1371/journal.pone.0123263.g003
Table 1. Differentially methylated regions (DMR) as determined by AIMS-Seq during intestinal cell differentiation and transformation.
Hypermethylated Hypomethylated
Comparison no of amplicons % of AIMS-Seq no of amplicons % of AIMS-Seq
Differentiatedvs. ISC 831 1.64 5 0.01
Adenomasvs. ISC 993 1.95 297 0.58
Adenomasvs. differentiated 15 0.03 96 0.19
Adenoma vs. Adjacent 178 0.35 0 0.00
CT26 vs. colon 628 1.24 1,655 3.26
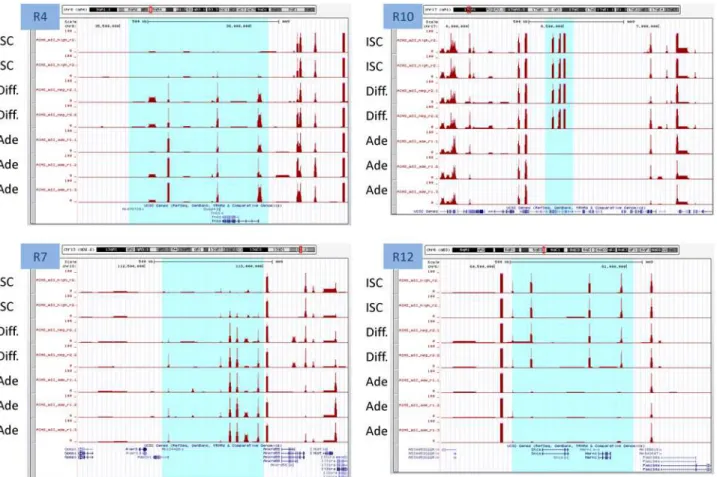
(seeMaterial and methods). Twenty-two differentially methylated domains (DMD) were identified among all comparisons performed (Permutation test with 100 permutations, p-value = 0.01). Only regions represented by 5 or more AIMS-Seq amplicons and affecting>50 Kb were considered (Table T inS1 File). Four of these regions were reproduced in more than one comparison. Interestingly, differentiated cells exhibited 8 DMDs ranging from 80 Kb to 2.58 Mb in length, all of them hypermethylated when compared with ISCs. A 67 Kb region in chromosome 13 includingTmem181b-psand Gm2792 pseudogenes was hypomethylated in adenomas (in comparison with differentiated and ISC), but hypermethylated in CT26. The large 2.58 Mb region hypermethylated in differentiated cells as compared with ISC included a subregion of 882 Kb that was also hypermethylated in adenomas (Fig 5). This region contains 109 genes, including two gene families: there are two clusters of histone coding genes at the 5’
and 3’ends, while in the middle there is a vomeronasal type-1 receptor family cluster (Table T inS1 File). The detected increase of methylation was mostly located in the region occupied by the histone coding genes, which is a CpG rich region. Functional analysis Fig 4. Distribution of differentially methylated AIMS-Seq amplicons. A, The results of five different comparisons (as illustrated inFig 1) are distributed in rows. MA plots show the log2 ratio of the number of normalized reads per amplicon in the indicated comparisons.B, Relative distribution (% of the AIMS-Seq virtual universe) of hypermethylations (red) and hypomethylations according to different genomic features regarding gene context (UTR, exons, introns, junction exons/introns), genome element (CpG island, CpG island shore, LINE, SINE, LTR and non classified elements) and distance to transcription start site (TSS).
doi:10.1371/journal.pone.0123263.g004
showed enrichment for nuclear and chromosome organization, largely explained by the pres-ence of multiples isoforms of histone 1 (Table U inS1 File).
Differential gene expression along intestinal cell differentiation and
tumor progression
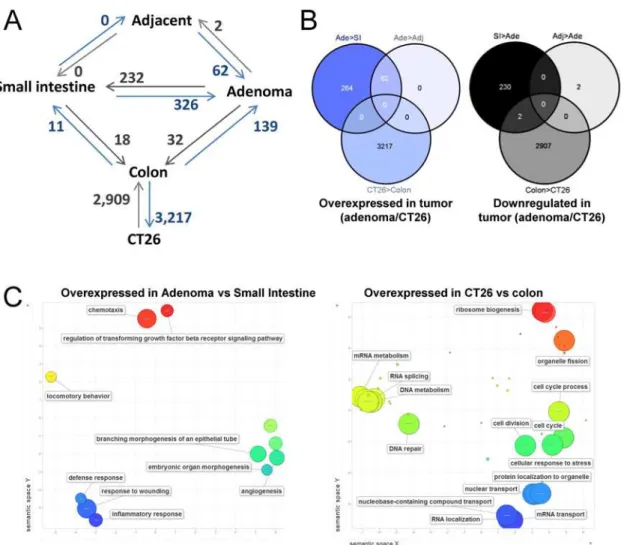
In addition to DNA methylation, we also compared the gene expression signatures among healthy small intestine and colon,ApcMin/+mouse adenomas and their adjacent non-tumor tis-sue, and CT26 cell line. Genes with differential expression are described in detail in Tables A to J inS2 Fileand a summary of the differences is illustrated inFig 6. Normal tissues (Small intes-tine and colon of control animals versus normal tissue adjacent to adenomas inApcMin/+mice) showed few changes: 29 genes were differentially expressed between small intestine and colon, whereas non tumor tissue adjacent to adenomas inApcMin/+mice was indistinguishable from the small intestine of healthy animals. Interestingly, of the 326 genes overexpressed in adeno-mas as compared with healthy small intestine, only 62 were overexpressed when the compari-son was performed against the tissue adjacent to the adenoma, indicating that the adjacent tissue displays intermediate levels for about 81% of genes overexpressed in adenomas (Fig 6). The cellular functions of genes overexpressed in adenomas showed enrichment in chemotaxis, angiogenesis and regulation of transforming growth factor beta-receptor signaling pathway Fig 5. Differentially methylated domains in Differentiated-ISC and Adenoma-ISC comparisons.Four examples are illustrated. Each track corresponds to the number of normalized reads in the AIMS-seq for each sample. Highlighted regions indicate domains larger than 50 kb and with at least 5 amplicons showing differential methylation between samples. R4 and R7 domains are hypermethylated in differentiated and adenoma cells versus ISCs. R10 and R12 domains are hypomethylated in adenoma cells versus ISCs and differentiated cells.
(Fig 6Cand Table K inS2 File). Unlike adenomas, CT26 cells exhibited a high number of dif-ferences with normal colon and with similar rates of over- and downregulation (Fig 6and Ta-bles A to J inS2 File). As expected, multiple biological processes related with cancer were affected (Fig 6Cand Table K inS2 File).
Lack of global correlation between differential methylation and gene
expression
Next, we investigated the correlation between DNA methylation changes and gene expression data generated in another study [7]. By AIMS-Seq we determined that in differentiated cells, 397 had a gain of methylation in the promoter region (2kb from the TSS) (Table L inS2 File). Most genes did not show any association between DNA methylation and gene expression changes (data not shown). Only 14 genes exhibited inverse correlation between methylation and expression (Table M inS2 File). Strikingly, ten of these hypermethylated AIMS-Seq ampli-cons were located in the gene promoter region of the downregulated genes (Aqp4,Axin2, Fig 6. Differential gene expression. A, Diagram of the gene expression analyses performed by microarrays. Comparisons are denoted by connecting lines. The number of genes overexpressed in the sample pointed by the arrowhead is indicated next to the connecting line.B, Overlapping of genes differentially expressed in different pair of samples.C, Semantic representation of biological processes enriched in genes overexpressed in adenomas and CT26 cells compared with the respective normal tissue. The graph was generated with Revigo [84]. Bubble size indicates the-log10 of the FDR (see Table K inS2 File
for details).
doi:10.1371/journal.pone.0123263.g006
Atad5,Brca1,Fads1,Lgr5,Phgdh,Slc1a2,Slit2,St3gal3) belonging to the expression signature of the intestinal stem cell [7], which represents a highly significant enrichment (Fisher exact test, p value<2.2e-16). These changes affected the gene CpG island and/or CpG island shore, except forAqp4. Direct bisulfite sequencing (S2 Fig) and inspection of WGBS profiles obtained by Kaaij et al in an independent setting (S5 Fig) revealed that the changes corresponded to moderate variations in the percentage of DNA methylation in one or several CpG sites.
Genes becoming hypermethylated in CT26 are low expressed in healthy colon when com-pared with genes maintaining methylation levels constant or hypomethylated (S6 Fig). Indeed, a global trend was observed in hypermethylated genes that showed even lower values in CT26 cells (S6 Fig).
Discussion
Genome-wide analysis of differential DNA methylation, technical
remarks
Our knowledge of biological processes as cell differentiation and cancer has improved dramati-cally in the last two decades thanks to the application of advanced genomic tools to decipher the epigenetic code. Besides this progress and the wide range of available methodologies [43,44,45], genome scale analysis of DNA methylation dynamics still represents critical technical challenges.
The use of methylation sensitive endonucleases played a pivotal role in the early characteri-zation of genomic regions affected by DNA methylation and the discovery of disease specific epigenetic biomarkers [43,44]. With the advent of next generation sequencing technologies, the potential of techniques based in this type of approaches has reemerged. Methyl-Seq is one of such examples developed in Richard Myers lab and applied to identify DNA methylation changes associated with human liver development [46].
Here we have applied AIMS-Seq, a variation of the AIMS method [35]. This technique re-quires minute amounts of material (<500 ng of genomic DNA) and has a very high sensitivity, which makes it adequate for the experimental setting described here. The standard version of AIMS has been applied with a significant success to uncover specific [47,48,49] and global DNA methylation alterations in cancer [50,51,52], epigenetic differences between monozygotic twins [53] and was instrumental for the characterization of functional CpG methylation in the honeybee [54].
The coupling of high throughput sequencing to AIMS (AIMS-Seq) renders an approach based in the same principles of Methyl-Seq and allows the study of differential DNA methyla-tion at the genome scale level, but at a relatively low cost. AIMS-Seq targets about half of the sites covered by Methyl-Seq, but this reduction of complexity results in a five-fold increase in read depth per amplicon with a similar sequencing effort. AIMS-Seq reports information on a wide range of sequences, including those with low CpG content, which have been described as the most variable regions in healthy tissue [55] and repetitive sequences, which are poorly ana-lyzed by other approaches. About half of the CpG islands and CpG island shores in the mouse genome get canonical representation (Fig 2). Another important advantage of AIMS-Seq is the simplicity of data analysis, as currently available bioinformatic and biostatistical pipelines can be applied with minimal adaptations, overcoming the computational bottleneck that often slows down this type of projects.
(Jordà M et al, manuscript in preparation). Therefore, the target of the methylation sensitive re-striction enzymes can be used as a faithful surrogate indicator of the methylation status of the comprising genomic element.
An important feature of this AIMS-Seq is its high sensitivity to detect differential methyla-tion affecting a small percentage of cells [35]. It should be noted that a large proportion of the changes observed in the DNA methylation levels in similar settings by WGBS are below 10–
20% [25,42,57], and AIMS-Seq is able to detect these small variations (S5 Fig). These features make AIMS-Seq a feasible approach to identify new epigenetic targets in settings where DNA methylation differences are small and sample availability is limited. The suitability of AIMS-Seq in this type of studies has been well exemplified by its application to analyze DNA methylation profiles in murine myogenesis [58]. Carrió et al. uncovered more than 1000 differentially meth-ylated regions providing an overall view of the epigenetic landscape along the muscle-lineage de-termination process. Indeed, the comparison with data generated by Reduced Representation Bisulphite Sequencing allowed a global validation of the results [58]. This study also demon-strated the adequacy of AIMS-Seq to identify specific changes with a prominent role in the cell differentiation process. In particular, they found hypomethylation of Myf5 superenhancer (a crucial myogenic regulatory factor) as a key epigenetic event associated with the functional acti-vation of this locus [58].
In summary AIMS-Seq provides an overall view of the differential methylome between mul-tiple biological conditions and allows the identification of specific candidates with a potential role in the process. Most outstanding features AIMS-Seq are high sensitivity, low material re-quirements and a relatively small demand of technical and computational labors.
DNA methylation dynamics in intestinal differentiation
Our analysis indicates that intestinal cell differentiation is accompanied by small changes in DNA methylation, mostly consisting in hypermethylations that affect less than 2% of the genome analyzed by AIMS-Seq. As a whole, these figures are difficult to compare with WGBS data gener-ated in similar experimental settings [23,25]. Kaaij et al reported 297 TSS with>50% DNA methylation difference and most of them corresponded to hypomethylations in differentiated cells as compared with ISC. For their sake, Sheaffer et al identified 4240 DMRs and more than half of them affected CpG islands and CpG island shores. In our setting, about 1/3 of hyper-methylations occurring during cell differentiation were located near TSS (less than 500 bp).
DNA methylation changes in enhancers play an important role in cell identity and differen-tiation processes (reviewed in reference [59]); and previous investigations have reported that a large proportion of DMRs affect enhancers during cell differentiation [23,25,60]. Our results are in agreement with these observations, but also expand the scope of the conclusions by showing that hypermethylations also affect distal regulatory elements in mouse intestinal tu-mors, as previously shown in different human cancer types [61,62,63]. However, unlike cell dif-ferentiation, our data indicate the spreading out of hypomethylation to non-regulatory regions in intestinal tumorigenesis. It is well known that the functional implications of global genomic hypomethylation in cancer go beyond the deregulation of specific genes (reviewed in reference [26,27])
Only a small proportion of these epigenetic changes were associated with transcriptional si-lencing of the respective gene (Table M inS2 File). Similar studies applying WGBS [23,25], which offers a more comprehensive genomic coverage, have found good correlation between hypermethylations near TSSs and gene expression. The overall lack of correlation between DNA methylation and gene expression in our study may be explained by the high sensitivity of AIMS-Seq to detect DMRs. Direct comparison with WGBS data [25] revealed that most
hypermethylations detected by AIMS-Seq were very small and affected a few CpG sites. Inter-estingly, genes reported to constitute the ISC signature (and therefore downregulated or si-lenced in differentiated cells, i.e.Lgr5) showed very small increases of DNA methylation in a few CpGs in the respective CpG island shore (S5 Fig). By AIMS-Seq these changes were clearly detected, which confirms the sensitivity of this technique.
A note of caution should be sounded regarding the interpretation of DNA methylation changes detected in intestinal cell differentiation. Due to the small amounts of starting material, fractions from four animals were pooled in order to reach enough DNA to perform the analyses. This implies that inter-animal variability was abolished from our data. While this limitation does not challenge our results and conclusions, we cannot fully disregard inter-individual vari-ability, as well as heterogeneity in analyzed cell fractions. Our data on specific changes with a role in the intestinal cell differentiation (e.g.:Lgr5hypermethylation, see above) have been con-firmed by ourselves and other studies [23], but further studies using more powerful techniques are needed to determine the steadiness of epigenetic and transcriptional profiles in intestinal cell differentiation.
DNA methylation dynamics in intestinal tumorigenesis
ApcMin/+adenomas displayed few changes in DNA methylation when compared with intestinal stem cells (2.7% of the canonical AIMS-Seq amplicons), and a large subset of them were shared with differentiated cells (in the case of hypermethylations), and the non-tumor tissue adjacent to the adenoma (in the case of hypomethylations). It has been previously reported that the dy-namics of hypermethylation and hypomethylation are independent in human colorectal cancer [51,64,65]. In this context, we can postulate that hypomethylation would be an early phenome-non preceding the morphological emergence of the adenoma and consistent with a field effect [66] in which the adjacent tissue already displays a large fraction of the molecular changes bear by the tumor. Moreover, hypermethylation in adenomas would recapitulate in part the ISCs differentiation process and incorporate tumor specific changes. The conservation of DNA methylation profiles may explain the retention of cell differentiation capacity inApcMin/+ microadenomas [67]. In fact mostApcMin/+adenomas maintain the crypt architecture and do not progress to carcinoma [68]. The subsequent cell transformation would require additional changes consistent with the stepwise model of cancer progression in which genomic and epige-nomic instability drive subsequent alterations.
Recently, Grimm et al. [33] applied MeDIP-seq to study the methylome ofApcMin/+ adeno-mas. Similarly to our analysis, a high proportion of DMRs affected CpG islands and promoter regions. Indeed, they found polycomb targets were enriched among hypermethylated regions in adenomas, although just a few tumor suppressor genes were silenced. Binding of Polycomb repressive complex 2 (PRC2) has been shown to point genes prone to be hypermethylated in cancer [69]. Our data confirm Grimm’s observations, as 64 of the genes found hypermethy-lated in adenomas and 76 in CT26 by AIMS-Seq constitute targets of the PRC2 complex [70] (S3B Fig). The enrichment of PRC2 targets in the DMRs detected by AIMS-Seq is highly signif-icant (Fisher exact test, p value<2.2e-16). This group of genes includes the homeobox gene En1(S7 Fig), whose hypermethylation has been described as a promising biomarker of neo-plastic stages of human colorectal cancer [71].
Hypermethylation affects large chromosomal domains in cell
differentiation and cancer
hypermethylated domains. The nature and functional implications of DMDs are unknown. Nevertheless, it is tempting to compare hypermethylated DMDs with the well characterized Long Range Epigenetic Silencing (LRES) phenomenon initially described in human colorectal cancer [48] and also found in murine tumors [72]. LRES appears as the concurrent hyper-methylation of multiple CpG islands and downregulation of most of the genes in a genomic re-gion ranging from hundreds of kilobases to a few megabases [73]. Although LRES was
discovered with the classical version of the AIMS method, our current data are insufficient to assimilate the differentially hypermethylated domains identified here to LRES. It should be noted that AIMS-Seq is not the most appropriate method to detect epigenetic changes affecting large chromosomal regions due to the interspersed nature of its genomic coverage. Specific re-gional analyses are required to clarify the nature of DMDs as it was done for LRES in different settings [48,71,72,74,75,76]. On the other hand, genome-wide approaches have identified large chromosomal domains undergoing extensive DNA hypomethylation in human colorectal can-cer [64,65]. In our setting, hypomethylation was relatively scarce and no large domains were detected. This may be due to the technical reasons, as the AIMS-Seq coverage is high in gene-rich regions and near the promoters (Fig 1and reference [35]), but low in gene poor regions and nuclear lamina associated domains where most of the hypomethylation occurs [64,65].
Concluding remarks
In summary, the AIMS-Seq approach appears as a sensitive and feasible tool to compare the epigenetic profiles of samples with very limited availability. Our analysis shows that DNA methylation changes along small intestine crypt differentiation and early stages of tumorigene-sis are few and small compared with late stages. Hypermethylations constitute the predominant change and are enriched in genomic regions related with gene regulation. Both processes ex-hibit highly overlapping panels of genes with DNA methylation changes; besides tumor related hypermethylation appears as a progressive phenomenon reaching deeper methylation levels in advanced stages. On the other hand, hypomethylation shows different signatures in differentia-tion and cancer and is already present in the non-tumor tissue adjacent to the adenomas in ApcMin/+mice, which is consistent with a role in the promotion of tumorigenesis [77,78].
Our findings may be also relevant to the comprehension of these processes and the underly-ing epigenetic mechanisms in the human counterpart. Different studies have pinpointed the parallelisms between mouse and human colorectal cancer at epigenetic level [33,72,79] and many of the genes we have found hypermethylated in early stages of mouse tumorigenesis (i.e., Lgr5,Axin2andEn1) may have potential clinical applications in human cancer [71,80,81].
Supporting Information
S1 Fig. Features of AIMS-Seq technique. A, Scheme of the AIMS-Seq technique.B, Represen-tation of the read coverage against amplicon length. To facilitate visualization, only 1,000 out of 50,745 amplicons have been plotted. Left panel shows the mean values obtained for the first set of samples (Fig 1A); right panel shows the results for the second set (Fig 1B).
(TIF)
S2 Fig. Bisulfite sequencing validation of differentially represented AIMS-Seq amplicons. Data for eight amplicons is shown. Genomic localization of the amplicons is shown. Graphs on the left show the number of normalized AIMS-Seq reads in each sample. The amplicon ID is shown on top f each graph. Logarithmic fold change values in base = 2 (log2FC) and False Dis-covery Rate (FDR) are indicated for each comparison (colon vs Ct26 and ISC vs differentiated cells). The results obtained with direct bisulfite sequencing are represented as lollipops using
the Methylation plotter tool (Mallona et al, 2014, reference [79]). Each circle represents a CpG dinucleotide and the degree of grey indicates the methylation level from fully methylated (black) to completely unmethylated (white). Sticks represent CpG sites not determined. Blue boxes identify XmaI sites corresponding to amplicon flanks. Colon: normal colon mucosa, ISC = Intestinal Stem Cell, Diff = Differentiated cells, CT26 colon cancer cell line. Data may be obtained from Tables J through R inS1 File.
(TIF)
S3 Fig. Differentially methylated genes. A, Overlap of hypermethylated genes as detected by AIMS-Seq. Only genes with one or more AIMS-Seq amplicons within 2Kb of the Transcription Start Site (TSS) are considered.B, Distribution of hypermethylated genes in adenomas (versus ISC) and CT26 cells (versus normal colon) and PRC2 targets.
(TIF)
S4 Fig. Features of differentially methylated amplicons. A, Density plot of AIMS-Seq ampli-cons according to their distance (log10 of bp) to the nearest enhancer region. Red line shows the distribution of all amplicons included in the virtual AIMS-seq universe. Black line shows the distribution of DMRs for each comparison as indicated in the graph. Statistical significance (p-value) for distribution of enhancers inside/outside DMRs, within 1Kb of the DMRs, and the Kolmogrov-Smirnov (KS) test are shown on top of each graph.B, Summary of the results: Enhancer associated hypermethylations and hypomethylations are enriched in the
indicated comparisons. (TIF)
S5 Fig. UCSC Genome Browser (NCBI37/mm9) representation of AIMS-Seq reads in two genomic regions displaying DNA methylation changes detected by AIMS-Seq (highlighted area) and associated with silencing of the respective gene (Lgr5andSt3gal3) during the dif-ferentiation process of ISCs.Whole genome bisulfite sequencing data from Kaaij et al. [25] is shown for comparison. Note small changes in DNA methylation levels in the boundaries of the amplicon.
(TIF)
S6 Fig. Differential DNA methylation and gene expression levels.Genes were classified ac-cording to its differential DNA methylation between CT26 and healthy colon tissue as deter-mined by AIMS-seq amplicons as follows: constant (no gains or losses of DNA methylation), hypermethylated and hypomethylated. Only genes with one or more AIMS-Seq amplicons within 2Kb of their Transcription Start Site were considered. CT26 hypermethylated genes showed a statistically significant downregulation in CT26 (Wilcoxon test, p<2.2e-16). No dif-ferences were observed for constant or hypomethylated genes.
(TIF)
S7 Fig. Differential DNA methylation of En1 CpG island shore detected by AIMS-Seq in in-testinal cancer.Each track indicates the number of reads mapped in AIMS-Seq amplicons. (TIF)
Differentiated vs ISC. Table K, Hypermethylated in Adenoma vs ISCs. Table L, Hypermethy-lated in Adenoma vs Differentiated. Table M, HypermethyHypermethy-lated in Adenoma vs Adjacent. Table N, Hypermethylated in CT26 vs Colon. Table O, Hypomethylated in Differentiated vs ISC. Table P, Hypomethylated in Adenoma vs ISCs. Table Q, Hypomethylated in Adenoma vs Differentiated cells. Table R, Hypomethylated in CT26 vs Colon. Table S, Functional enrich-ment of differentially methylated AIMS-Seq amplicons near TSS Genes. Table T, Differentially methylated domains (DMD). Table U, Functional enrichment in DMD R6.1.
(XLSX)
S2 File.Table A, Differential gene expression. Table B, Differential gene expression. Table C, Differential gene expression. Table D in S2 File. Differential gene expression. Table E, Differen-tial gene expression. Table F, DifferenDifferen-tial gene expression. Table G, DifferenDifferen-tial gene expres-sion. Table H, Differential gene expresexpres-sion. Table I, Differential gene expresexpres-sion. Table J, Differential gene expression. Table K, Functional enrichment in gene differential expression in intestinal cell differentiation and cancer. Table L, Gene expression/DNA methylation correla-tions. Table M, Hypermethylated regions associated with gene downregulation in Differentiat-ed versus ISC.
(XLSX)
Acknowledgments
We thank Anna Ferrer and Heinz Himmelbauer for assistance in next generation sequencing; Izaskun Mallona, Mònica Suelves and Victor Barrera for discussions and help in data analysis.
Author Contributions
Conceived and designed the experiments: MF MJ AB EB MAP. Performed the experiments: MF AMS MM EC MJ. Analyzed the data: MF ADV SL EC MJ MAP. Wrote the paper: MF MJ MAP.
References
1. Booth C, Potten CS. Gut instincts: thoughts on intestinal epithelial stem cells. J Clin Invest. 2000; 105: 1493–1499. PMID:10841502
2. Barker N, Ridgway RA, van Es JH, van de Wetering M, Begthel H, van den Born M, et al. Crypt stem cells as the cells-of-origin of intestinal cancer. Nature. 2009; 457: 608–611. doi:10.1038/nature07602
PMID:19092804
3. Sato T, Vries RG, Snippert HJ, van de Wetering M, Barker N, Stange DE, et al. Single Lgr5 stem cells build crypt-villus structures in vitro without a mesenchymal niche. Nature. 2009; 459: 262–265. doi:10. 1038/nature07935PMID:19329995
4. Buczacki SJ, Zecchini HI, Nicholson AM, Russell R, Vermeulen L, Kemp R, et al. Intestinal label-retain-ing cells are secretory precursors expresslabel-retain-ing Lgr5. Nature. 2013; 495: 65–69. doi:10.1038/
nature11965PMID:23446353
5. Jung P, Sato T, Merlos-Suarez A, Barriga FM, Iglesias M, Rossell D, et al. Isolation and in vitro expan-sion of human colonic stem cells. Nature Medicine. 2011; 17: 1225–1227. doi:10.1038/nm.2470PMID:
21892181
6. Ootani A, Li X, Sangiorgi E, Ho QT, Ueno H, Toda S, et al. Sustained in vitro intestinal epithelial culture within a Wnt-dependent stem cell niche. Nature Medicine. 2009; 15: 701–706. doi:10.1038/nm.1951
PMID:19398967
7. Merlos-Suarez A, Barriga FM, Jung P, Iglesias M, Cespedes MV, Rossell D, et al. The intestinal stem cell signature identifies colorectal cancer stem cells and predicts disease relapse. Cell Stem Cell. 2011; 8: 511–524. doi:10.1016/j.stem.2011.02.020PMID:21419747
8. Montgomery RK, Carlone DL, Richmond CA, Farilla L, Kranendonk ME, Henderson DE, et al. Mouse telomerase reverse transcriptase (mTert) expression marks slowly cycling intestinal stem cells.
Proceedings of the National Academy of Sciences of the United States of America. 2011; 108: 179– 184. doi:10.1073/pnas.1013004108PMID:21173232
9. Powell AE, Wang Y, Li Y, Poulin EJ, Means AL, Washington MK, et al. The pan-ErbB negative regulator Lrig1 is an intestinal stem cell marker that functions as a tumor suppressor. Cell. 2012; 149: 146–158. doi:10.1016/j.cell.2012.02.042PMID:22464327
10. Sangiorgi E, Capecchi MR. Bmi1 is expressed in vivo in intestinal stem cells. Nature Genetics. 2008; 40: 915–920. doi:10.1038/ng.165PMID:18536716
11. Takeda N, Jain R, LeBoeuf MR, Wang Q, Lu MM, Epstein JA. Interconversion between intestinal stem cell populations in distinct niches. Science. 2011; 334: 1420–1424. doi:10.1126/science.1213214
PMID:22075725
12. Tian H, Biehs B, Warming S, Leong KG, Rangell L, Klein OD, et al. A reserve stem cell population in small intestine renders Lgr5-positive cells dispensable. Nature. 2011; 478: 255–259. doi:10.1038/ nature10408PMID:21927002
13. Yan KS, Chia LA, Li X, Ootani A, Su J, Lee JY, et al. The intestinal stem cell markers Bmi1 and Lgr5 identify two functionally distinct populations. Proc Natl Acad Sci USA. 2012; 109: 466–471. doi:10. 1073/pnas.1118857109PMID:22190486
14. Zhu L, Gibson P, Currle DS, Tong Y, Richardson RJ, Bayazitov IT, et al. Prominin 1 marks intestinal stem cells that are susceptible to neoplastic transformation. Nature. 2009; 457: 603–607. doi:10.1038/ nature07589PMID:19092805
15. Antequera F. Structure, function and evolution of CpG island promoters. Cell Mol Life Sci. 2003; 60: 1647–1658. PMID:14504655
16. Ziller MJ, Gu H, Muller F, Donaghey J, Tsai LT, Kohlbacher O, et al. Charting a dynamic DNA methyla-tion landscape of the human genome. Nature. 2013; 500: 477–481. doi:10.1038/nature12433PMID:
23925113
17. Jackson M, Krassowska A, Gilbert N, Chevassut T, Forrester L, Ansell J, et al. Severe global DNA hypomethylation blocks differentiation and induces histone hyperacetylation in embryonic stem cells. Molec Cell Biol. 2004; 24: 8862–8871. PMID:15456861
18. Smith ZD, Meissner A. DNA methylation: roles in mammalian development. Nature Rev Genetics. 2013; 14: 204–220.
19. Meissner A, Mikkelsen TS, Gu H, Wernig M, Hanna J, Sivachenko A, et al. Genome-scale DNA methyl-ation maps of pluripotent and differentiated cells. Nature. 2008; 454: 766–770. doi:10.1038/
nature07107PMID:18600261
20. Ji H, Ehrlich LIR, Seita J, Murakami P, Doi A, Lindau P, et al. Comprehensive methylome map of line-age commitment from haematopoietic progenitors. Nature. 2010; 467: 338–342. doi:10.1038/ nature09367PMID:20720541
21. Bock C, Beerman I, Lien WH, Smith ZD, Gu H, Boyle P, et al. DNA methylation dynamics during in vivo differentiation of blood and skin stem cells. Mol Cell. 2012; 47: 633–647. doi:10.1016/j.molcel.2012.06. 019PMID:22841485
22. Cortese R, Lewin J, Backdahl L, Krispin M, Wasserkort R, Eckhardt F, et al. Genome-wide screen for differential DNA methylation associated with neural cell differentiation in mouse. PLoS ONE. 2011; 6: e26002. doi:10.1371/journal.pone.0026002PMID:22028803
23. Sheaffer KL, Kim R, Aoki R, Elliott EN, Schug J, Burger L, et al. DNA methylation is required for the con-trol of stem cell differentiation in the small intestine. Genes Dev. 2014; 28: 652–664. doi:10.1101/gad. 230318.113PMID:24637118
24. Yatabe Y, Tavare S, Shibata D. Investigating stem cells in human colon by using methylation patterns. Proc Natl Acad Sci U S A. 2001; 98: 10839–10844. PMID:11517339
25. Kaaij LT, van de Wetering M, Fang F, Decato B, Molaro A, van de Werken HJ, et al. DNA methylation dynamics during intestinal stem cell differentiation reveals enhancers driving gene expression in the vil-lus. Genome Biol. 2013; 14: R50. doi:10.1186/gb-2013-14-5-r50PMID:23714178
26. Feinberg AP, Tycko B. The history of cancer epigenetics. Nat Rev Cancer. 2004; 4: 143–153. PMID:
14732866
27. Ehrlich M. DNA hypomethylation in cancer cells. Epigenomics. 2009; 1: 239–259. doi:10.2217/epi.09. 33PMID:20495664
28. Jones PA, Baylin SB. The epigenomics of cancer. Cell. 2007; 128: 683–692. PMID:17320506
30. Irizarry RA, Ladd-Acosta C, Wen B, Wu Z, Montano C, Onyango P, et al. The human colon cancer methylome shows similar hypo- and hypermethylation at conserved tissue-specific CpG island shores. Nat Genet. 2009; 41: 178–186. doi:10.1038/ng.298PMID:19151715
31. Graham TA, Humphries A, Sanders T, Rodriguez-Justo M, Tadrous PJ, Preston SL, et al. Use of meth-ylation patterns to determine expansion of stem cell clones in human colon tissue. Gastroenterology. 2011; 140: 1241–1250 e1241–1249. doi:10.1053/j.gastro.2010.12.036PMID:21192938
32. Vermeulen L, Snippert HJ. Stem cell dynamics in homeostasis and cancer of the intestine. Nature Re-views in Cancer. 2014; 14: 468–480.
33. Grimm C, Chavez L, Vilardell M, Farrall AL, Tierling S, Bohm JW, et al. DNA-methylome analysis of mouse intestinal adenoma identifies a tumour-specific signature that is partly conserved in human colon cancer. PLoS Genet. 2013; 9: e1003250. doi:10.1371/journal.pgen.1003250PMID:23408899
34. Rodilla V, Villanueva A, Obrador-Hevia A, Robert-Moreno A, Fernandez-Majada V, Grilli A, et al. Jag-ged1 is the pathological link between Wnt and Notch pathways in colorectal cancer. Proc Natl Acad Sci USA. 2009; 106: 6315–6320. doi:10.1073/pnas.0813221106PMID:19325125
35. Frigola J, Ribas M, Risques RA, Peinado MA. Methylome profiling of cancer cells by amplification of inter- methylated sites (AIMS). Nucleic Acids Res. 2002; 30: e28. PMID:11917034
36. Jorda M, Rodriguez J, Frigola J, Peinado MA. Analysis of DNA methylation by amplification of inter-methylated sites (AIMS). Methods Mol Biol. 2009; 507: 107–116. doi:10.1007/978-1-59745-522-0_9
PMID:18987810
37. Langmead B, Trapnell C, Pop M, Salzberg SL. Ultrafast and memory-efficient alignment of short DNA sequences to the human genome. Genome Biol. 2009; 10: R25. doi:10.1186/gb-2009-10-3-r25PMID:
19261174
38. Anders S, Huber W. Differential expression analysis for sequence count data. Genome Biol. 2010; 11: R106. doi:10.1186/gb-2010-11-10-r106PMID:20979621
39. Olshen AB, Venkatraman ES, Lucito R, Wigler M. Circular binary segmentation for the analysis of array-based DNA copy number data. Biostatistics. 2004; 5: 557–572. PMID:15475419
40. Smyth GK (2005) Limma: linear models for microarray data. In: Gentleman R, Carey V, Dudoit S, Iri-zarry R, Huber W, editors. Bioinformatics and Computational Biology Solutions Using R and Biocon-ductor. New York: Springer. pp. 397–420.
41. Huang da W, Sherman BT, Lempicki RA. Systematic and integrative analysis of large gene lists using DAVID bioinformatics resources. Nat Protoc. 2009; 4: 44–57. doi:10.1038/nprot.2008.211PMID:
19131956
42. Hon GC, Rajagopal N, Shen Y, McCleary DF, Yue F, Dang MD, et al. Epigenetic memory at embryonic enhancers identified in DNA methylation maps from adult mouse tissues. Nature Genetics. 2013; 45: 1198–1206. doi:10.1038/ng.2746PMID:23995138
43. Esteller M. Cancer epigenomics: DNA methylomes and histone-modification maps. Nature Rev Genet. 2007; 8: 286–298. PMID:17339880
44. Laird PW. Principles and challenges of genome-wide DNA methylation analysis. Nat Rev Genet. 2010; 11: 191–203. doi:10.1038/nrg2732PMID:20125086
45. Jorda M, Peinado MA. Methods for DNA methylation analysis and applications in colon cancer. Mutat Res. 2010; 693: 84–93. doi:10.1016/j.mrfmmm.2010.06.010PMID:20599551
46. Brunner AL, Johnson DS, Kim SW, Valouev A, Reddy TE, Neff NF, et al. Distinct DNA methylation pat-terns characterize differentiated human embryonic stem cells and developing human fetal liver. Ge-nome Res. 2009; 19: 1044–1056. doi:10.1101/gr.088773.108PMID:19273619
47. Frigola J, Muñoz M, Clark SJ, Moreno V, Capella G, Peinado MA. Hypermethylation of the prostacyclin synthase (PTGIS) promoter is a frequent event in colorectal cancer and associated with aneuploidy. Oncogene. 2005; 24: 7320–7326. PMID:16007128
48. Frigola J, Song J, Stirzaker C, Hinshelwood RA, Peinado MA, Clark S. Epigenetic remodeling in colo-rectal cancer results in coordinate gene suppression across an entire chromosome band. Nature Genet. 2006; 38: 540–549. PMID:16642018
49. Paz MF, Wei S, Cigudosa JC, Rodriguez-Perales S, Peinado MA, Huang TH, et al. Genetic unmasking of epigenetically silenced tumor suppressor genes in colon cancer cells deficient in DNA methyltrans-ferases. Hum Mol Genet. 2003; 12: 2209–2219. PMID:12915469
50. Rodriguez J, Frigola J, Vendrell E, Risques RA, Fraga MF, Morales C, et al. Chromosomal instability correlates with genome-wide DNA demethylation in human primary colorectal cancers. Cancer Res. 2006; 66: 8462–9468. PMID:16951157
51. Frigola J, Sole X, Paz MF, Moreno V, Esteller M, Capella G, et al. Differential DNA hypermethylation and hypomethylation signatures in colorectal cancer. Hum Mol Genet. 2005; 14: 319–326. PMID:
15574462
52. Sadikovic B, Haines TR, Butcher DT, Rodenhiser DI. Chemically induced DNA hypomethylation in breast carcinoma cells detected by the amplification of intermethylated sites. Breast Cancer Res. 2004; 6: R329–337. PMID:15217500
53. Fraga MF, Ballestar E, Paz MF, Ropero S, Setien F, Ballestar ML, et al. Epigenetic differences arise during the lifetime of monozygotic twins. Proc Natl Acad Sci U S A. 2005; 102: 10604–10609. PMID:
16009939
54. Wang Y, Jorda M, Jones PL, Maleszka R, Ling X, Robertson HM, et al. Functional CpG methylation system in a social insect. Science. 2006; 314: 645–647. PMID:17068262
55. Irizarry RA, Wu H, Feinberg AP. A species-generalized probabilistic model-based definition of CpG is-lands. Mamm Genome. 2009; 30: 674–680.
56. Barrera V, Peinado MA. Evaluation of single CpG sites as proxies of CpG island methylation states at the genome scale. Nucleic Acids Res. 2012; 40: 11490–11498. doi:10.1093/nar/gks928PMID:
23066096
57. Stadler MB, Murr R, Burger L, Ivanek R, Lienert F, Scholer A, et al. DNA-binding factors shape the mouse methylome at distal regulatory regions. Nature. 2011; 480: 490–495. doi:10.1038/nature10716
PMID:22170606
58. Carrió E, Díez-Villanueva A, Lois S, Mallona I, Cases I, Forn M, et al. Deconstruction of DNA methyla-tion patterns during myogenesis reveals specific epigenetic events in the establishment of the skeletal muscle lineage. Stem Cells. 2015; in press.
59. Ong CT, Corces VG. Enhancers: emerging roles in cell fate specification. EMBO Rep. 2012; 13: 423–430. doi:10.1038/embor.2012.52PMID:22491032
60. Chandra S, Baribault C, Lacey M, Ehrlich M. Myogenic differential methylation: diverse associations with chromatin structure. Biology (Basel). 2014; 3: 426–451. doi:10.3390/biology3020426PMID:
24949935
61. Taberlay PC, Statham AL, Kelly TK, Clark SJ, Jones PA. Reconfiguration of nucleosome-depleted re-gions at distal regulatory elements accompanies DNA methylation of enhancers and insulators in can-cer. Genome Research. 2014; 24: 1421–1432. doi:10.1101/gr.163485.113PMID:24916973
62. Kulis M, Heath S, Bibikova M, Queiros AC, Navarro A, Clot G, et al. Epigenomic analysis detects wide-spread gene-body DNA hypomethylation in chronic lymphocytic leukemia. Nature Genetics. 2012; 44: 1236–1242. doi:10.1038/ng.2443PMID:23064414
63. Aran D, Sabato S, Hellman A. DNA methylation of distal regulatory sites characterizes dysregulation of cancer genes. Genome Biol. 2013; 14: R21. doi:10.1186/gb-2013-14-3-r21PMID:23497655
64. Berman BP, Weisenberger DJ, Aman JF, Hinoue T, Ramjan Z, Liu Y, et al. Regions of focal DNA hyper-methylation and long-range hypohyper-methylation in colorectal cancer coincide with nuclear lamina-associated domains. Nature Genetics. 2012; 44: 40–46. doi:10.1038/ng.969PMID:22120008
65. Hansen KD, Timp W, Bravo HC, Sabunciyan S, Langmead B, McDonald OG, et al. Increased methyla-tion variamethyla-tion in epigenetic domains across cancer types. Nature Genetics. 2011; 43: 768–775. doi:10. 1038/ng.865PMID:21706001
66. Issa JP, Ahuja N, Toyota M, Bronner MP, Brentnall TA. Accelerated age-related CpG island methyla-tion in ulcerative colitis. Cancer Res. 2001; 61: 3573–3577. PMID:11325821
67. Yamada Y, Mori H. Multistep carcinogenesis of the colon in Apc(Min/+) mouse. Cancer Sci. 2007; 98: 6–10. PMID:17052257
68. Moser AR, Dove WF, Roth KA, Gordon JI. The Min (multiple intestinal neoplasia) mutation: its effect on gut epithelial cell differentiation and interaction with a modifier system. J Cell Biol. 1992; 116: 1517–1526. PMID:1541640
69. McCabe MT, Lee EK, Vertino PM. A multifactorial signature of DNA sequence and polycomb binding predicts aberrant CpG island methylation. Cancer Res. 2009; 69: 282–291. doi:10.1158/0008-5472. CAN-08-3274PMID:19118013
70. Ben-Porath I, Thomson MW, Carey VJ, Ge R, Bell GW, Regev A, et al. An embryonic stem cell-like gene expression signature in poorly differentiated aggressive human tumors. Nat Genet. 2008; 40: 499–507. doi:10.1038/ng.127PMID:18443585
71. Mayor R, Casadome L, Azuara D, Moreno V, Clark SJ, Capella G, et al. Long-range epigenetic silenc-ing at 2q14.2 affects most human colorectal cancers and may have application as a non-invasive bio-marker of disease. Br J Cancer. 2009; 100: 1534–1539. doi:10.1038/sj.bjc.6605045PMID:19384295
72. Forn M, Munoz M, Tauriello DV, Merlos-Suarez A, Rodilla V, Bigas A, et al. Long range epigenetic si-lencing is a trans-species mechanism that results in cancer specific deregulation by overriding the chro-matin domains of normal cells. Mol Oncol. 2013; 7: 1129–1141. doi:10.1016/j.molonc.2013.08.008
73. Clark SJ. Action at a distance: epigenetic silencing of large chromosomal regions in carcinogenesis. Hum Mol Genet. 2007; 16 Spec No 1: R88–95. PMID:17613553
74. Javierre BM, Rodriguez-Ubreva J, Al-Shahrour F, Corominas M, Grana O, Ciudad L, et al. Long-range epigenetic silencing associates with deregulation of Ikaros targets in colorectal cancer cells. Mol Can-cer Res. 2011; 9: 1139–1151. doi:10.1158/1541-7786.MCR-10-0515PMID:21737484
75. Coolen MW, Stirzaker C, Song JZ, Statham AL, Kassir Z, Moreno CS, et al. Consolidation of the cancer genome into domains of repressive chromatin by long-range epigenetic silencing (LRES) reduces tran-scriptional plasticity. Nat Cell Biol. 2010; 12: 235–246. doi:10.1038/ncb2023PMID:20173741
76. Rodriguez J, Muñoz M, Vives L, Frangou CG, Groudine M, Peinado MA. Bivalent domains enforce tran-scriptional memory of DNA methylated genes in cancer cells. Proc Natl Acad Sci U S A. 2008; 105: 19809–19814. doi:10.1073/pnas.0810133105PMID:19060200
77. Eden A, Gaudet F, Waghmare A, Jaenisch R. Chromosomal instability and tumors promoted by DNA hypomethylation. Science. 2003; 300: 455. PMID:12702868
78. Gaudet F, Graeme JG, Eden A, Jackson-Grusby L, Dausman J, Gray JW, et al. Induction of tumors in mice by genomic hypomethylation. Science. 2003; 300: 489–492. PMID:12702876
79. Steine EJ, Ehrich M, Bell GW, Raj A, Reddy S, van Oudenaarden A, et al. Genes methylated by DNA methyltransferase 3b are similar in mouse intestine and human colon cancer. J Clin Invest. 2011; 121: 1748–1752. doi:10.1172/JCI43169PMID:21490393
80. de Sousa EMF, Colak S, Buikhuisen J, Koster J, Cameron K, de Jong JH, et al. Methylation of cancer-stem-cell-associated Wnt target genes predicts poor prognosis in colorectal cancer patients. Cell Stem Cell. 2011; 9: 476–485. doi:10.1016/j.stem.2011.10.008PMID:22056143
81. Muto Y, Maeda T, Suzuki K, Kato T, Watanabe F, Kamiyama H, et al. DNA methylation alterations of AXIN2 in serrated adenomas and colon carcinomas with microsatellite instability. BMC Cancer. 2014; 14: 466. doi:10.1186/1471-2407-14-466PMID:24964857
82. Merlos-Suarez A, Batlle E. Eph-ephrin signalling in adult tissues and cancer. Current Op Cell Biol. 2008; 20: 194–200. doi:10.1016/j.ceb.2008.01.011PMID:18353626
83. Mallona I, Diez-Villanueva A, Peinado MA. Methylation plotter: a web tool for dynamic visualization of DNA methylation data. Source Code Biol Med. 2014; 9: 11. doi:10.1186/1751-0473-9-11PMID:
25260021
84. Supek F, Bosnjak M, Skunca N, Smuc T. REVIGO summarizes and visualizes long lists of gene ontolo-gy terms. PLoS ONE. 2011; 6: e21800. doi:10.1371/journal.pone.0021800PMID:21789182