ACPD
13, 15409–15441, 2013Global carbon monoxide products
J. X. Warner et al.
Title Page
Abstract Introduction
Conclusions References
Tables Figures
◭ ◮
◭ ◮
Back Close
Full Screen / Esc
Printer-friendly Version Interactive Discussion
Discussion
P
a
per
|
Dis
cussion
P
a
per
|
Discussion
P
a
per
|
Discussio
n
P
a
per
Atmos. Chem. Phys. Discuss., 13, 15409–15441, 2013 www.atmos-chem-phys-discuss.net/13/15409/2013/ doi:10.5194/acpd-13-15409-2013
© Author(s) 2013. CC Attribution 3.0 License.
Atmospheric Chemistry and Physics
Open Access
Discussions
Geoscientiic Geoscientiic
Geoscientiic Geoscientiic
This discussion paper is/has been under review for the journal Atmospheric Chemistry and Physics (ACP). Please refer to the corresponding final paper in ACP if available.
Global carbon monoxide products from
combined AIRS, TES and MLS
measurements on A-train satellites
J. X. Warner1, R. Yang1, Z. Wei1, F. Carminati1,5,7, A. Tangborn2, Z. Sun3, W. Lahoz4,5, J.-L. Atti ´e5,6,7, L. El Amraoui5, and B. Duncan8
1
Department of Atmospheric & Oceanic Science, University of Maryland, 3433 Computer & Space Sciences Bldg, College Park, MD, USA
2
Joint Center for Earth Systems Technology, University of Maryland Baltimore County, Baltimore, MD, USA
3
Universities Space Research Association, 10211 Wincopin Circle, Columbia, MD 21044, USA 4
Norwegian Institute of Air Research, Instituttveien 18, Kjeller 2027, Norway 5
CNRM-GAME, M ´et ´eo-France and CNRS, UMR3589, Toulouse, France 6
Laboratoire d’A ´erologie, CNRS, UMR5560, Toulouse, France 7
Universit ´e de Toulouse, Toulouse, France 8
ACPD
13, 15409–15441, 2013Global carbon monoxide products
J. X. Warner et al.
Title Page
Abstract Introduction
Conclusions References
Tables Figures
◭ ◮
◭ ◮
Back Close
Full Screen / Esc
Printer-friendly Version Interactive Discussion
Discussion
P
a
per
|
Dis
cussion
P
a
per
|
Discussion
P
a
per
|
Discussio
n
P
a
per
|
Received: 6 April 2013 – Accepted: 22 May 2013 – Published: 11 June 2013
Correspondence to: J. X. Warner ([email protected])
ACPD
13, 15409–15441, 2013Global carbon monoxide products
J. X. Warner et al.
Title Page
Abstract Introduction
Conclusions References
Tables Figures
◭ ◮
◭ ◮
Back Close
Full Screen / Esc
Printer-friendly Version Interactive Discussion
Discussion
P
a
per
|
Dis
cussion
P
a
per
|
Discussion
P
a
per
|
Discussio
n
P
a
per
Abstract
This study tests a novel methodology to add value to satellite datasets. This method-ology, data fusion, is similar to data assimilation, except that the background model-based field is replaced by a satellite dataset, in this case AIRS (Atmospheric Infrared Sounder) carbon monoxide (CO) measurements. The observational information comes 5
from CO measurements with lower spatial coverage than AIRS, namely, from TES (Tro-pospheric Emission Spectrometer) and MLS (Microwave Limb Sounder). We show that combining these datasets with data fusion uses the higher spectral resolution of TES to extend AIRS CO observational sensitivity to the lower troposphere, a region especially important for air quality studies. We also show that combined CO measurements from 10
AIRS and MLS provide enhanced information in the UTLS (upper troposphere/lower stratosphere) region compared to each product individually. The combined AIRS/TES and AIRS/MLS CO products are validated against DACOM (differential absorption mid-IR diode laser spectrometer) in situ CO measurements from the INTEX-B (Interconti-nental Chemical Transport Experiment: MILAGRO and Pacific phases) field campaign 15
and in situ data from HIPPO (HIAPER Pole-to-Pole Observations) flights. The data fu-sion results show improved sensitivities in the lower and upper troposphere (20–30% and above 20 %, respectively) as compared with AIRS-only retrievals, and improved coverage compared with TES and MLS CO data.
1 Introduction
20
Atmospheric carbon monoxide (CO) is simultaneously measured by three EOS (Earth Observing System) “A-train” satellite sensors: AIRS (Atmospheric Infrared Sounder) (Aumann et al., 2003) on Aqua, and TES (Tropospheric Emission Spectrometer) (Beer et al., 2006), and MLS (Microwave Limb Sounder) (Waters et al., 2006) on Aura. Based on the heritage of the A-train system with individual sensors taking measurements 25
ACPD
13, 15409–15441, 2013Global carbon monoxide products
J. X. Warner et al.
Title Page
Abstract Introduction
Conclusions References
Tables Figures
◭ ◮
◭ ◮
Back Close
Full Screen / Esc
Printer-friendly Version Interactive Discussion
Discussion
P
a
per
|
Dis
cussion
P
a
per
|
Discussion
P
a
per
|
Discussio
n
P
a
per
|
from these sensors are expected to provide three-dimensional composition informa-tion that incorporates the uniqueness of AIRS large spatial coverage, TES high spec-tral resolution, and MLS measurements in the upper troposphere and stratosphere. AIRS trace gas retrieval products provide high-density twice-daily global coverage with spatial resolution at 45×45 km2at 01:30 a.m. and 01:30 p.m. local time overpasses. 5
However, as in the case of other nadir sounders, it lacks sensitivity for vertical structures in the UTLS (Upper Troposphere and Lower Stratosphere) regions for most chemical species. The Aura limb sounders (TES and MLS), on the other hand, possess the ad-vantage of high vertical resolution in the UTLS region but lack horizontal coverage. We seek to combine these two types of CO datasets to provide more detail in both vertical 10
structures and global coverage. This fused dataset will benefit studies of stratosphere troposphere exchange and the chemical and dynamical structures of the UTLS and TTL (Tropical Tropopause Layer) regions as CO is a transport tracer and has markedly different concentrations in the troposphere and the stratosphere.
Interactions between dynamics and chemistry in the region of the extratropical 15
tropopause play a significant role in chemistry-climate coupling. Concentrations of sev-eral radiatively significant trace constituents, such as ozone and water vapor, change rapidly across the tropopause. Their gradients and variability in this region are con-trolled by their respective sources and sinks and the mixing and exchange between the stratosphere and the troposphere. The CO-Ozone correlation has been used exten-20
sively in the UTLS region as a diagnostic tool for extratropical tropopause processes, and stratosphere troposphere exchange and mixing (e.g., Zahn and Brenninkmeijer, 2003; Hoor et al., 2002, 2004; Pan et al., 2004, 2007a, b). UTLS dynamics and trans-port studies will greatly benefit from trace gas datasets that show detailed structures of CO plumes, have high-density daily global coverage, and provide information for an 25
extended time period (∼10 yr).
con-ACPD
13, 15409–15441, 2013Global carbon monoxide products
J. X. Warner et al.
Title Page
Abstract Introduction
Conclusions References
Tables Figures
◭ ◮
◭ ◮
Back Close
Full Screen / Esc
Printer-friendly Version Interactive Discussion
Discussion
P
a
per
|
Dis
cussion
P
a
per
|
Discussion
P
a
per
|
Discussio
n
P
a
per
tinents and affect AQ at remote locations (Lin et al., 2011). Satellite measurements are among the most effective ways to monitor air pollution and the related transport due to the relatively high spatial and temporal coverage. CO is a good tracer of pollution emission and transport in the troposphere owing to its lifetime of 1–3 months (Crutzen and Zimmermann, 1991; Sze, 1977). In this study, we focus on CO measurements. We 5
show that fusing of CO data from multiple sensors in space can benefit both air quality and climate studies.
In the following sections, we present the data fusion approach that we use to com-bine AIRS, TES, and MLS CO datasets, with TES and MLS CO as observations and AIRS CO retrievals as the instantaneous background field. We also show that the com-10
bined dataset provides a 3-D CO field with daily global coverage that incorporates the sensitivity from AIRS primarily in the mid-troposphere, TES in the lower troposphere, and MLS in the UTLS. Section 2 introduces the datasets that we use in this study, and Sect. 3 describes the data fusion methodology. Section 4 presents results and their validation, while Sect. 5 provides discussion and a summary of this study.
15
2 Observational data sets
The AIRS instrument on Aqua was launched in 2002 with the primary goal of deter-mining the vertical profiles of temperature and water vapor in the Earth’s atmosphere (Aumann et al., 2003). CO retrievals are obtained from the 2160–2200 cm−1 portion of the spectrum on the edge of the 1–0 vibration-rotation band of CO (McMillan et al., 20
2005). The AIRS main CO sensitivity is broad and centered in the mid troposphere be-tween approximately 300–600 hPa (Warner et al., 2007). AIRS science team retrieval codes are used to determine the physical parameters measured by AIRS such as tem-perature, water vapor, and ozone (Susskind et al., 2003).
The TES instrument is an imaging infrared Fourier Transform Spectrometer with both 25
nadir and limb-viewing capability covering the spectral range 650–3050 cm−1
ACPD
13, 15409–15441, 2013Global carbon monoxide products
J. X. Warner et al.
Title Page
Abstract Introduction
Conclusions References
Tables Figures
◭ ◮
◭ ◮
Back Close
Full Screen / Esc
Printer-friendly Version Interactive Discussion
Discussion
P
a
per
|
Dis
cussion
P
a
per
|
Discussion
P
a
per
|
Discussio
n
P
a
per
|
resolutions compared to AIRS; however, the global coverage of TES is significantly lower (Luo et al., 2002, 2007). This is partly due to the fact that, in addition to the sensors’ respective swath widths, AIRS uses a cloud-clearing scheme that recovers, on the average, more than half of the cloudy pixels, which increases the global coverage of the retrievals significantly (Susskind et al., 2003).
5
MLS on Aura satellite was launched on 15 July 2004 and placed into a near-polar Earth orbit at∼705 km with an inclination of 98◦and an ascending node at 13:45 h lo-cal time. It makes about 14 orbits per day. The MLS instrument onboard Aura uses the microwave limb sounding technique to measure chemical constituents and dynamical tracers between the upper troposphere and the lower mesosphere. It provides dense 10
spatial coverage with 3500 profiles daily between 82◦N and 82◦S. The standard
re-trievals for CO are given between 215 and 0.46 hPa with a vertical resolution of∼3km in the upper troposphere and the stratosphere. The along-track resolution of CO is ∼200 km between 215 and 10 hPa. The estimated single-profile precision in the ex-tra tropical UTLS is of the order of 0.04 ppmv (parts per million volume) from 215 to 15
100 hPa and between 0.05 and 0.2 ppmv from 46 to 10 hPa (Livesey et al., 2007; Read et al., 2007; Jiang et al., 2007).
3 Methodology
The data fusion methodology in this study takes a similar approach to that used in data assimilation (Kalnay, 2003) except we use AIRS measurements as the background 20
field and other measurements with lower spatial coverage (in this case, TES and MLS) as the observations. We assume that the AIRS data represent a snapshot of a three dimensional geophysical field analogous to a model output. We do not attempt to eval-uate any time variability in the CO field, but to simply combine a number of measure-ments taken within a short time period (15–30 min). A major difference between this 25
formu-ACPD
13, 15409–15441, 2013Global carbon monoxide products
J. X. Warner et al.
Title Page
Abstract Introduction
Conclusions References
Tables Figures
◭ ◮
◭ ◮
Back Close
Full Screen / Esc
Printer-friendly Version Interactive Discussion
Discussion
P
a
per
|
Dis
cussion
P
a
per
|
Discussion
P
a
per
|
Discussio
n
P
a
per
lation identical to the Kalman filter method, commonly used in data assimilation (e.g. Lahoz et al., 2010), except we exclude the transport by model dynamics.
The diagram in Fig. 1 illustrates the data fusion system, where we start with AIRS operational V5 L2 retrievals, shown on the upper left corner, as the background. Other products, such as TES or MLS, are added to the Kalman filter process as observa-5
tions where the relative weighting is influenced by the error covariance from AIRS and TES or MLS retrievals. The output from the analysis provides a three-dimensional field that incorporates measurements from AIRS, TES, and MLS. The population of the profiles on the horizontal plane is determined primarily by the observed variances from the background field provided by AIRS. We show that in the vertical region (lower 10
troposphere and the UTLS) where AIRS has low measurement sensitivity, the AIRS retrievals still provide the correct spatial variability (or spatial patterns), even when they cannot reproduce the correct CO magnitude. This system does not require a model to constrain the physics of the geophysical fields, but rather uses AIRS continuous measurements to constrain the spatial and temporal variability of the TES and MLS 15
measurements.
The Kalman filter algorithm in general form is as follows
Xa=Xb+K(Xo−HXb) (1)
where
K=PbHT(HPbHT+R)−1 (2)
20
and whereKis the gain matrix, H is the linear observation operator which maps the background state into the observational space,Pbis the background error covariance. The analysis state vectorXais the new estimate of the state vector, which has the same dimension as the background field (Xb), i.e. the current size of the AIRS vector. The size of the observation vectorXois determined by the size of assimilated observations 25
ACPD
13, 15409–15441, 2013Global carbon monoxide products
J. X. Warner et al.
Title Page
Abstract Introduction
Conclusions References
Tables Figures
◭ ◮
◭ ◮
Back Close
Full Screen / Esc
Printer-friendly Version Interactive Discussion
Discussion
P
a
per
|
Dis
cussion
P
a
per
|
Discussion
P
a
per
|
Discussio
n
P
a
per
|
TES CO. Since the variable amount is manageable and R is assumed diagonal, we
compute the inverse matrix in the gain matrix (i.e.,K) directly.
When we apply this data fusion algorithm, Pb is the error covariance for the AIRS satellite retrievals. Satellite observations are often treated as spatially uncorrelated in data assimilation systems, but this is not strictly accurate (Talagrand, 1997). In the 5
application of the data fusion technique, we assume a simple spatially decaying corre-lation that can be easily tuned by changing the correcorre-lation length scale, and comparing the results with in-situ data.
The background error covariancePb, consists of not only the correlation information between any two variables (at different locations) in the background state vector, but 10
also the covariance matrices of the AIRS retrievals. It is defined as:
Pb=D1/2CD1/2 (3)
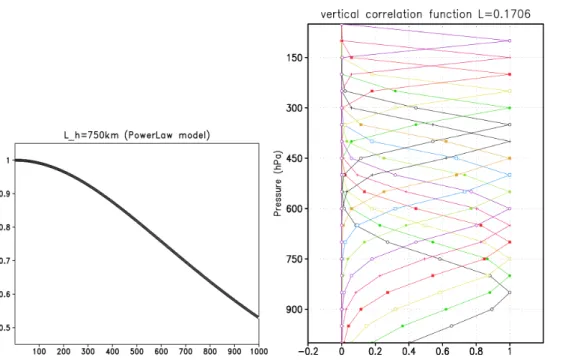
where C is the matrix containing the correlations and D is the matrix containing the variances of the analyzed species (El Amraoui et al., 2004). Here C stands for the covariance between two grid points. We model the terms of C with the quantity 15
Ci,j =σiσjρhρv, where σi and σi are the standard deviations of background error at locationi andj respectively,ρhis the horizontal correlation model, andρv is the verti-cal correlation model. We use the power law for theρh model as shown in Fig. 2 (left
panel) (Dee and da Silva, 1999),
ρh=
1+1
2 r
Lo
(4) 20
wherer is the horizontal distance between two locations (i,j), andL0is the prescribed
horizontal error correlation length.
The vertical resolution of the analysis for the combined AIRS and TES CO is based on the AIRS pressure grid in the troposphere; whereas the vertical resolution of the analysis for AIRS and MLS CO is based on the AIRS pressure grid in the stratosphere 25
ACPD
13, 15409–15441, 2013Global carbon monoxide products
J. X. Warner et al.
Title Page
Abstract Introduction
Conclusions References
Tables Figures
◭ ◮
◭ ◮
Back Close
Full Screen / Esc
Printer-friendly Version Interactive Discussion
Discussion
P
a
per
|
Dis
cussion
P
a
per
|
Discussion
P
a
per
|
Discussio
n
P
a
per
combined CO (left columns) and the AIRS and MLS combined CO (right columns). These pressure levels are fixed except for near the surface. The vertical correlation model for AIRS and TES is shown in Fig. 2 (right panel) in the form
ρv=exp(−∆y2), (5)
where 5
∆y=lnPn−lnPl
Lz . (6)
Pn and Pl are the pressure values at level nand l; and Lz is the prescribed vertical error correlation length (Daley and Barker, 2000).
In the examples given in Fig. 2, the horizontal correlation lengthL0=750 km and the
vertical correlation lengthLz=0.17 were chosen to match the measurement character-10
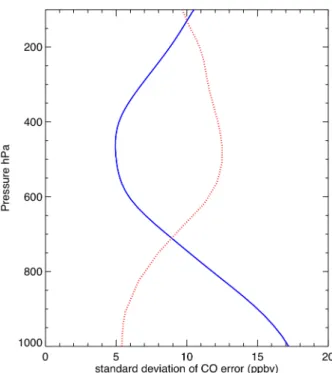
istics and sensitivities of AIRS and TES. Figure 3 shows the prescribed error standard deviations (SDVs) for AIRS (solid blue line), as the background error, and for TES (dashed red line), as the observational error. These errors originated from the retrieval error covariance matrices from the perspective teams and were averaged/smoothed to form one global set of error profiles. We then adjusted these profiles to reduce pre-15
scribed errors for AIRS in the mid troposphere and for TES in the lower troposphere. This is based on previous knowledge and validation experience, which shows it is rea-sonable to place more emphasis on TES data in the lower troposphere and AIRS data in the mid-troposphere. Although we used 1-D background error SDVs as an approx-imation for this study, the extension to 2-D error fields and the inclusion of seasonal 20
ACPD
13, 15409–15441, 2013Global carbon monoxide products
J. X. Warner et al.
Title Page
Abstract Introduction
Conclusions References
Tables Figures
◭ ◮
◭ ◮
Back Close
Full Screen / Esc
Printer-friendly Version Interactive Discussion
Discussion
P
a
per
|
Dis
cussion
P
a
per
|
Discussion
P
a
per
|
Discussio
n
P
a
per
|
4 Results
4.1 Combined AIRS and TES CO
We show in this section results from applying the data fusion methodology to AIRS and TES CO data. AIRS V5 L2 and TES V3 CO Volume Mixing Ratios (VMRs) at 500 hPa for 4 March 2006 are shown in Fig. 4 to demonstrate the data coverage pattern, where 5
the squares represent AIRS footprints and the filled circles represent TES pixels. TES Step and Stare (SS) special observations (SO) were taken to coincide with the INTEX-B experiment (Singh et al., 2008) (http://www.espo.nasa.gov/intex-b). The pixel sizes do not represent the correct proportions of the sizes for the AIRS Field Of Regards (FORs) at approximately 45×45 km2and the TES Field Of Views (FOVs) at 5×8 km2. 10
The vast majority of the AIRS pixels are not at nadir nor collocated with TES due to the coverage differences between the two sensors, so the data fusion scheme de-scribed in Sect. 3 is needed to distribute TES narrow swaths onto the global coverage of AIRS to produce daily maps. Results show that in vertical regions where AIRS has lower measurement sensitivity, the retrievals can still provide sufficient spatial variability 15
(or patterns), even though they may not be able to produce the correct magnitude (see Fig. 4). Consequently, the TES CO profiles are distributed based on the AIRS variance horizontally.
We first demonstrate the overall performance of data fusion applied to global AIRS and TES CO data using the methodology described in Sect. 3. The monthly grid-20
averaged zonal means for March 2006 are shown in Fig. 5 for AIRS CO (left top panel), analysis CO (left middle panel), analysis increment (left bottom panel), and AIRS CO interpolated to TES locations (right top panel), TES CO (right middle panel), and Ob-servation Minus Forecast (OMF) indicating TES minus AIRS in this experiment (right bottom panel), respectively. CO data are averaged in 1◦
× 1◦ latitude and longitude 25
ACPD
13, 15409–15441, 2013Global carbon monoxide products
J. X. Warner et al.
Title Page
Abstract Introduction
Conclusions References
Tables Figures
◭ ◮
◭ ◮
Back Close
Full Screen / Esc
Printer-friendly Version Interactive Discussion
Discussion
P
a
per
|
Dis
cussion
P
a
per
|
Discussion
P
a
per
|
Discussio
n
P
a
per
and AIRS on the right. This is an improvement over AIRS V5 CO retrievals based on previous studies (Warner et al., 2010; Yurganov et al., 2008). Quantatively, the analy-sis increment shows a decrease in the Southern Hemisphere (SH) lower troposphere of more than 40 ppbv and an increase in the Northern Hemisphere (NH) lower sphere of as much as 40 ppbv. The analysis increment is minimal in the mid tropo-5
sphere between 400 and 600 hPa to within±10 ppbv. There are also highly increased values of analysis increment at the tropics and decreased values at mid and high lati-tudes above 250 hPa in the UTLS.
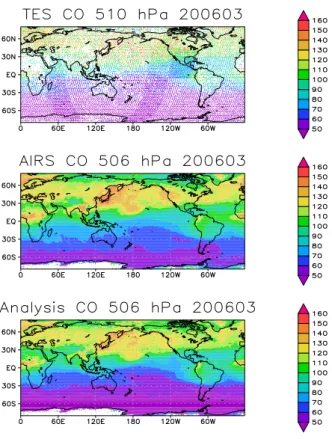
The horizontal CO distribution at approximately 944 hPa from a monthly mean grid-averaged dataset for March 2006 is shown in Fig. 6 with TES CO (top panel), AIRS 10
CO (middle panel), and the analysis CO (bottom panel). The analysis from the data fusion scheme presents much more realistic CO values based on our previous knowl-edge and validation results compared with the background CO values from AIRS. In particular, the CO analyses show distinct plumes in the NH associated with emissions and the SH shows the expected relatively low CO. The analysis CO agrees better with 15
TES values, with higher CO values in the NH and lower values in the SH compared to AIRS, and it provides much better continuity in data coverage compared with TES CO values. Similarly, Fig. 7 shows the monthly mean grid-averaged CO distribution at approximately 506 hPa. Unlike at 944 hPa, the CO analysis distribution is very similar to the AIRS background CO. Note that these examples use monthly mean results to 20
demonstrate the stability over time, the true advantage of this technique is the avail-ability of daily maps when there are only a few narrow tracks per day from TES routine survey products.
For validation purposes, we have collocated the TES and AIRS footprints with the independent INTEX-B in situ measurements by selecting the retrievals from the near-25
particu-ACPD
13, 15409–15441, 2013Global carbon monoxide products
J. X. Warner et al.
Title Page
Abstract Introduction
Conclusions References
Tables Figures
◭ ◮
◭ ◮
Back Close
Full Screen / Esc
Printer-friendly Version Interactive Discussion
Discussion
P
a
per
|
Dis
cussion
P
a
per
|
Discussion
P
a
per
|
Discussio
n
P
a
per
|
lar day was affected by agricultural fires in the southeast US, which resulted in high CO in the lower troposphere as shown by DACOM CO. AIRS V5 retrievals, using a single profile as the first guess, show good sensitivity in the mid troposphere (300–600 hPa), but the magnitudes of the retrieved results are lower by as much as∼40 ppbv below 900 hPa vertical level, in what is typically the boundary layer, due to reduced measure-5
ment sensitivity. TES senses higher CO signals in the lower troposphere especially over land (north of 30◦N); however, TES shows lower CO values between 200 and 500 hPa over parts of the ocean by ∼10–30 ppbv. Large portions of TES measure-ments show similar features as observed by DACOM in the lower troposphere where the AIRS observational signals are relatively weak. As shown on the bottom panel, the 10
mid troposphere CO concentrations resemble AIRS retrievals in the mid troposphere while following the lower tropospheric CO values from TES. The combined products show higher CO VMRs in the lower troposphere, which improves the agreement with the in situ measurements to within 10–20 ppbv.
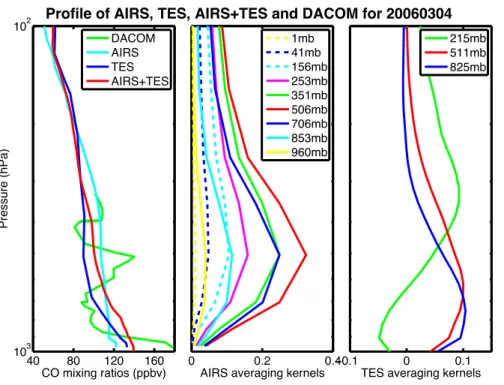
A profile validation against the DACOM in situ CO measurements is presented in 15
Fig. 9. The DACOM in situ CO spiral profile used in this comparison was obtained during INTEX-B on 4 March 2006, near the center of the Gulf of Mexico, as denoted by a black square in Fig. 4 (Sachse et al., 1987). The CO VMR profiles are shown on the left panel in Fig. 9 as the in situ data (green), AIRS data (cyan), TES data (blue), and the combined AIRS and TES data (red). The combined profile agrees with the 20
in situ profile much better than AIRS and TES profiles individually in the troposphere, especially over the vertical regions below 400 hPa. The combined profile is enhanced by AIRS in the mid troposphere by approximately 10–15 ppbv compared to TES and by TES below 75 hPa by nearly 20 ppbv. This shows the advantage of the data fusion method, in that it combines the best information characteristics from each sensor. The 25
ACPD
13, 15409–15441, 2013Global carbon monoxide products
J. X. Warner et al.
Title Page
Abstract Introduction
Conclusions References
Tables Figures
◭ ◮
◭ ◮
Back Close
Full Screen / Esc
Printer-friendly Version Interactive Discussion
Discussion
P
a
per
|
Dis
cussion
P
a
per
|
Discussion
P
a
per
|
Discussio
n
P
a
per
peaking at approximately 500 hPa. The right panel shows TES AKs at three selected retrieval pressure levels (825, 510, and 215 hPa), indicating that, for this example, the maximum information responsible for the lower troposphere CO retrievals peak just above 900 hPa vertical level where the top of the boundary layer usually is (see blue line in right hand panel of Fig. 9). Although the final form of the AKs for the combined 5
CO profiles, a nonlinear summation of the AKs from AIRS and TES, is not presented here, the combined information content should increase in the lower atmosphere based on the contribution from TES.
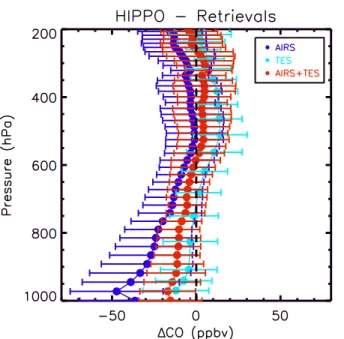
To extend our validation efforts, we compared the data fusion output with recently available in situ measurements from the HIAPER Pole-to-Pole Observations (HIPPO), 10
which took place from January of 2009 to September 2011 (Wofsy et al., 2012). The CO merged 10-second best measurements are used (http://hippo.ornl.gov/dataaccess) (HIPPO Merged Data Users Guide 20121130). TES CO data is available for HIPPO-1 (8–30 January 2009) and HIPPO-2 (31 October–22 November 2009) flights, but not for HIPPO-3 (24 March–16 April 2010), HIPPO-4 (14 June–11 July 2011), and HIPPO-5 15
(9 August–9 September 2011) periods. We initially carried out this data fusion study when only TES V3 CO products were available, which apply to all results presented in earlier sections. Although newer TES CO products are available, the principle and advantages of the data fusion methodology still stands using TES V3 CO. We attempt, however, to demonstrate the full potential of the technique and use the latest TES V5 20
CO in the HIPPO validation.
Figure 10 shows a summary of the differences between the combined CO from AIRS and TES and CO from both HIPPO-1 and HIPPO-2 flights. The averaged differences (HIPPO – Retrievals) for all available cases are plotted at 41 vertical levels throughout the troposphere for AIRS (blue), TES (cyan), and for the combined product (red), re-25
ACPD
13, 15409–15441, 2013Global carbon monoxide products
J. X. Warner et al.
Title Page
Abstract Introduction
Conclusions References
Tables Figures
◭ ◮
◭ ◮
Back Close
Full Screen / Esc
Printer-friendly Version Interactive Discussion
Discussion
P
a
per
|
Dis
cussion
P
a
per
|
Discussion
P
a
per
|
Discussio
n
P
a
per
|
with similar SDVs. The errors for both AIRS and the combined AIRS and TES are below 5ppbv with AIRS retrieved CO lower than the HIPPO measurements and the combined CO slightly higher than HIPPO CO. The 1-sigma SDVs are approximately the same for AIRS CO and the combined AIRS and TES CO at∼15–20 ppbv in the mid troposphere; and reduced in the lower troposphere from∼20–30 ppbv to∼10–20 ppbv.
5
4.2 Combined AIRS and MLS CO retrievals
MLS CO retrievals are combined with AIRS CO using the same method as for AIRS and TES as described in Sect. 3. Livesey et al. (2007) describe the error characteristics of these retrievals, and recommend that data not be used below 215 hPa vertical level. Although we are using a newer version (V3.3) of MLS data, based on the errors pro-10
vided by MLS team (http://mls.jpl.nasa.gov/data/v3-3 data quality document.pdf), we choose to only use data above 215 hPa. We modified the data fusion methodology by using gridded data for AIRS and MLS as opposed to using L2 individual pixels in the case of AIRS and TES. AIRS CO retrievals are averaged into 3◦ ×3◦ grids and MLS CO are averaged into 6◦ × 6◦ grids, in both cases separated into daytime and 15
nighttime measurements. This is done to reduce noise in the MLS CO data and to take into account that the MLS pixel represents a relatively long horizontal path due to limb viewing.
Figure 11 shows the global CO retrieval comparisons at 147 hPa for 4 March 2006 daytime only tracks, with AIRS V5 CO VMRs over-plotted by MLS in the upper panel 20
and the combined AIRS and MLS CO VMRs in the lower panel. The combined AIRS and MLS CO fields show a large increase in their variability with higher CO at low latitudes by approximately 10 to 20ppbv or higher, and lower CO at mid and high lat-itudes (by ∼10 ppbv) compared with the AIRS retrievals. Higher CO concentrations are identified as three large plumes over the tropics that cannot be measured by any 25
ACPD
13, 15409–15441, 2013Global carbon monoxide products
J. X. Warner et al.
Title Page
Abstract Introduction
Conclusions References
Tables Figures
◭ ◮
◭ ◮
Back Close
Full Screen / Esc
Printer-friendly Version Interactive Discussion
Discussion
P
a
per
|
Dis
cussion
P
a
per
|
Discussion
P
a
per
|
Discussio
n
P
a
per
higher tropospheric CO signals. It is difficult to resolve vertically the location of the high CO concentrations with thermal nadir viewing instruments, since the weighting func-tions for CO are generally broad and have very few (1–2) pieces of information in the troposphere.
Figure 12 shows the validation of the combined AIRS and MLS CO in the UTLS using 5
in situ data from HIPPO flights. Measurements from all 5 HIPPO flights are summarized into the difference plot between HIPPO CO and the satellite products (HIPPO – Re-trievals), shown as the blue curve for AIRS V5 CO, cyan curve for MLS CO, and the red curve for the combined AIRS and MLS CO in Fig. 12. The solid lines are the average er-rors showing 5 to 10 ppbv improvements for the height levels above 220 hPa over using 10
AIRS data alone. The SDVs have been improved by approximately 5 ppbv, from 20– 25 ppbv to 15–20 ppbv above 220 hPa. The MLS average error is very low (∼2.1 ppbv) at 146.8 hPa, and it provides CO information to improve the combined products. In the same process, however, the SDVs are reduced from 18.9 ppbv to 16.7 ppbv com-pared to the MLS only CO. The MLS CO average error is relatively high (−17.8 ppbv) 15
with SDVs at 36.0 ppbv at pressure level 215.4 hPa, which is given less weight in the data fusion of AIRS and MLS. The improvement of SDVs using the combined CO at 217.7 hPa over MLS CO is significant from 36.0 ppbv to 19.8 ppbv.
5 Summary
Multiple sensors (AIRS, TES, and MLS) on the A-train system make correlative CO 20
measurements within a short time period (15–30 min). Based on differences between their measurement techniques, each sensor provides unique characteristics. This study seeks to combine these datasets without using a chemistry transport model, an ap-proach that differs from traditional data assimilation. This approach, called data fusion, avoids uncertainties arising from model dynamics and transport issues, and provides a 25
ACPD
13, 15409–15441, 2013Global carbon monoxide products
J. X. Warner et al.
Title Page
Abstract Introduction
Conclusions References
Tables Figures
◭ ◮
◭ ◮
Back Close
Full Screen / Esc
Printer-friendly Version Interactive Discussion
Discussion
P
a
per
|
Dis
cussion
P
a
per
|
Discussion
P
a
per
|
Discussio
n
P
a
per
|
generally providing improved CO products compared with those from each individual sensor. The combined AIRS and TES CO products showed improvements of 10 to 40 ppbv and the combined AIRS and MLS CO products showed improvements of 10 to 20 ppbv above 175 hPa, based on validation using INTEX-B and HIPPO in situ mea-surements. The combined datasets retain the twice-daily nearly global coverage due 5
to AIRS’ wide swaths and the implementation of a cloud clearing algorithm that recon-structs cloudy pixels to recover more than 50 % of the daily measurements, compared to less than 10 % clear sky coverage.
This study provides a new framework to combine different measurements without the use of a model. We have demonstrated the feasibility of the data fusion technique 10
using A-train measurements from AIRS, TES, and MLS. However, this technique can be easily adapted to include direct and in situ measurements and/or other satellite products, and take advantage of the mature approaches developed in the field of data assimilation. Further studies will examine in detail error estimation and the constraints provided by satellite products. Data fusion for other atmospheric species such as ozone 15
and water vapor using this technique is also possible and should benefit chemical and dynamical studies of the UTLS.
Acknowledgements. This study was partially supported by the NASA Atmospheric Compo-sition Program (NNX07AM45G), Climate Data Record Uncertainty Analysis (NNX11AL22A), and Modeling, Analysis and Prediction Program. We have also been partially supported by
20
RTRA/STAE foundation from Toulouse, France. We acknowledge the AIRS, TES, and MLS Sci-ence Teams for the satellite products used in this study. We also thank the INTEX-B and HIPPO Science Teams for providing high quality in situ measurements.
References
Aumann, H. H., Chahine, M. T., Gautier, C., Goldberg, M., Kalnay, E., McMillin, L., Revercomb,
25
ACPD
13, 15409–15441, 2013Global carbon monoxide products
J. X. Warner et al.
Title Page
Abstract Introduction
Conclusions References
Tables Figures
◭ ◮
◭ ◮
Back Close
Full Screen / Esc
Printer-friendly Version Interactive Discussion
Discussion
P
a
per
|
Dis
cussion
P
a
per
|
Discussion
P
a
per
|
Discussio
n
P
a
per
Beer, R.: TES on the Aura mission: scientific objectives, measurements, and analysis overview, IEEE Trans. Geosci. Remote Sens., 44, 1102–1105, 2006.
Crutzen, P. J. and Zimmermann, P. H.: The changing photochemistry of the troposphere, Tellus, 43AB, 136–151, 1991.
Dee, D. P. and da Silva, A. M.: Maximum-Likelihood estimation of forecast and observation error
5
covariance parameters. Part I. Methodology, Mon. Weather Rev., 127, 1822–1834, 1999. Hoor, P., Fischer, H., Lange, L., Lelieveld, J., and Brunner, D.: Seasonal variations of a
mix-ing layer in the lowermost stratosphere as identified by the CO-O3 correlation from in situ measurements, J. Geophys. Res., 107, doi:10.1029/2000JD000289, 2002.
Hoor, P., Gurk, C., Brunner, D., Hegglin, M. I., Wernli, H., and Fischer, H.: Seasonality and
10
extent of extratropical TST derived from in-situ CO measurements during SPURT, Atmos. Chem. Phys., 4, 1427–1442, doi:10.5194/acp-4-1427-2004, 2004.
Jiang, J. H., Livesey, N. J., Su, H., Neary, L., McConnell, J. C., and Richards, N. A.: Connecting surface emissions, convective uplifting, and long-range transport of carbon monoxide in the upper-troposphere: New observations from the Aura Microwave Limb Sounder, Geophys.
15
Res. Lett., 34, L18812, doi:10.1029/2007GL030638, 2007.
Kalnay, E.: Atmospheric Modeling, Data Assimilation, and Predictability (Cambridge University Press, Cambridge, 2002): pp. xxii+341. ISBNs 0 521 79179 0, 0 521 79629 6., 2003. Lahoz, W. A., Khattatov, B., and Minar, R.: Data assimilation and information. Data
Assimila-tion: Making Sense of Observations, edited by: Lahoz, W. A., Khattatov, B., and Minar, R.,
20
Springer, 3–12, 2010.
Lahoz, W. A., Orphal, J., Atti ´e, J.-L., Chance, K., Liu, X., Edwards, D., Elbern, H., Flaud, J.-M., Claeyman, M., and El Amraoui, L.: Monitoring air quality from space: The case for the geo-stationary platform, B. Am. Meteorol. Soc., 93, 221–233, doi:10.1175/BAMS-D-11-00045.1, 2012.
25
Lin, M., Fiore, A., Horowitz, L. W., Cooper, O. R. R., Naik, V., Holloway, J. S., Johnson, B. J. J., Middlebrook, A. M., Oltmans, S. J. J., Pollack, I. B., Ryerson, T. B., Warner, J., Wiedinmyer, C., Wilson, J., and Wyman, B.: Transport of Asian ozone pollution into surface air over the western United States in spring, J. Geophys. Res., 117, D00V07, doi:10.1029/2011JD016961, 2012.
30
ACPD
13, 15409–15441, 2013Global carbon monoxide products
J. X. Warner et al.
Title Page
Abstract Introduction
Conclusions References
Tables Figures
◭ ◮
◭ ◮
Back Close
Full Screen / Esc
Printer-friendly Version Interactive Discussion
Discussion
P
a
per
|
Dis
cussion
P
a
per
|
Discussion
P
a
per
|
Discussio
n
P
a
per
|
M. J., Snyder, W. V., Stek, P. C., Thurstans, R. P., Wagner, P. A., Avery, M., Browell, E. V., Cammas, J.-P., Christensen, L. E., Diskin, G. S., Gao, R.-S., Jost, H.-J., Loewenstein, M., Lopez, J. D., Nedelec, P., Osterman, G. B., Sachse, G. W., and Webster, C. R.: Validation of Aura Microwave Limb Sounder O3and CO observations in the upper troposphere and lower stratosphere, J. Geophys. Res.-Atmos., 113, D15802, doi:10.1029/2007JD008805, 2007.
5
Luo, M., Beer, R., Jacob, D. J., Logan, J. A., and Rodgers, C. D.: Simulated observation of tropospheric ozone and CO with the Tropospheric Emission Spectrometer (TES) satellite instrument, J. Geophys. Res., 107, doi:10.1029/2001JD000804, 2002.
Luo, M., Rinsland, C., Fisher, B., Sachse, G., Diskin, G., Logan, J., Worden, H., Kulawik, S., Osterman, G., Eldering, A., Herman, R., and Shephard, M.: TES carbon monoxide validation
10
with DACOM aircraft measurements during INTEX-B 2006, J. Geophys. Res., 112, D24S48, doi:10.1029/2007JD008803, 2007.
McMillan, W. W., Barnet, C., Strow, L., Chahine, M., Warner, J., McCourt, M., Novelli, P., Ko-rontzi, S., Maddy, E., and Datta, S.: Daily Global Maps of Carbon Monoxide from NASA’s At-mospheric InfraRed Sounder, Geophys. Res. Lett., 32, L11801, doi:10.1029/2004GL021821,
15
2005.
McMillan, W. W., Evans, K. D., Barnet, C. D., Maddy, E. S., Sachse, G. W., and Diskin, G. S.: AIRS V5 CO Retrieval With DACOM In Situ Measurements, IEEE Trans. Geosci. Remote Sens., 49, 1–12, ISSN: 0196-2892, doi:10.1109/TGRS.2011.2106505, 2011.
Pan, L. L., Randel, W. J., Gary, B. L., Mahoney, M. J., and Hintsa, E. J.: Definitions and
20
sharpness of the extratropical tropopause: A trace gas perspective, J. Geophys. Res., 109, D23103, doi:10.1029/2004JD004982, 2004.
Pan, L. L., Bowman, K. P., Shapiro, M., Randel, W. J., Gao, R.-S., Campos, T., Davis, C., Schauffler, S., Ridley, B. A., Wei, J. C., and Barnet, C.: Chemical behavior of the tropopause observed during the Stratosphere-Troposphere Analyses of Regional Transport (START)
ex-25
periment, J. Geophys. Res., 112, D18110, doi:10.1029/2007JD008645, 2007a.
Pan, L. L., Wei, J. C., Kinnison, D. E., Garcia, R. R., Wuebbles, D. J., and Brasseur, G. P.: A set of diagnostics for evaluating chemistry-climate models in the extratropical tropopause region, J. Geophys. Res., 112, D09316, doi:10.1029/2006JD007792, 2007b.
Read, W. G., Lambert, A., Backmeister, J., Cofield, R. E., Christensen, L. E., Cuddy, D. T.,
30
ACPD
13, 15409–15441, 2013Global carbon monoxide products
J. X. Warner et al.
Title Page
Abstract Introduction
Conclusions References
Tables Figures
◭ ◮
◭ ◮
Back Close
Full Screen / Esc
Printer-friendly Version Interactive Discussion
Discussion
P
a
per
|
Dis
cussion
P
a
per
|
Discussion
P
a
per
|
Discussio
n
P
a
per
R. P., Vomel, H., Wagner, P. A., Waters, J. W., Webster, C. R., Weinstock, E. M., and Wu, D. L.: Aura Microwave Limb Sounder Upper Tropospheric and Lower Stratospheric H2O and RHi Validation, J. Geophys. Res., 112, doi:10.1029/2007JD008752, 2007.
Roger Daley and Edward Barker: NAVDAS Source Book 2000, NRL Atmospheric Variational Data Assimilation System, 2000.
5
Sachse, G. W., Hill, G. F., Wade, L. O., and Perry, M. G.: Fast-response, high-precision carbon monoxide sensor using a tunable diode laser absorption technique, J. Geophys. Res., 92, 2071–2081, 1987.
Singh, H. B., Brune, W. H., Crawford, J. H., Jacob, D. J., and Russell, P. B.: Overview of the summer 2004 Intercontinental Chemical Transport Experiment-North, America (INTEX-A), J.
10
Geophys. Res., 111, D24S01, doi:10.1029/2006JD007905, 2006.
Susskind, J., Barnet, C. D., and Blaisdell, J. M.: Retrieval of atmospheric and surface param-eters from AIRS/AMSU/HSB data in the presence of clouds, IEEE Trans. Geosci. Remote Sens., 41, 390–409, 2003.
Sze, N. D.: Anthropogenic CO emissions: Implications for the atmospheric CO-OH-CH4 cycle,
15
Science, 195, 673–675, 1977.
Talagrand, O.: Assimilation of Observations, an Introduction. J. Meteo. Soc. Japan, 75, 191– 209, 1997.
Warner, J. X., Wei, Z., Strow, L. L., Barnet, C. D., Sparling, L. C., Diskin, G., and Sachse, G.: Im-proved agreement of AIRS tropospheric carbon monoxide products with other EOS sensors
20
using optimal estimation retrievals, Atmos. Chem. Phys., 10, 9521–9533, doi:10.5194/acp-10-9521-2010, 2010.
Warner, J. X., Comer, M. M., Barnet, C. D., McMillan, W. W., Wolf, W., Maddy, E., and Sachse, G.: A Comparison of Satellite Tropospheric Carbon Monoxide Measurements from AIRS and MOPITT During INTEX-A, J. Geophys. Res., 112, doi:10.1029/2006JD007925, 2007.
25
Waters, J. W., Froidevaux, L., Harwood, R. S., Jarnot, R. F., Pickett, H. M., Read, W. G., Siegel, P. H., Cofield, R. E., Filipiak, M. J., Flower, D. A., Holden, J. R., Lau, G. K., Livesey, N. J., Manney, G. L., Pumphrey, H. C., Santee, M. L., Wu, D. L., Cuddy, D. T., Lay, R. R., Loo, M. S., Perun, V. S., Schwartz, M. J., Stek, P. C., Thurstans, R. P., Boyles, M. A., Chandra, K. M., Chavez, M. C., Chen, G. S., Chudasama, B. V., Dodge, R., Fuller, R. A., Girard, M. A., Jiang,
30
ACPD
13, 15409–15441, 2013Global carbon monoxide products
J. X. Warner et al.
Title Page
Abstract Introduction
Conclusions References
Tables Figures
◭ ◮
◭ ◮
Back Close
Full Screen / Esc
Printer-friendly Version Interactive Discussion
Discussion
P
a
per
|
Dis
cussion
P
a
per
|
Discussion
P
a
per
|
Discussio
n
P
a
per
|
A., and Walch, M. J.: The Earth Observing System Microwave Limb Sounder (EOS MLS) on the Aura satellite, IEEE Trans. Geosci. Remote Sens., 44, 1075–1092, 2006.
Wofsy, S. C., Daube, B. C., Jimenez, R., Kort, E., Pittman, J. V., Park, S., Commane, R., Xiang, B., Santoni, G., Jacob, D., Fisher, J., Pickett-Heaps, C., Wang, H., Wecht, K., Wang, Q.-Q., Stephens, B. B., Shertz, S., Watt, A. S., Romashkin, P., Campos, T., Haggerty, J., Cooper, W.
5
A., Rogers, D., Beaton, S., Hendershot, R., Elkins, J. W., Fahey, D. W., Gao, R. S., Moore, F., Montzka, S. A., Schwarz, J. P., Perring, A. E., Hurst, D., Miller, B. R., Sweeney, C., Oltmans, S., Nance, D., Hintsa, E., Dutton, G., Watts, L. A., Spackman, J. R., Rosenlof, K. H., Ray, E. A., Hall, B., Zondlo, M. A., Diao, M., Keeling, R., Bent, J., Atlas, E. L., Lueb, R., and Ma-honey, M. J.: HIPPO Merged 10-second Meteorology, Atmospheric Chemistry, Aerosol Data
10
(R 20121129). Carbon Dioxide Information Analysis Center, Oak Ridge National Laboratory, Oak Ridge, Tennessee, USA, doi:10.3334/CDIAC/hippo 010, 2012.
Yurganov, L. N., McMillan, W. W., Dzhola, A. V., Grechko, E. I., Jones, N. B., and van der Werf, G. R.: Global AIRS and MOPITT CO measurements: Validation, compari-son, and links to biomass burning variations and carbon cycle, J. Geophys. Res., 113,
15
doi:10.1029/2007JD009229, 2008.
Zahn, A., Brenninkmeijer, C. A. M., Maiss, M., Scharffe, D. H., Crutzen, P. J., Hermann, M., Heintzenberg, J., Wiedensohler, A., Gusten, H., Heinrich, G., Fischer, H., Cuijpers, J. W. M., and van Velthoven, P. F. J.: Identification of extratropical two-way troposphere- stratosphere mixing based on CARIBIC measurements of O3, CO, and ultrafine particles, J. Geophys.
20
ACPD
13, 15409–15441, 2013Global carbon monoxide products
J. X. Warner et al.
Title Page Abstract Introduction Conclusions References Tables Figures ◭ ◮ ◭ ◮ Back Close
Full Screen / Esc
Printer-friendly Version Interactive Discussion Discussion P a per | Dis cussion P a per | Discussion P a per | Discussio n P a per
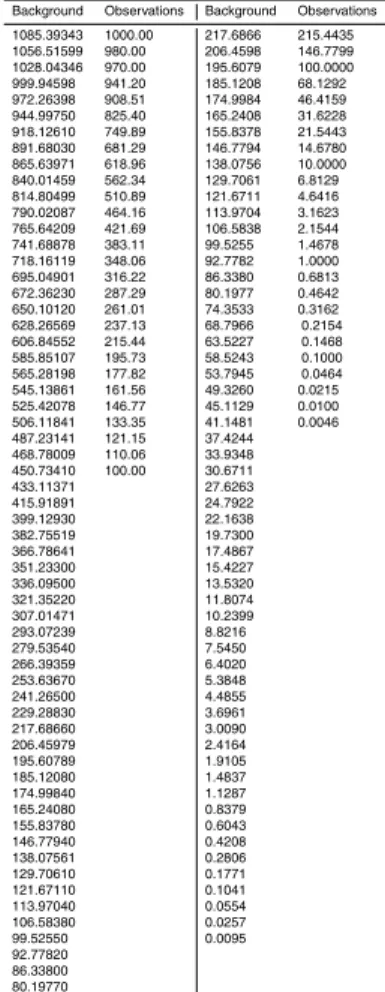
Table 1.The pressure levels used in AIRS (background and analysis) and TES (observations) combined CO (left columns), and AIRS and MLS combined CO (right columns).
ACPD
13, 15409–15441, 2013Global carbon monoxide products
J. X. Warner et al.
Title Page
Abstract Introduction
Conclusions References
Tables Figures
◭ ◮
◭ ◮
Back Close
Full Screen / Esc
Printer-friendly Version Interactive Discussion
Discussion
P
a
per
|
Dis
cussion
P
a
per
|
Discussion
P
a
per
|
Discussio
n
P
a
per
|
used
Fig. 1.Design of the satellite data fusion system, where AIRS operational V5 L2 retrievals are used as the background, and TES or MLS are added to the Kalman filter process as observa-tions.
ACPD
13, 15409–15441, 2013Global carbon monoxide products
J. X. Warner et al.
Title Page
Abstract Introduction
Conclusions References
Tables Figures
◭ ◮
◭ ◮
Back Close
Full Screen / Esc
Printer-friendly Version Interactive Discussion
Discussion
P
a
per
|
Dis
cussion
P
a
per
|
Discussion
P
a
per
|
Discussio
n
P
a
per
28
29
ACPD
13, 15409–15441, 2013Global carbon monoxide products
J. X. Warner et al.
Title Page
Abstract Introduction
Conclusions References
Tables Figures
◭ ◮
◭ ◮
Back Close
Full Screen / Esc
Printer-friendly Version Interactive Discussion
Discussion
P
a
per
|
Dis
cussion
P
a
per
|
Discussion
P
a
per
|
Discussio
n
P
a
per
|
30
d TES
ACPD
13, 15409–15441, 2013Global carbon monoxide products
J. X. Warner et al.
Title Page
Abstract Introduction
Conclusions References
Tables Figures
◭ ◮
◭ ◮
Back Close
Full Screen / Esc
Printer-friendly Version Interactive Discussion
Discussion
P
a
per
|
Dis
cussion
P
a
per
|
Discussion
P
a
per
|
Discussio
n
P
a
per
|
squar
Fig. 4. The footprints of AIRS and TES special observations for 4 March 2006, where the squares represent AIRS CO mixing ratios at 500 hPa, the filled circles represent those for TES, and the black box outlines the location of the DC-8 in situ spiral profile.
ACPD
13, 15409–15441, 2013Global carbon monoxide products
J. X. Warner et al.
Title Page
Abstract Introduction
Conclusions References
Tables Figures
◭ ◮
◭ ◮
Back Close
Full Screen / Esc
Printer-friendly Version Interactive Discussion
Discussion
P
a
per
|
Dis
cussion
P
a
per
|
Discussion
P
a
per
|
Discussio
n
P
a
per
|
32
ft mid
ACPD
13, 15409–15441, 2013Global carbon monoxide products
J. X. Warner et al.
Title Page
Abstract Introduction
Conclusions References
Tables Figures
◭ ◮
◭ ◮
Back Close
Full Screen / Esc
Printer-friendly Version Interactive Discussion
Discussion
P
a
per
|
Dis
cussion
P
a
per
|
Discussion
P
a
per
|
Discussio
n
P
a
per
33
p
ACPD
13, 15409–15441, 2013Global carbon monoxide products
J. X. Warner et al.
Title Page
Abstract Introduction
Conclusions References
Tables Figures
◭ ◮
◭ ◮
Back Close
Full Screen / Esc
Printer-friendly Version Interactive Discussion
Discussion
P
a
per
|
Dis
cussion
P
a
per
|
Discussion
P
a
per
|
Discussio
n
P
a
per
|
34
ACPD
13, 15409–15441, 2013Global carbon monoxide products
J. X. Warner et al.
Title Page
Abstract Introduction
Conclusions References
Tables Figures
◭ ◮
◭ ◮
Back Close
Full Screen / Esc
Printer-friendly Version Interactive Discussion
Discussion
P
a
per
|
Dis
cussion
P
a
per
|
Discussion
P
a
per
|
Discussio
n
P
a
per
35 102
103
Pressure (hPa)
Curtain plots for DACOM, TES, AIRS and TES+AIRS for 20060304
102
103
Pressure (hPa)
102
103
Pressure (hPa)
−5 0 5 10 15 20 25 30 35 40 45
102
103
Pressure (hPa)
Latitude (°)
40 60 80 100 120 140 160 180
ACPD
13, 15409–15441, 2013Global carbon monoxide products
J. X. Warner et al.
Title Page
Abstract Introduction
Conclusions References
Tables Figures
◭ ◮
◭ ◮
Back Close
Full Screen / Esc
Printer-friendly Version Interactive Discussion
Discussion
P
a
per
|
Dis
cussion
P
a
per
|
Discussion
P
a
per
|
Discussio
n
P
a
per
|
Profile of AIRS, TES, AIRS+TES and DACOM for 20060304
40 80 120 160
102
103
CO mixing ratios (ppbv)
Pressure (hPa)
DACOM AIRS TES AIRS+TES
0 0.2 0.4
AIRS averaging kernels 1mb 41mb 156mb 253mb 351mb 506mb 706mb 853mb 960mb
−0.1 0 0.1
TES averaging kernels 215mb 511mb 825mb
t
Fig. 9.A profile validation against the DACOM in situ CO measurements on 4 March 2006 (left hand panel) with DACOM CO (green curve), AIRS CO (cyan line), TES CO (blue line), and analyses CO (red line). Middle panel shows AIRS AKs and right hand panel shows TES AKs.
ACPD
13, 15409–15441, 2013Global carbon monoxide products
J. X. Warner et al.
Title Page
Abstract Introduction
Conclusions References
Tables Figures
◭ ◮
◭ ◮
Back Close
Full Screen / Esc
Printer-friendly Version Interactive Discussion
Discussion
P
a
per
|
Dis
cussion
P
a
per
|
Discussion
P
a
per
|
Discussio
n
P
a
per
|
38
ks,
−180 −135 −90 −45 0 45 90 135 180
−90 −45 0 45 90
Original AIRS & MLS CO VMR (ppbv) at 147hPa
10 20 30 40 50 60 70 80 90
−180 −135 −90 −45 0 45 90 135 180
−90 −45 0 45 90
AIRS + MLS Analysis CO VMR (ppbv) at 147hPa
10 20 30 40 50 60 70 80 90
ACPD
13, 15409–15441, 2013Global carbon monoxide products
J. X. Warner et al.
Title Page
Abstract Introduction
Conclusions References
Tables Figures
◭ ◮
◭ ◮
Back Close
Full Screen / Esc
Printer-friendly Version Interactive Discussion
Discussion
P
a
per
|
Dis
cussion
P
a
per
|
Discussion
P
a
per
|
Discussio
n
P
a
per
39