www.atmos-chem-phys.net/10/977/2010/ © Author(s) 2010. This work is distributed under the Creative Commons Attribution 3.0 License.
Chemistry
and Physics
Source attribution and interannual variability of Arctic pollution in
spring constrained by aircraft (ARCTAS, ARCPAC) and satellite
(AIRS) observations of carbon monoxide
J. A. Fisher1, D. J. Jacob1, M. T. Purdy1,*, M. Kopacz1,**, P. Le Sager1, C. Carouge1, C. D. Holmes1, R. M. Yantosca1, R. L.Batchelor2, K. Strong2, G. S. Diskin3, H. E. Fuelberg4, J. S. Holloway5,6, E. J. Hyer7, W. W. McMillan8,9, J. Warner9, D. G. Streets10, Q. Zhang10,11, Y. Wang12, and S. Wu13
1Department of Earth and Planetary Sciences and School of Engineering and Applied Sciences, Harvard University,
Cambridge, Massachusetts, USA
2Department of Physics, University of Toronto, Toronto, Ontario, Canada 3NASA Langley Research Center, Hampton, Virginia, USA
4Department of Meteorology, Florida State University, Tallahassee, Florida, USA
5Cooperative Institute for Research in Environmental Science, University of Colorado, Boulder, Colorado, USA 6Chemical Sciences Division, NOAA Earth System Research Laboratory, Boulder, Colorado, USA
7UCAR Visiting Scientist Program, Naval Research Laboratory, Monterey, California, USA 8Department of Physics, University of Maryland, Baltimore County, Baltimore, Maryland, USA 9Joint Center for Earth Systems Technology, University of Maryland, Baltimore, Maryland, USA 10Decision and Information Sciences Division, Argonne National Laboratory, Argonne, Illinois, USA 11Center for Earth System Science, Tsinghua University, Beijing, China
12Department of Environmental Science and Engineering, Tsinghua University, Beijing, China
13Department of Geological and Mining Engineering and Sciences and Department of Civil and Environmental Engineering,
Michigan Technological University, Houghton, Michigan, USA
*now at: Risk Management Solutions, Hackensack, New Jersey, USA
**now at: Woodrow Wilson School of Public and International Affairs, Princeton University, Princeton, New Jersey, USA
Received: 31 August 2009 – Published in Atmos. Chem. Phys. Discuss.: 14 September 2009 Revised: 15 January 2010 – Accepted: 19 January 2010 – Published: 1 February 2010
Abstract. We use aircraft observations of carbon monox-ide (CO) from the NASA ARCTAS and NOAA ARCPAC campaigns in April 2008 together with multiyear (2003– 2008) CO satellite data from the AIRS instrument and a global chemical transport model (GEOS-Chem) to better un-derstand the sources, transport, and interannual variability of pollution in the Arctic in spring. Model simulation of the aircraft data gives best estimates of CO emissions in April 2008 of 26 Tg month−1 for Asian anthropogenic, 9.4 for European anthropogenic, 4.1 for North American anthro-pogenic, 15 for Russian biomass burning (anomalously large that year), and 23 for Southeast Asian biomass burning. We find that Asian anthropogenic emissions are the dominant source of Arctic CO pollution everywhere except in surface air where European anthropogenic emissions are of similar
Correspondence to: J. A. Fisher ([email protected])
1 Introduction
The Arctic is a major receptor for mid-latitudes pollution (Shaw, 1995; Quinn et al., 2007). Radiative forcing by pollu-tants in the Arctic including ozone, aerosols, and black car-bon deposited on snow could make a major contribution to regional and global warming (Koch and Hansen, 2005; Shin-dell et al., 2006a; McConnell et al., 2007; Quinn et al., 2008; Shindell and Faluvegi, 2009). Several studies have identi-fied pollution transport pathways to the Arctic on the basis of model simulations and meteorological analyses (Eckhardt et al., 2003; Klonecki et al., 2003; Koch and Hansen, 2005; Stohl, 2006; Shindell et al., 2008), but our ability to ver-ify these pathways through chemical observations has been limited. Polar-orbiting satellites offer unique platforms for this purpose. We present here an analysis of the sources and transport of Arctic pollution in spring using the GEOS-Chem chemical transport model (CTM) to interpret satellite obser-vations of carbon monoxide (CO) from the Atmospheric In-fraRed Sounder (AIRS) together with aircraft measurements from the NASA ARCTAS (Arctic Research of the Compo-sition of the Troposphere from Aircraft and Satellites) and NOAA ARCPAC (Aerosol, Radiation, and Cloud Processes affecting Arctic Climate) campaigns.
Despite 50 years of observations of Arctic pollution, there remains considerable uncertainty concerning the sources. Surface-based studies conducted in the 1970s and 1980s fo-cused on anthropogenic pollution transported from Eastern Europe and Siberia (Carlson, 1981; Rahn, 1981; Raatz and Shaw, 1984; Barrie, 1986). Wintertime influence from these regions is facilitated by cold surface temperatures and sta-ble conditions, enabling low-altitude isentropic transport to the Arctic (Barrie, 1986; Klonecki et al., 2003; Stohl, 2006; Law and Stohl, 2007). Pollutants from Asia and North Amer-ica, emitted at lower latitudes and therefore warmer temper-atures, were thought to be inhibited from entering the Arctic by the “polar dome”, an isentropic transport barrier.
Recent research has called into question the predominance of Europe as the main source of Arctic pollution. Model-ing studies have shown that while near-surface pollution may still be dominated by European sources, transport from Asia and North America is possible at higher altitudes, facilitated by lofting of pollutants by warm conveyor belts (WCBs) (Koch and Hansen, 2005; Stohl, 2006; Shindell et al., 2008). Furthermore, with the collapse of the Soviet Union, strict emission controls in the European Union, and the rapid in-dustrialization of China and Southeast Asia, the global dis-tribution of emissions has changed dramatically over the past 20 years. Several studies show increasing contributions from Asia but disagree quantitatively on the importance of this source for overall Arctic pollution (Koch and Hansen, 2005; Stohl, 2006; Shindell et al., 2008). As interest in Arctic pollution has broadened from air quality to climate impacts, there is a pressing need to understand pollution sources not only at the surface but throughout the troposphere.
Biomass burning has recently been suggested as an addi-tional important source of Arctic pollution. Black carbon records in Greenland ice cores show large concentrations at-tributable to fire emissions dating back to the pre-industrial era (McConnell et al., 2007), and more recent measurements in snow suggest that biomass burning accounts for more than 90% of the black carbon deposited in the Arctic in spring (Hegg et al., 2009). Fires in Eastern Europe and Russia have been shown to cause substantial increases in the atmospheric loading of pollutants including CO, ozone, and aerosols mea-sured at surface sites in the European Arctic (Stohl et al., 2007). Early analysis of the ARCPAC aircraft data identified a substantial contribution from Russian forest fires and cen-tral Asian agricultural burning to atmospheric pollution over Alaska (Warneke et al., 2008).
CO is emitted by incomplete combustion, and we use it here as a tracer of pollution. Its atmospheric lifetime against oxidation by the hydroxyl radical (OH) is on average two months, long enough to track transport on intercontinental scales but short enough to show well-defined concentration gradients (Staudt et al., 2001; Heald et al., 2003a; Liu et al., 2003; Liang et al., 2004; Turquety et al., 2008; Yashiro et al., 2009). In a recent intercomparison of 11 CTMs, simulated CO concentrations disagreed by a factor of 2–3 at all altitudes in the Arctic due to model differences in emissions, transport, and OH concentrations (Shindell et al., 2008). There is a need to better understand CO sources and transport to the Arctic as an indicator of pollution influence.
(Yurganov et al., 2009), but application to Arctic pollution transport had not previously been tested.
Aircraft data from the ARCTAS and ARCPAC campaigns based in Alaska in April 2008 can help evaluate the utility of the AIRS data for observing long-range transport to the Arctic. The in situ measurements provide highly accurate in-formation on the structure of Arctic CO distributions, allow-ing an independent test of the AIRS CO data. The aircraft observations can further provide quantitative constraints on sources of CO in the Arctic.
We examine here the influence of different source types (fuel combustion, biomass burning) and mid-latitude source regions on Arctic pollution in spring, using the GEOS-Chem CTM as a platform for intercomparing the aircraft and satel-lite datasets. We first use the aircraft observations to con-strain the CO sources in the CTM and subsequently use the CTM to quantify the source contributions to Arctic CO pol-lution. The aircraft observations together with the CTM are used to test the ability of AIRS to observe high-latitude pollu-tion transport. We then use AIRS observapollu-tions to investigate the interannual variability of CO transport to the Arctic.
2 Model description
We use the GEOS-Chem CTM version 8-01-04 (http://acmg. seas.harvard.edu/geos/index.html) driven by GEOS-5 assim-ilated meteorology from the NASA Global Modeling and As-similation Office (GMAO) Goddard Earth Observing System (GEOS). The native resolution of GEOS-5 is 0.5◦×0.667◦ with 72 vertical levels; we regrid to 2◦×2.5◦ for input to GEOS-Chem. The GEOS-Chem simulation of CO has pre-viously been used to track intercontinental transport of pol-lution (Li et al., 2002; Heald et al., 2003a; Liu et al., 2003; Duncan and Bey, 2004; Jaffe et al., 2004; Liang et al., 2004; Zhang et al., 2008) and has been extensively compared to in situ and satellite observations (Jaegl´e et al., 2003; Kiley et al., 2003; Liu et al., 2003; Heald et al., 2006; Koike et al., 2006; Duncan et al., 2007; Duncan and Logan, 2008; Hudman et al., 2008).
We simulate April 2008 preceded by a 10-month spin-up. Anthropogenic (fossil fuel and biofuel) sources of CO are simulated using state-of-the-science regional emission inven-tories as described in Table 1. Emissions from sources not accounted for in the regional inventories are taken from the EDGAR 3.2 FT2000 global emissions inventory for 2000 (Olivier et al., 1999; Olivier and Berdowski, 2001). Biomass burning emissions are from the Fire Locating and Moni-toring of Burning Emissions (FLAMBE) inventory (Reid et al., 2009), which provides carbon emissions at 1◦×1◦ spa-tial resolution and hourly temporal resolution based on both MODIS and GOES satellite fire counts (Naval Research Lab-oratory, http://www.nrlmry.navy.mil/flambe/). CO emissions are subsequently calculated using emission factors from An-dreae and Merlet (2001). All emissions are injected into the
local planetary boundary layer as defined from the GEOS-5 data. While this could cause an underestimate of vertical transport of CO from the most energetic fires, recent work has shown that direct free tropospheric injection of biomass burning plumes is infrequent (Labonne et al., 2007; Kahn et al., 2008; Val Martin et al., 2009).
Additional sources of CO in our simulation in-clude oxidation of methane (CH4) and non-methane
volatile organic compounds (NMVOCs). Methane is spec-ified using latitudinally-resolved observations from the NOAA/ESRL/GMD network (Dlugokencky et al., 2008). A yield of one CO molecule per oxidized CH4molecule is
as-sumed. Oxidation of anthropogenic and biomass burning NMVOCs is simulated by increasing direct CO emissions from these sources by 19% and 11% respectively (Duncan et al., 2007). Biogenic NMVOC sources in the model in-clude isoprene, monoterpenes, methanol, and acetone. All NMVOCs are assumed to oxidize immediately to CO with yields given by Duncan et al. (2007). These indirect emis-sions are not included in the regional CO emission totals given later in the paper.
We use a linear CO simulation (Duncan et al., 2007) with monthly mean archived OH concentrations from a previous GEOS-Chem full-chemistry simulation (Park et al., 2004). The annual global mean OH concentration in our simula-tion is 10.8×10⁵molecules cm−3. This is close to the 25-model mean of 11.1±1.7×10⁵molecules cm−3 reported in the Shindell et al. (2006a) CTM intercomparison and higher than the 9.4×10⁵molecules cm−3reported for GEOS-Chem in that comparison. For source attribution, the linearity of the model permits us to include tagged CO tracers from individ-ual sources that are consistent with the overall CO simula-tion.
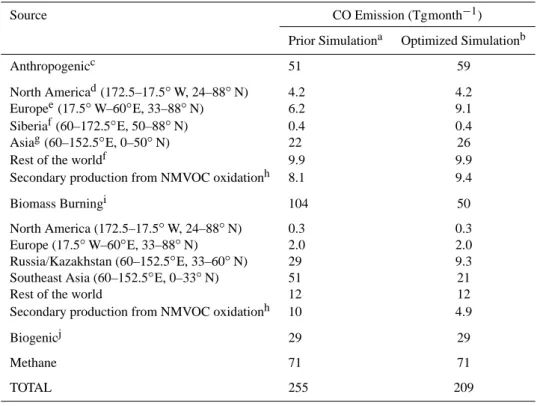
Table 1. Global CO sources for April 2008 used in GEOS-Chem simulations.
Source CO Emission (Tgmonth−1)
Prior Simulationa Optimized Simulationb
Anthropogenicc 51 59
North Americad(172.5–17.5◦W, 24–88◦N) 4.2 4.2 Europee(17.5◦W–60◦E, 33–88◦N) 6.2 9.1 Siberiaf(60–172.5◦E, 50–88◦N) 0.4 0.4
Asiag(60–152.5◦E, 0–50◦N) 22 26
Rest of the worldf 9.9 9.9
Secondary production from NMVOC oxidationh 8.1 9.4
Biomass Burningi 104 50
North America (172.5–17.5◦W, 24–88◦N) 0.3 0.3 Europe (17.5◦W–60◦E, 33–88◦N) 2.0 2.0 Russia/Kazakhstan (60–152.5◦E, 33–60◦N) 29 9.3 Southeast Asia (60–152.5◦E, 0–33◦N) 51 21
Rest of the world 12 12
Secondary production from NMVOC oxidationh 10 4.9
Biogenicj 29 29
Methane 71 71
TOTAL 255 209
aMonthly source totals from the original GEOS-Chem emission inventories.
bChanges from the prior simulation reflect source corrections based on the ARCTAS and ARCPAC aircraft observations (Table 2). cAnthropogenic sources include fossil fuel and biofuel emissions.
dNorth America includes Canada, the United States, and Mexico. Primary emissions over the US are derived by decreasing the US
Environ-mental Protection Agency National Emission Inventory (EPA-NEI99, http://www.epa.gov/ttnchie1/net/1999inventory.html) CO emissions by 60%, following Hudman et al. (2008). Canadian emissions are from the Criteria Air Contaminants (CAC) inventory (Environment Canada, http://www.ec.gc.ca/pdb/cac/cac home e.cfm) and Mexican emissions are from the Big Bend Regional Aerosol and Visibility Observational Study Emissions Inventory (BRAVO) (Kuhns et al., 2005).
eEuropean anthropogenic emissions are from the Cooperative Programme for Monitoring and Evaluation of the Long-range Transmission
of Air Pollutants in Europe (EMEP) inventory (Vestreng and Klein, 2002).
fSiberian and “rest of the world” anthropogenic emissions are from the EDGAR 3.2 FT2000 inventory (Olivier et al., 1999; Olivier and
Berdowski, 2001).
gAsian emissions are derived from the NASA INTEX-B inventory for 2006 (Zhang et al., 2009) with seasonality based on monthly activity
levels of NOxemissions (Zhang et al., 2007).
hSecondary CO sources are computed by increasing direct CO emissions by 11% for biomass burning emissions and by 19% for
anthro-pogenic emissions (Duncan et al., 2007). Over the US, anthroanthro-pogenic CO is increased by 39% rather than 19% to account for the improved CO source estimate from Hudman et al. (2008).
iBiomass burning CO emissions are from the FLAMBE inventory (Reid et al., 2009) and are computed as described in the text.
jThe source from the oxidation of biogenic NMVOCs is computed following Duncan et al. (2007) and includes acetone and methanol as
well as the Model of Emissions of Gases and Aerosols from Nature (MEGAN) inventory for isoprene and monoterpenes (Guenther et al., 2006).
To compare GEOS-Chem and in situ aircraft CO, the model is sampled along the flight track at the same time and location as the observations. The aircraft data are averaged over the GEOS-Chem grid and time-step. For comparison with AIRS, GEOS-Chem is sampled at the AIRS overpass lo-cations and averaged over a 3-h window centered at the 13:30 local overpass time. AIRS retrieves CO profiles on nine trapezoidal pressure layers sampled from the 100 AIRS
pres-sure levels. GEOS-Chem model profiles are convolved to AIRS retrieval space using the convolution equation (Olsen et al., 2007; McMillan et al., 2009) and summed over the 100 pressure levels to compute the modeled total CO column:
ˆ ym=
X
i
za,iexp
FAF′·lnzm,i za,i
, (1)
model profile of partial columns interpolated onto the 100 AIRS pressure levels i, za,i is the AIRS retrieval a priori
profile of partial columns, F is a 100×9 matrix that defines the nine vertical trapezoidal layers on which AIRS CO is re-trieved, F′ is its pseudo-inverse, and A is a 9×9 averaging kernel matrix in the trapezoidal space. The degrees of free-dom (DOF) for signal, measuring the number of pieces of information in the vertical profile, are generally less than 1.5 (Kopacz et al., 2010), so we use total column CO rather than profiles. The column sensitivity as indicated by the averaging kernels is low in the boundary layer and has a broad maxi-mum at 300–600 hPa (Warner et al., 2007; McMillan et al., 2009; McMillan et al., 2010).
In this study we use version 5 AIRS CO retrievals (avail-able from http://disc.sci.gsfc.nasa.gov/AIRS/data-holdings/ by-data-product/) and, following the recommendations in McMillan et al. (2009), include only daytime AIRS observa-tions with DOF for signal greater than 0.5 retrieved over sur-faces with temperature above 250 K. These thresholds elim-inate on average 20% of the available daytime observations globally and 25% in the Arctic in April.
3 CO observations and constraints on sources
Jacob et al. (2009) give a general description of the NASA ARCTAS campaign. A major goal was to observe long-range transport of pollution to the Arctic using a DC-8 air-craft based in Fairbanks, Alaska from 1 to 19 April 2008. CO measurements were made using the Differential Absorption of CO Measurement (DACOM) instrument at a frequency of 1 Hz and accuracy of 2% (Sachse et al., 1987). The NOAA ARCPAC campaign (Warneke et al., 2008) took place con-currently using a WP-3D aircraft also based in Fairbanks with flights from 3 to 23 April 2008 (all but one after 11 April). CO measurements were made by vacuum ultraviolet resonance fluorescence at a frequency of 1 Hz and accuracy of 5% (Holloway et al., 2000).
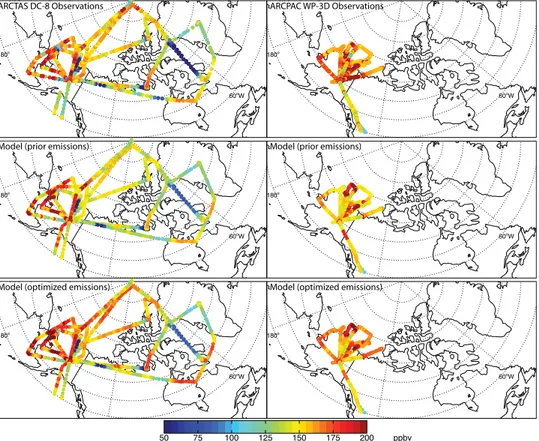
Observed and modeled CO concentrations along the ARC-TAS and ARCPAC flight tracks are shown in Fig. 3. Ob-served concentrations during ARCTAS ranged from 23 to 296 ppbv (excluding observations south of 55◦N from transit flights). Less than 1% of the observations had concentrations greater than 250 ppbv. Low values signify stratospheric air and are removed for subsequent analysis as described below. Observed concentrations during ARCPAC ranged from 96 to 383 ppbv. The highest CO concentrations were observed over and around Alaska and were due to Asian pollution and Russian fires, as discussed below. High-CO layers were also sampled elsewhere, in particular near the North Pole by the DC-8. The GEOS-Chem simulation with prior emissions (Fig. 3, middle panels) shows qualitative agreement with the observations but quantitative discrepancies are evident. Modeled concentrations are generally too low, although they are sometimes too high in plumes over and around Alaska,
1011
molec/cm2
/s
0 5 10 25 50 100 250 400
Fig. 1. CO combustion sources for April 2008 (excluding secondary CO from oxidation of biogenic NMVOCs and methane). Values are shown for the optimized simulation but patterns are similar for the prior simulation.
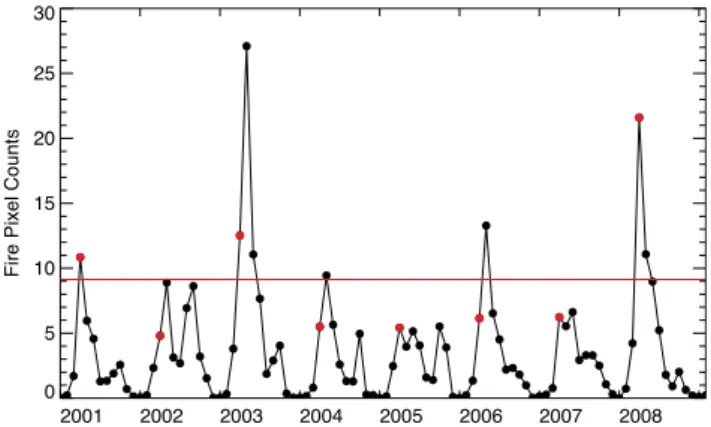
2001 2002 2003 2004 2005 2006 2007 2008 0
5 10 15 20 25 30
Fire Pixel Counts
Fig. 2. Monthly mean fire counts (cloud and overpass corrected) for southern Russia and Kazakhstan (33–60◦N, 60–152.5◦E) from the MODIS instrument aboard the Terra satellite. Fire counts for April of each year are in red. The red solid line shows the 2001–2008 April mean. Data courtesy of NASA Goddard Earth Sciences Data and Information Services Center.
suggesting different model errors for the different sources af-fecting the Arctic.
Figure 4 shows the median vertical distribution of the air-craft CO observations along with the corresponding model values. Stratospheric observations, diagnosed as [O3]/[CO]
>1.25 mol mol−1(Hudman et al., 2007), were removed from the data set. The median observed CO concentration at the surface was 160 ppbv. The data show little or no decrease up to 5 km and a sharp decrease above. The ARCTAS data show the most variability in the mid-troposphere (3–6 km). The ARCPAC data show greater variability than the ARC-TAS data at all altitudes.
180o
60oW
180o
60oW
180o
60oW
50 75 100 125 150 175 200 ppbv
180o
60oW ARCTAS DC-8 Observations
Model (prior emissions)
ARCPAC WP-3D Observations
Model (prior emissions)
180o
60oW Model (optimized emissions)
180o
60oW Model (optimized emissions)
Fig. 3. CO concentrations during ARCTAS (1 to 19 April 2008) and ARCPAC (3 to 23 April 2008). Aircraft observations (top) are compared to model values sampled along the flight tracks and using prior (middle) or optimized (bottom) emissions. The flight tracks extend from 0 to 12 km (ARCTAS) and 8 km (ARCPAC); low values correspond to the stratosphere. Observations south of 55◦N taken during transit flights are excluded. For ARCTAS flights, observed CO concentrations range from 23 to 296 ppbv, while modeled concentrations range from 33 to 243 ppbv with prior emissions and 34 to 226 ppbv with optimized emissions. For ARCPAC flights, observed concentrations range from 96 to 383 ppbv, while modeled concentrations range from 112 to 255 ppbv with prior emissions and 115 to 221 ppbv with optimized emissions.
to both aircraft data sets, the model is 10 ppbv too low near the surface. This difference decreases with altitude and dis-appears in the upper troposphere. The underestimate of CO at northern extratropical latitudes in spring is a general prob-lem in current CTMs (Shindell et al., 2006b). We correct the discrepancy here by adjusting emissions based on the as-sumption that emission errors in the model are systematic, model transport errors are random, and model OH errors are small. We thus estimate the correction to emissions by per-forming least squares multiple linear regression to the air-craft observations of model results for five tagged tracers of CO sources: (1) North American anthropogenic (fossil fuel and biofuel), (2) European anthropogenic, (3) Asian an-thropogenic, (4) Russian biomass burning, and (5) Southeast Asian biomass burning. Emissions from these five sources are assumed to represent the only sources of model error. The regression is performed after first subtracting the modeled contribution from all other sources from the total modeled and observed CO. The resulting fit coefficients represent the source corrections needed to minimize the discrepancy be-tween observations and model. The fit is conducted using all
tropospheric data from both ARCTAS (1454 points from 9 flight days) and ARCPAC (1251 points from 9 flight days), including data from transit flights to the Arctic.
Table 2 shows the emission scaling factors from the least squares fit with confidence intervals determined using the bootstrap method. The resulting emission estimates are given in Table 1 and Fig. 1. We find that we need to increase an-thropogenic emissions from East Asia and from Europe to correct the underestimate of the background (Fig. 4) and in the eastern part of the ARCTAS domain (Fig. 3). No correc-tion is needed for our North American anthropogenic emis-sions (Table 2), where our prior emisemis-sions are consistent with other observational constraints (Hudman et al., 2008; Kopacz et al., 2010).
100 120 140 160 180 200
CO, ppbv
0 2 4 6 8 10
Altitude, km
Observations
Prior Model
Optimized Model
100 120 140 160 180 200
CO, ppbv
0 2 4 6 8 10
Altitude, km
Observations
Prior Model
Optimized Model
ARCTAS ARCPAC
Fig. 4. Median vertical distribution of CO concentrations in ARCTAS (1 to 19 April 2008) and ARCPAC (3 to 23 April 2008), averaged over 1-km altitude bins. Observations are compared to model values with prior and optimized emissions. Black horizontal bars show the interquartile range of the observations. Stratospheric observations identified by [O3]/[CO]>1.25 mol mol−1have been removed.
1.5 2.0 2.5 3.0
Total CO column (10
18
molec/cm
2)
5 10 15 20
April 1
Observations Prior Model
Optimized Model
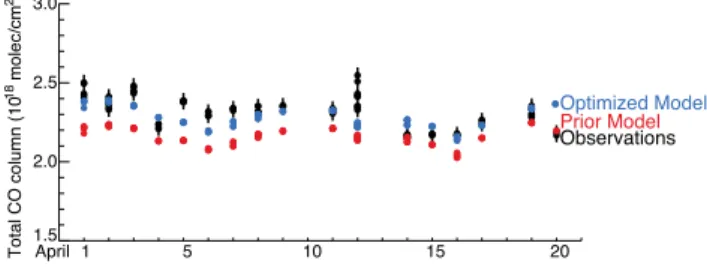
Fig. 5. CO columns at Eureka, Nunavut, Canada (86.4◦W, 80.0◦N) from 1 to 20 April 2008. Measurements by a ground-based Fourier Transform Spectrometer are compared to model values with both prior and optimized sources. Black vertical bars show the uncer-tainties of the measurements.
summer. Their optimized April anthropogenic emissions of 8.0 Tg month−1for Europe and 28 Tg month−1for Asia are consistent with our estimates of 9.4 Tg month−1for Europe and 26 Tg month−1for Asia. Kopacz et al. (2010) suggested that the spring underestimate in the inventories may reflect emissions from residential fuel use and vehicle cold starts. These sources are included in the Zhang et al. (2009) inven-tory used as our prior for Asia but with the assumptions that residential fuel use peaks from November through March and that cold starts have no seasonal variation. It is unlikely that the discrepancy over Asia reflects growth in CO emissions since 2006 (the base year for the emissions inventory), as recent increased energy use has largely been offset by tech-nology renewals (Zhang et al., 2009).
The ARCTAS and ARCPAC data suggest that we need to decrease biomass burning emissions in the FLAMBE inven-tory by a factor of 0.5 over southern Russia and by a factor of 0.4 over Southeast Asia. The downward correction re-sults in an optimized estimate of 15 Tg CO from Russian fires and 23 Tg CO from Southeast Asian fires in April, the latter in agreement with previous estimates of 18–23 Tg month−1 (Duncan et al., 2003; Heald et al., 2003b).
Table 2. Correction factors to prior CO combustion sources in GEOS-Chema.
Source Correction factor
North American anthropogenic 0.96±0.16 European anthropogenic 1.52±0.18 Asian anthropogenic 1.18±0.11 Russian biomass burning 0.53±0.09 Southeast Asian biomass burning 0.45±0.11
aSource correction factors to the prior emission inventories of
Ta-ble 1, derived using a multiple linear regression between GEOS-Chem tagged tracers and aircraft observations from ARCTAS (1 to 19 April 2008) and ARCPAC (3 to 23 April 2008) as described in the text. Anthropogenic sources include fossil fuel and biofuel. Er-rors show the 95% confidence interval calculated by the bootstrap method.
Modeled CO concentrations from the optimized simula-tion are shown along the flight tracks in Fig. 3 (lower pan-els) and the profiles are shown as blue lines in Fig. 4. The source correction eliminates the model error below 4 km for both campaigns. Above 4 km, the optimization eliminates the error relative to ARCTAS but not ARCPAC. After source correction, the Pearson correlation coefficient between ob-servations and simulation improves fromr= 0.50 tor= 0.60 for ARCTAS and fromr= 0.49 tor= 0.53 for ARCPAC. The low correlation coefficients are driven by the high CO values found in some fine-structure plumes, where large model er-ror is expected due to both plume smearing and displacement (Rastigejev et al., 2010). We tried removing the plumes be-fore performing the least squares fit but this did not signifi-cantly alter the resultant source correction factors.
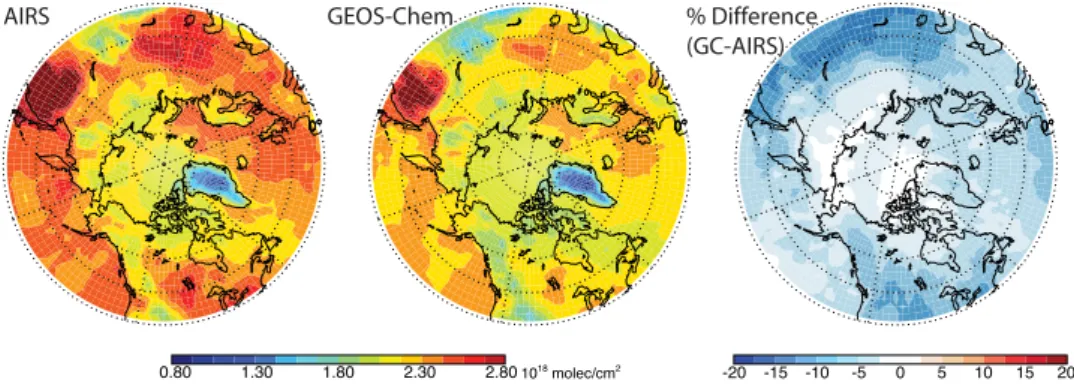
0.80 1.30 1.80 2.30 2.801018
molec/cm2
-20 -15 -10 -5 10 15 20%
AIRS GEOS-Chem % Difference
(GC-AIRS)
5 0
0o
0o
0o
0o 0000oooo 0000oooo
Fig. 6. Mean CO columns during April 2008 observed by the AIRS satellite instrument (version 5) and simulated by GEOS-Chem with optimized sources (and AIRS averaging kernels applied). The right panel shows the percent difference between the two. GEOS-Chem was sampled along the AIRS orbit tracks at the time of successful retrievals (see text).
0 10 20 30 40 50 60
CO [ppbv] 0
2 4 6 8 10
Altitude [km]
N.A. Anth. Eur. Anth.As. Anth. As. BBRus. BB
ARCTAS
0 10 20 30 40 50 60
CO [ppbv] 0
2 4 6 8 10
Altitude [km]
N.A. Anth.Eur. Anth.As. Anth. As. BBRus. BB
ARCPAC
Fig. 7. Median vertical distribution along the ARCTAS and ARCPAC flight tracks of GEOS-Chem CO concentrations tagged by source region and type: Asian anthropogenic (As. Anth., blue), European anthropogenic (Eur. Anth., green), North American anthropogenic (N.A. Anth., red), Russian biomass burning (Rus. BB, orange) and Southeast Asian biomass burning (As. BB, purple). Horizontal bars are standard deviations.
2009). Intercomparison with the DC-8 during a spiral over the site on 8 April 2008 showed agreement within 0.01×10¹⁸molecules cm−2(0.5%). Figure 5 shows that the
source correction reduces the mean model bias relative to ob-servations from−6% with prior sources to−1% with opti-mized sources.
Figure 6 shows the mean April 2008 AIRS CO columns compared to the GEOS-Chem model values from the opti-mized simulation. Both AIRS and GEOS-Chem show the highest pollution levels in the European sector of the tic, followed by the Asian sector. The North American Arc-tic is least polluted. Transport of European pollution takes place directly northward over Scandinavia, while transport from Asia is northeastward, entering the Arctic over Siberia and Alaska. Averaged over the Arctic, GEOS-Chem is 3% lower than AIRS. Comparison with the prior simulation (not shown) revealed positive errors over the southern Russian fire source and outflow regions due to the significant overesti-mate of fire emissions. Meanwhile, the optimized GEOS-Chem simulation shows the largest underestimate over the region of the Russian fires, which may indicate that the fac-tor of two downward correction to the FLAMBE invenfac-tory is too large.
4 Sources of Arctic pollution in April 2008
We use the GEOS-Chem tagged tracers to decompose the optimized simulated CO vertical profiles from ARCTAS and ARCPAC (Fig. 4, blue lines) into the contributions from indi-vidual sources. Figure 7 shows the median profiles along the flight tracks of the five dominant sources, which on average account for 67% of total CO during the campaigns. For both campaigns, mean concentrations are dominated by Asian an-thropogenic emissions along with a substantial contribution from European anthropogenic emissions, especially at low altitude. These mean contributions largely reflect the winter-time accumulation of CO over the scale of the northern ex-tratropical hemisphere. Emissions from Russian fires, which did not begin until April (Fig. 2), have much less impact on the mean pollution influence.
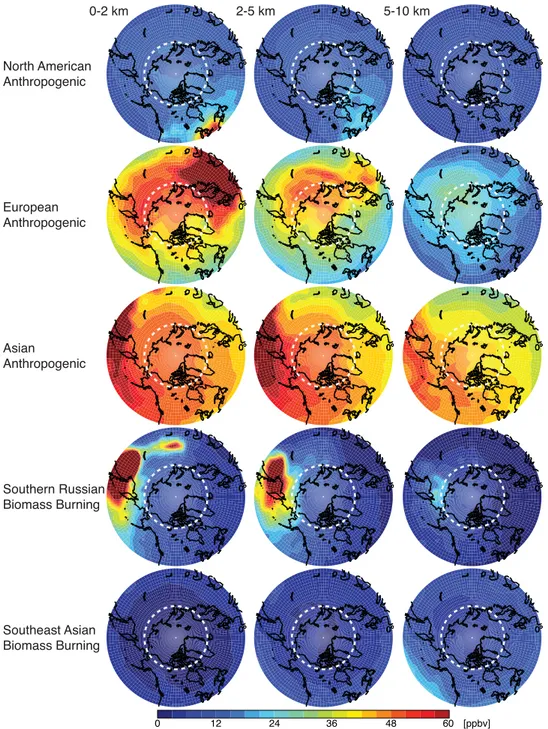
0o 0o 0o 0o 0o
0o 0o 0o
0 24 36 48 60 [ppbv]
North American Anthropogenic
European Anthropogenic
Asian
Anthropogenic
Southern Russian Biomass Burning
Southeast Asian Biomass Burning
0-2 km 2-5 km 5-10 km
12
0o 0o 0o 0o
0o 0o 0o 0o
0o 0o 0o 0o
0o 0o 0o 0o
0o 0o 0o 0o
0o 0o 0o
0o 0000oooo
0o 0o 0o
0o 0000oooo
0o 0o 0o
0o 0000oooo
0o 0o 0o
0o 0000oooo
Fig. 8. Contributions of different mid-latitude source regions to CO pollution in the Arctic in April 2008, as indicated by the GEOS-Chem simulation. Results are shown as mean CO mixing ratios in altitude bands of 0–2, 2–5, and 5–10 km. The Arctic Circle is indicated by a dashed white line.
is comparable to the contributions from the continental an-thropogenic sources, reflecting differences in sampling strat-egy between the two campaigns. The Asian anthropogenic and Southeast Asian biomass burning sources dominate vari-ability in the upper troposphere for the ARCTAS flights. This reflects the dominant pathway of Asian outflow in spring in-volving uplift in WCBs off the Pacific coast, as was previ-ously observed in the TRACE-P aircraft campaign (Liu et al.,
Figure 8 shows the April 2008 mean contributions of each tracer in different altitude bands over the scale of the Arc-tic. Asian anthropogenic emission is the dominant contrib-utor throughout the Arctic above 2 km, reflecting the high-altitude WCB transport pathway. There is some lifting of European pollution affecting the middle troposphere in the European and Siberian sectors of the Arctic. In the bound-ary layer, Asian and European anthropogenic influences are of comparable magnitude but have distinct geographical sig-natures. European influence dominates in the European sec-tor of the Arctic, reflecting near-surface northward transport over Scandinavia, and also over eastern Siberia, reflecting westerly transport. We see from Fig. 8 that this trans-Siberian transport is the dominant pathway by which European pollu-tion affects Alaska. Our finding of European influence lifted to the middle troposphere and transported across Siberia in April differs from the prevailing winter situation (Klonecki et al., 2003; Stohl, 2006) when European pollution is strongly confined to the boundary layer and the circulation around the Siberian high carries it to the Arctic rather than eastward across Siberia.
Relative to other anthropogenic sources, pollution from North America makes little contribution to Arctic back-ground concentrations. North American influence is limited to the lowest 5 km and to the Canadian Archipelago, Davis Strait, and Greenland. Like Asian sources, North American emissions reach the Arctic via uplift and transport associated with WCBs (Stohl, 2006); however, CO emissions in North America are much weaker than in Asia (Table 1).
Shindell et al. (2008) previously found in a multi-model CO intercomparison that the Arctic in spring was most sensi-tive to European sources, followed by North American then Asian sources. The difference with our results reflects the magnitude of emissions. The multi-model mean total emis-sions (anthropogenic and biomass burning) in Shindell et al. (2008) were 156, 90, and 129 Tg a−1for East Asia, Eu-rope, and North America, respectively; whereas our cor-responding totals are 234, 135, and 77 Tg a−1 for anthro-pogenic sources alone. Our higher Asian emissions and lower North American emissions are consistent with recent inverse analyses (Heald et al., 2004; Streets et al., 2006; Hud-man et al., 2008; Tanimoto et al., 2008; Fortems-Cheiney et al., 2009; Kopacz et al., 2009, 2010).
Although Southeast Asian fires were a large northern hemispheric source of CO during April 2008 (Fig. 1 and Ta-ble 1), their influence on the Arctic is minimal because of the low latitude of emissions and the dominance in spring of venting by deep convective events (Liu et al., 2003). The small fraction of these emissions that reaches the Arctic does so in the upper troposphere (Figs. 7 and 8), reflecting isen-tropic transport (Klonecki et al., 2003) along with transport by WCBs (Bey et al., 2001; Liu et al., 2003; Liang et al., 2004). Even in the upper troposphere, the Southeast Asian fire influence is smaller than the Asian anthropogenic influ-ence.
5 Variability of Arctic pollution observed by AIRS
AIRS provides a unique perspective on variability of trans-port to the Arctic. In this section we first test the ability of AIRS to observe long-range pollution transport to the Arctic by investigating two pollution events of different origins ob-served by the aircraft during ARCTAS. We then assess the representativeness of the April 2008 observations using the AIRS multi-year record (2003–2008) and more generally in-terpret the interannual variability observed by AIRS.
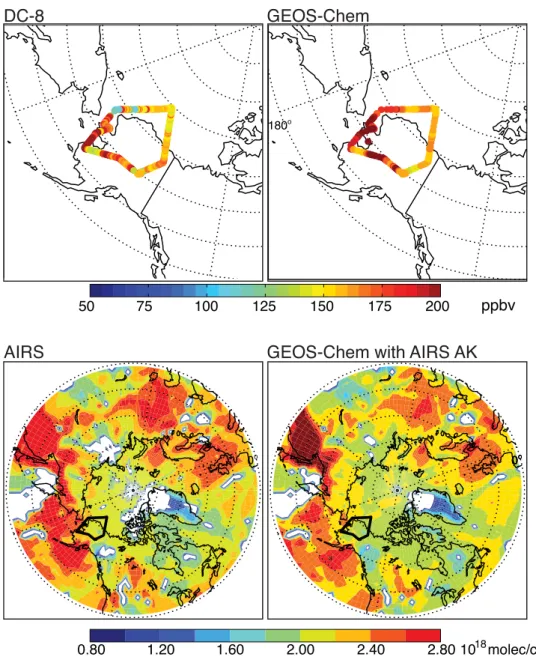
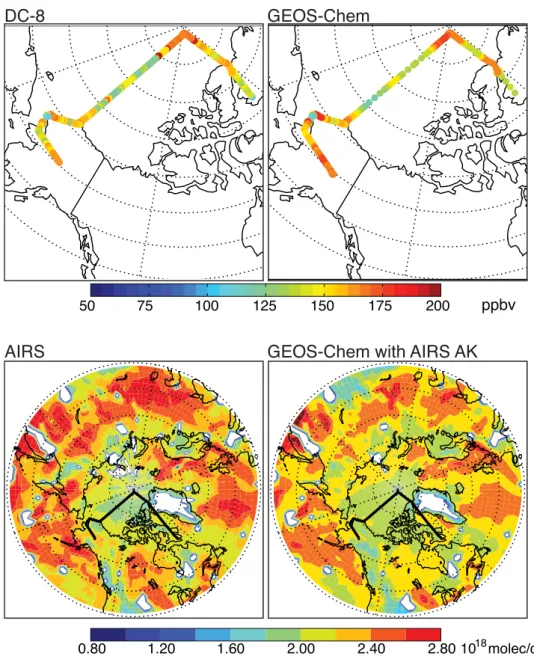
AIRS version 5 total column retrievals for 2003–2007 have been validated against FTIR data at three high latitude sites and show excellent agreement (Yurganov et al., 2009). At Ny Alesund (80◦N), the mean annual bias is near zero. Mean bias is also near zero at Kiruna (68◦N) and Harestua (60◦N) for DOF for signal greater than 0.7, but negative biases are observed at lower DOF. Overall, northern hemi-spheric AIRS total column observations in April show an 8% negative bias relative to FTIR data. Validation of AIRS CO retrievals in the northern hemisphere with aircraft in situ profiles indicates AIRS is biased approximately 10% high from 300–900 mb with little quantitative sensitivity to the boundary layer, like all thermal IR sounders (McMillan et al., 2009). In the Arctic, this lack of sensitivity may be com-pounded by the cold surface. We therefore expect AIRS to be capable of identifying transport to the Arctic in the mid-troposphere but not at low altitude, and test this below with two case studies of pollution plumes observed by ARCTAS. Figure 9 shows CO concentrations on 16 April 2008 ob-served by the DC-8 aircraft and total column CO obob-served by AIRS, together with the corresponding GEOS-Chem val-ues. CO concentrations of up to 250 ppbv, among the highest during the ARCTAS campaign, were observed at altitudes of 3.5–5 km over western Alaska and the Norton Sound during this flight. The enhancement was well captured by GEOS-Chem, which shows the source to be a mix of Asian pol-lution and Eurasian fires. Further evidence for a biomass burning source comes from elevated observations of hydro-gen cyanide (HCN) and acetonitrile (CH3CN). More than
ppbv
DC-8
AIRS
GEOS-Chem
GEOS-Chem with AIRS AK
10 molec/cm18 2
50 75 100 125 150 175 200
0.80 1.20 1.60 2.00 2.40 2.80
0o 180o
0o 0o 0o 0o
Fig. 9. Russian biomass burning event over Alaska sampled by the DC-8 aircraft on 16 April 2008. The top panels show aircraft observations of CO concentrations compared to the GEOS-Chem model. The bottom panels show the AIRS CO column concentrations observed on that day compared to the GEOS-Chem model with AIRS averaging kernels applied.
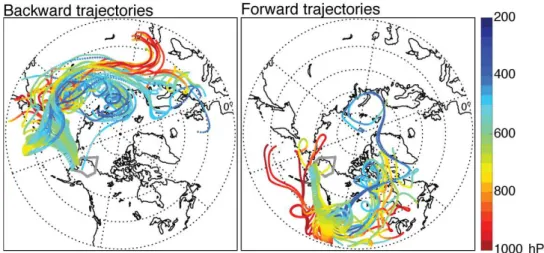
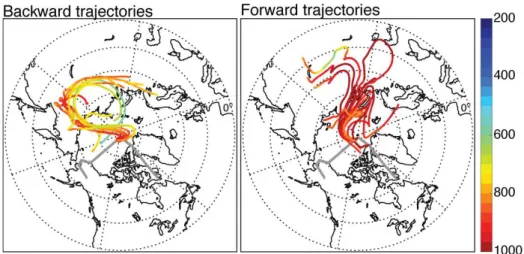
Figure 11 shows a different case on 9 April 2008, when a CO enhancement was observed by the aircraft at the North Pole at altitudes below 2 km. Concentrations in the plume were 165–170 ppbv. Backward trajectories (Fig. 12) indi-cate that the plume traveled slowly from northeastern Europe across Siberia, remaining at low altitude. Although trajecto-ries pass over the Russian burning region, this was before the most intense fires began, and observed concentrations of HCN and CH3CN were negligible. GEOS-Chem captures
the plume and indicates that the primary source was Euro-pean pollution mixed with some Asian pollution. Forward trajectories show that much of the polluted airmass remained
at low altitude over the pole for at least the next ten days. We do not expect AIRS to be sensitive to such low-altitude transport, and indeed we see from Fig. 11 that neither AIRS nor the GEOS-Chem simulation weighted by AIRS averag-ing kernels could detect the plume.
Fig. 10. Ten-day backward and forward trajectories from the FLEXPART model using WRF meteorological fields and starting from the 16 April 2008 plume shown in Fig. 9. The color scale indicates altitude.
mid-tropospheric transport, which as we have seen privileges Asian influence.
The 2003–2008 April mean CO columns from AIRS are shown in Fig. 13, along with the anomalies for each year. The major features described for 2008 (Fig. 6 and Sect. 3) are also seen in the multi-year mean, with the Euro-pean sector of the Arctic being the most polluted and the North American sector the cleanest. The anomaly maps show little variability north of the Arctic Circle. Mean April CO column ranges from 2.06×10¹⁸molecules cm−2to
2.11×10¹⁸molecules cm−2, despite larger year-to-year dif-ferences at mid-latitudes, and is most strongly correlated with mean Arctic sea level pressure (SLP) in the GEOS-5 data (r=−0.81). We attribute this anti-correlation to the higher degree of Arctic isolation associated with high pres-sure conditions, preventing poleward transport of CO from mid-latitudes.
Pollution transport to the Arctic is thought to be enhanced under the positive phase of the North Atlantic Oscillation (NAO) (Eckhardt et al., 2003; Duncan and Bey, 2004) due to stronger surface westerlies and anomalous southerly flow (Hurrell et al., 2003). Previous studies found strong posi-tive correlations, most pronounced at the surface, between NAO strength and Arctic pollution accumulation in winter and spring (Eckhardt et al., 2003; Duncan and Bey, 2004). However, we find no significant correlation of AIRS CO over the Arctic in April 2003–2008 with the February–April mean NAO index (taken from the NOAA Climate Prediction Cen-ter, available at http://www.cpc.noaa.gov). This could reflect limitations due to (1) our focus on spring, when the NAO in-dex is typically weak (Hurrell et al., 2003), (2) the lack of sensitivity of AIRS to surface concentrations where the cor-relation is strongest, and (3) the limited range of NAO index variability (less than±1) over the 2003–2008 period of the AIRS record.
AIRS observations for April 2008 show that despite the anomalously large Russian fire source, pollution influence over Alaska was much weaker than normal (Fig. 13). This can be explained by a strong SLP anomaly, as shown in Fig. 14. Positive pressure anomalies of more than 10 hPa were seen over the North Pacific with weaker negative anomalies further north, indicating that the climatological Aleutian low pressure system was less intense and shifted northward. Considering that the Aleutian low and associated storm tracks are a major driver for transport of Asian pollu-tion to the Arctic (Fuelberg et al., 2010), this transport may have been weaker than normal in April 2008.
ppbv
DC-8
AIRS
GEOS-Chem
GEOS-Chem with AIRS AK
10 molec/cm18 2
50 75 100 125 150 175 200
0.80 1.20 1.60 2.00 2.40 2.80
0o 0000oooo
Fig. 11. Same as Fig. 9, but for a European pollution event at the North Pole on 9 April 2008.
less intense Aleutian low and an associated decrease in Asian pollution influence during April 2008. The La Ni˜na persisted through April (ONI =−0.8) and began to dissipate in May.
The specific meteorological conditions that characterized April 2008 have important implications for the interpretation of the ARCTAS and ARCPAC aircraft data. As discussed in Sect. 4, we find from these data that CO pollution throughout the Arctic is dominated by the Asian anthropogenic source, despite the anomalously weak poleward transport from this source in April 2008. El Ni˜no conditions would be expected to lead to larger Asian influence and consequently more CO pollution in the Arctic. Such an effect may be further am-plified by increased biomass burning, which has been shown to play a dominant role in increasing CO concentrations over
Alaska during El Ni˜no events (Szopa et al., 2007). In 2003, the only El Ni˜no year in our record, CO columns were indeed anomalously high over Alaska, the Chukchi Sea, and much of the North American Arctic (Fig. 13).
Fig. 12. Same as Fig. 10, but for the European pollution event on 9 April 2008 shown in Fig. 11.
0.80 1.30 1.80 2.30 2.80 1018
molec/cm2
-10 -5 0 5 10 % 2003-2008
April mean
2003 2004 2005
2006 2007 2008
1000 1006 1012 1018 1025 hPa
-10 -5 0 5 10
hPa
2003-2008 April Mean SLP 2008 April Mean SLP 2008 April SLP Anomalies
Fig. 14. Mean sea level pressures from GEOS-5 for April 2003–2008 (left) and 2008 only (middle). The 2008 anomaly is shown at right.
2003 2004 2005 2006 2007 2008
Time 1.8
2.0 2.2 2.4
AIRS CO column (10
18
molec/cm
2)
-4 -2 0 2 4
FMA mean Ocean Niño Index
Fig. 15. Year-to-year variability of the mean April AIRS-observed CO column over Alaska (168–140◦W, 54–72◦N) and mean Ocean Ni˜no Index (ONI) averaged over February-April for each year. Pos-itive values of the ONI (red) indicate El Ni˜no conditions while neg-ative values (blue) indicate La Ni˜na conditions. The Pearson corre-lation coefficient ofr= 0.80 is significant at thep= 0.10 level. The ONI data were obtained from the NOAA Climate Prediction Center, available at http://www.cpc.noaa.gov.
April 2008. Whether this enhancement is indeed linked to the more positive phase of the ONI in 2005 is unclear, and additional data and simulations during a strong El Ni˜no year would be needed to verify this link.
6 Conclusions
We used CO observations from the NASA ARCTAS and NOAA ARCPAC aircraft campaigns as top-down constraints in a global 3-D chemical transport model (GEOS-Chem) to quantify the sources of pollution to the Arctic in spring 2008. Through comparisons with aircraft and GEOS-Chem, we demonstrated that AIRS satellite measurements of CO cap-tured the mean spatial structure of Arctic pollution in April
2008 as well as events in the free troposphere but did not de-tect events in the boundary layer because of low sensitivity in the thermal IR. We subsequently used the 2003–2008 record of AIRS CO observations in the Arctic in April to investigate the interannual variability of pollution transport from north-ern mid-latitudes.
Least squares regression of the GEOS-Chem CO simula-tion to the ARCTAS and ARCPAC aircraft observasimula-tions sug-gests that anthropogenic CO emissions in Europe in April 2008 are underestimated by 50% in the EMEP inventory and anthropogenic emissions in Asia are underestimated by 20% in the Streets et al. (2006) inventory updated for 2008. The discrepancy likely represents an underestimate of seasonal CO emissions rather than a problem in global annual emissions. This result is consistent with the cent inverse analysis of Kopacz et al. (2010) and may re-flect a winter-spring underestimate of emissions from res-idential fuel use and vehicle cold starts. April 2008 saw anomalous fire activity in southern Russia in addition to seasonal biomass burning in Southeast Asia. We find that the FLAMBE inventory with hourly resolution based on MODIS and GOES fire data overestimates these emissions by a factor of two. Optimized April 2008 emissions obtained by fitting GEOS-Chem to the ARCTAS aircraft data are 26 Tg month−1for Asian anthropogenic, 9.4 Tg month−1for European anthropogenic, 4.1 Tg month−1 for North Amer-ican anthropogenic, 15 Tg month−1 for Russian biomass burning, and 23 Tg month−1 for Southeast Asian biomass burning. The resulting simulation shows no significant bias (mean of−1%) relative to ground-based column data at Eu-reka (80◦N, 86◦W). It also shows a−3% underestimate rel-ative to AIRS in the Arctic, although this may reflect in part a high bias in the AIRS data (McMillan et al., 2009).
0-2 km
2-5 km
5-10 km
[ppbv]
34 46 58 70
22 10
2005
2008
0o
0o
0o
0o
0o
0o
0o
0o
0o
0o
0o
0o 0000oooo
0o
0o
0o
0o
0o
0o
0o
0o
Fig. 16. Concentrations of the Asian fossil fuel CO tagged tracer in the GEOS-Chem simulation for April 2005 versus April 2008 meteorol-ogy with identical April 2008 emissions for both years. Results are shown as April mean CO mixing ratios at 0–2, 2–5, and 5–10 km.
biomass burning emissions in April 2008, reflects the win-tertime accumulation of anthropogenic CO on the scale of the northern extratropics. European pollution influence in April extends to the free troposphere and also across Siberia following westerly flow. This contrasts with the prevailing pattern in winter when stratification confines European pollu-tion to the surface and the Siberian high pressure system
long-range transport of pollution to the Arctic in the middle troposphere but not at the surface.
AIRS CO observations in April, both for 2008 and for the multiyear record (2003–2008), show the highest lev-els of pollution in the European Arctic sector, followed by the Asian sector and with the North American sector being cleanest. This is consistent with GEOS-Chem, where synop-tic lifting of European pollution contributes to the European sector. The North American sector is relatively clean, despite WCB injections off the east coast of North America, because CO emissions there are relatively small. Mean April AIRS CO columns for 2003–2008 show little interannual variabil-ity when averaged over the Arctic polar cap. What little vari-ability exists is most strongly correlated with Arctic sea level pressure (r=−0.81) and can be explained by decreased pol-lution inflow from mid-latitudes under high-pressure condi-tions. We find little correlation with the NAO index, which could reflect the limited range of this index in spring over the 2003–2008 period as well as AIRS’s lack of sensitivity in the boundary layer.
AIRS CO columns over Alaska in April 2008 are anoma-lously low compared to other years, despite the anomaanoma-lously high Russian biomass burning influence. We find that AIRS CO in this region is highly correlated with the Ocean Ni˜no Index (r= 0.80). The low CO columns over Alaska in April 2008 were associated with La Ni˜na conditions in fall 2007 through spring 2008 that weakened the Aleutian low pressure system. As a result, transport of Asian pollution to the Arctic was likely suppressed. We verified this result by comparing GEOS-Chem simulations for April 2005 (weak El Ni˜no) and April 2008. This suggests that the impact of Asian pollu-tion in the Arctic could be very large under strong El Ni˜no conditions, so far missing from the AIRS record.
Acknowledgements. This work was supported by the NASA
Tropospheric Chemistry Program and the NASA Atmospheric Composition Modeling and Analysis Program. The FTS mea-surements at Eureka were made as part of the Canadian Arctic ACE validation campaigns and by the Canadian Network for the Detection of Atmospheric Change, supported by the Canadian Foundation for Climate and Atmospheric Science, Canadian Foundation for Innovation, Canadian Space Agency, Environment Canada, Government of Canada International Polar Year fund-ing, Ontario Research Fund, Natural Sciences and Engineering Research Council, Northern Scientific Training Program, Polar Continental Shelf Program, and the Atlantic, Nova Scotia and Ontario Innovation Trusts. WWM thanks the AIRS Project Office for support. JAF acknowledges support from a National Defense Science and Engineering Graduate Fellowship.
Edited by: P. Monks
References
Acker, J. G. and Leptoukh, G.: Online analysis enhances use of NASA earth science data, Eos Trans. AGU, 88(2), p. 14 and p. 17, 2007.
Andreae, M. O. and Merlet, P.: Emission of trace gases and aerosols from biomass burning, Global Biogeochem. Cy., 15, 955–966, 2001.
Barrie, L. A.: Arctic air pollution: An overview of current knowl-edge, Atmos. Environ., 20, 643–663, 1986.
Batchelor, R. L., Strong, K., Lindenmaier, R., Mittermeier, R. L., Fast, H., Drummond, J. R., and Fogal, P. F.: A new Bruker IFS 125HR FTIR spectrometer for the Polar Environ-ment Atmospheric Research Laboratory at Eureka, Canada: measurements and comparison with the existing Bomem DA8 spectrometer, J. Atmos. Ocean. Tech., 26, 1328–1340, doi:10.1175/2009JTECHA1215.1 2009.
Bey, I., Jacob, D. J., Logan, J. A., and Yantosca, R. M.: Asian chemical outflow to the Pacific in spring: Origins, pathways, and budgets, J. Geophys. Res., 106, 23097–23113, 2001.
Bjerknes, J.: A possible response of the atmospheric Hadley circu-lation to equatorial anomalies of the ocean temperature, Tellus, 18, 820–829, 1966.
Carlson, T. N.: Speculations on the movement of polluted air to the Arctic, Atmos. Environ., 15, 1473–1477, 1981.
Duncan, B. N., Martin, R. V., Staudt, A. C., Yevich, R., and Logan, J. A.: Interannual and seasonal variability of biomass burning emissions constrained by satellite observations, J. Geophys. Res., 108(D2), 4100, doi:10.1029/2002JD002378, 2003.
Duncan, B. N., and Bey, I.: A modeling study of the export pathways of pollution from Europe: Seasonal and interan-nual variations (1987–1997), J. Geophys. Res., 109, D08301, doi:10.1029/2003JD004079, 2004.
Duncan, B. N., Logan, J. A., Bey, I., Megretskaia, I. A., Yan-tosca, R. M., Novelli, P. C., Jones, N. B., and Rinsland, C. P.: Global budget of CO, 1988–1997: Source estimates and val-idation with a global model, J. Geophys. Res., 112, D22301, doi:10.1029/2007JD008459, 2007.
Duncan, B. N. and Logan, J. A.: Model analysis of the factors reg-ulating the trends and variability of carbon monoxide between 1988 and 1997, Atmos. Chem. Phys., 8, 7389–7403, 2008, http://www.atmos-chem-phys.net/8/7389/2008/.
Eckhardt, S., Stohl, A., Beirle, S., Spichtinger, N., James, P., Forster, C., Junker, C., Wagner, T., Platt, U., and Jennings, S. G.: The North Atlantic Oscillation controls air pollution trans-port to the Arctic, Atmos. Chem. Phys., 3, 1769–1778, 2003, http://www.atmos-chem-phys.net/3/1769/2003/.
Fortems-Cheiney, A., Chevallier, F., Pison, I., Bousquet, P., Carouge, C., Clerbaux, C., Coheur, P. F., George, M., Hurtmans, D., and Szopa, S.: On the capability of IASI measurements to in-form about CO surface emissions, Atmos. Chem. Phys., 9, 8735– 8743, 2009, http://www.atmos-chem-phys.net/9/8735/2009/. Fuelberg, H. E., Harrigan, D. L., and Sessions, W.: A
meteoro-logical overview of the ARCTAS 2008 mission, Atmos. Chem. Phys., 10, 817–842, 2010,
http://www.atmos-chem-phys.net/10/817/2010/.
http://www.atmos-chem-phys.net/6/3181/2006/.
Heald, C. L., Jacob, D. J., Fiore, A. M., Emmons, L. K., Gille, J. C., Deeter, M. N., Warner, J., Edwards, D. P., Crawford, J. H., and Hamlin, A. J.: Asian outflow and trans-Pacific transport of car-bon monoxide and ozone pollution: An integrated satellite, air-craft, and model perspective, J. Geophys. Res., 108(D24), 4804, doi:10.1029/2003JD003507, 2003a.
Heald, C. L., Jacob, D. J., Palmer, P. I., Evans, M. J., Sachse, G. W., Singh, H. B., and Blake, D. R.: Biomass burning emission inventory with daily resolution: Application to aircraft obser-vations of Asian outflow, J. Geophys. Res.-Atmos., 108(D21), 8811, doi:10.1029/2002JD003082, 2003b.
Heald, C. L., Jacob, D. J., Jones, D. B. A., Palmer, P. I., Logan, J. A., Streets, D. G., Sachse, G. W., Gille, J. C., Hoffman, R. N., and Nehrkorn, T.: Comparative inverse analysis of satellite (MO-PITT) and aircraft (TRACE-P) observations to estimate Asian sources of carbon monoxide, J. Geophys. Res., 109, D23306, doi:10.1029/2004JD005185, 2004.
Heald, C. L., Jacob, D. J., Park, R. J., Alexander, B., Fairlie, T. D., Yantosca, R. M., and Chu, D. A.: Transpacific transport of Asian anthropogenic aerosols and its impact on surface air quality in the United States, J. Geophys. Res., 111, D14310, doi:10.1029/2005JD006847, 2006.
Hegg, D. A., Warren, S. G., Grenfell, T. C., Doherty, S. J., Lar-son, T. V., and Clarke, A. D.: Source attribution of black car-bon in arctic snow, Environ. Sci. Technol., 43, 4016–4021, doi:10.1021/es803623f, 2009.
Holloway, J. S., Jakoubek, R. O., Parrish, D. D., Gerbig, C., Volz-Thomas, A., Schmitgen, S., Fried, A., Wert, B., Henry, B., and Drummond, J. R.: Airborne intercomparison of vacuum ul-traviolet fluorescence and tunable diode laser absorption mea-surements of tropospheric carbon monoxide, J. Geophys. Res.-Atmos., 105(D19), 24251–24261, 2000.
Hudman, R. C., Jacob, D. J., Turquety, S., Leibensperger, E. M., Murray, L. T., Wu, S., Gilliland, A. B., Avery, M., Bertram, T. H., and Brune, W.: Surface and lightning sources of nitro-gen oxides over the United States: Magnitudes, chemical evo-lution, and outflow, J. Geophys. Res.-Atmos., 112, D12S05, doi:10.1029/2006JD007912, 2007.
Hudman, R. C., Murray, L. T., Jacob, D. J., Millet, D. B., Tur-quety, S., Wu, S., Blake, D. R., Goldstein, A. H., Holloway, J., and Sachse, G. W.: Biogenic vs. anthropogenic sources of CO over the United States, Geophys. Res. Lett., 35, L04801, doi:10.1029/2007GL032393, 2008.
Hurrell, J. W., Kushnir, Y., Ottersen, G., and Visbeck, M.: An overview of the North Atlantic oscillation, in: The North At-lantic Oscillation: Climatic Significance and Environmental Im-pact, edited by: Hurrell, J. W., Kushnir, Y., Ottersen, G., and Vis-beck, M., Geoph. Monog. Series, American Geophysical Union, 1–36, 2003.
Jacob, D. J., Crawford, J. H., Maring, H., Dibb, J. E., Clarke, A. D., Ferrare, R. A., Hostetler, C. A., Russell, P. B., Singh, H. B., Thompson, A. M., Shaw, G. E., McCauley, E., Pederson, J. R., and Fisher, J. A.: The ARCTAS aircraft mission: design and execution, Atmos. Chem. Phys. Discuss., 9, 17073–17123, 2009, http://www.atmos-chem-phys-discuss.net/9/17073/2009/. Jaegl´e, L., Jaffe, D. A., Price, H. U., Weiss-Penzias, P., Palmer, P.
I., Evans, M. J., Jacob, D. J., and Bey, I.: Sources and budgets for CO and O3 in the northeastern Pacific during the spring of
2001: Results from the PHOBEA-II Experiment, J. Geophys. Res., 108(D20), 8802, doi:10.1029/2002JD003121, 2003. Jaffe, D., Bertschi, I., Jaegl´e, L., Novelli, P., Reid, J. S., Tanimoto,
H., Vingarzan, R., and Westphal, D. L.: Long-range transport of Siberian biomass burning emissions and impact on surface ozone in western North America, Geophys. Res. Lett., 31, L16106, doi:0.1029/2004GL020093, 2004.
Kahn, R. A., Chen, Y., Nelson, D. L., Leung, F. Y., Li, Q., Diner, D. J., and Logan, J. A.: Wildfire smoke injection heights: Two perspectives from space, Geophys. Res. Lett., 35, L04809, doi:10.1029/2007GL032165, 2008.
Kiley, C. M., Fuelberg, H. E., Palmer, P. I., Allen, D. J., Carmichael, G. R., Jacob, D. J., Mari, C., Pierce, R. B., Pickering, K. E., and Tang, Y.: An intercomparison and evaluation of aircraft-derived and simulated CO from seven chemical transport models during the TRACE-P experiment, J. Geophys. Res.-Atmos., 108(D21), 8819, doi:10.1029/2002JD003089, 2003.
Klonecki, A., Hess, P., Emmons, L., Smith, L., Orlando, J., and Blake, D.: Seasonal changes in the transport of pollutants into the Arctic troposphere-model study, J. Geophys. Res., 108(D4), 8367, doi:10.1029/2002JD002199, 2003.
Koch, D., and Hansen, J.: Distant origins of Arctic black carbon: A Goddard Institute for Space Studies ModelE experiment, J. Geophys. Res., 110, D04204, doi:10.1029/2004JD005296, 2005. Koike, M., Jones, N. B., Palmer, P. I., Matsui, H., Zhao, Y., Kondo, Y., Matsumi, Y., and Tanimoto, H.: Seasonal variation of carbon monoxide in northern Japan: Fourier transform IR measurements and source-labeled model calculations, J. Geophys. Res.-Atmos., 111, D15306, doi:10.1029/2005JD006643, 2006.
Kopacz, M., Jacob, D. J., Henze, D. K., Heald, C. L., Streets, D. G., and Zhang, Q.: Comparison of adjoint and analyti-cal Bayesian inversion methods for constraining Asian sources of carbon monoxide using satellite (MOPITT) measurements of CO columns, J. Geophys. Res.-Atmos., 114, D04305, doi:10.1029/2007JD009264, 2009.
Kopacz, M., Jacob, D. J., Fisher, J. A., Logan, J. A., Zhang, L., Megretskaia, I. A., Yantosca, R. M., Singh, K., Henze, D. K., Burrows, J. P., Buchwitz, M., Khlystova, I., McMillan, W. W., Gille, J. C., Edwards, D. P., Eldering, A., Thouret, V., and Ned-elec, P.: Global estimates of CO sources with high resolution by adjoint inversion of multiple satellite datasets (MOPITT, AIRS, SCIAMACHY, TES), Atmos. Chem. Phys., 10, 855–876, 2010, http://www.atmos-chem-phys.net/10/855/2010/.
Kuhns, H., Knipping, E. M., and Vukovich, J. M.: Development of a United States-Mexico Emissions Inventory for the Big Bend Regional Aerosol and Visibility Observational (BRAVO) Study, J. Air Waste Manag., 55, 677–692, 2005.
Labonne, M., Br´eon, F.-M., and Chevallier, F.: Injection height of biomass burning aerosols as seen from a spaceborne lidar, Geo-phys. Res. Lett., 34, L11806, doi:10.1029/2007gl029311, 2007. Law, K. S. and Stohl, A.: Arctic Air Pollution: Origins and Impacts,
Science, 315, 1537, doi:10.1126/science.1137695 2007. Li, Q., Jacob, D. J., Bey, I., Palmer, P. I., Duncan, B. N., Field, B.
D., Martin, R. V., Fiore, A. M., Yantosca, R. M., and Parrish, D. D.: Transatlantic transport of pollution and its effects on surface ozone in Europe and North America, J. Geophys. Res.-Atmos., 107(D13), 4166, doi:10.1029/2001JD001422, 2002.
to the northeast Pacific: Seasonal variations and transport path-ways of carbon monoxide, J. Geophys. Res., 109, D23S07, doi:10.1029/2003JD004402, 2004.
Liu, H., Jacob, D. J., Bey, I., Yantosca, R. M., Duncan, B. N., and Sachse, G. W.: Transport pathways for Asian pollution outflow over the Pacific: Interannual and seasonal variations, J. Geophys. Res., 108(D20), 8786, doi:10.1029/2002JD003102, 2003. McConnell, J. R., Edwards, R., Kok, G. L., Flanner, M. G.,
Zen-der, C. S., Saltzman, E. S., Banta, J. R., Pasteris, D. R., Carter, M. M., and Kahl, J. D. W.: 20th-century industrial black car-bon emissions altered arctic climate forcing, Science, 317, 1381, doi:10.1126/science.1144856 2007.
McMillan, W. W., Barnet, C., Strow, L., Chahine, M. T., McCourt, M. L., Warner, J. X., Novelli, P. C., Korontzi, S., Maddy, E. S., and Datta, S.: Daily global maps of carbon monoxide from NASA’s Atmospheric Infrared Sounder, Geophys. Res. Lett., 32, L11801, doi:10.1029/2004GL021821, 2005.
McMillan, W. W., Warner, J. X., Comer, M. M., Maddy, E., Chu, A., Sparling, L., Eloranta, E., Hoff, R., Sachse, G., Barnet, C., Razenkov, I., and Wolf, W.: AIRS views transport from 12 to 22 July 2004 Alaskan/Canadian fires: Correlation of AIRS CO and MODIS AOD with forward trajectories and compar-ison of AIRS CO retrievals with DC-8 in situ measurements during INTEX-A/ICARTT, J. Geophys. Res., 113, D20301, doi:10.1029/2007jd009711, 2008.
McMillan, W. W., Evans, K., Barnet, C., Maddy, E., Sachse, G., and Diskin, G.: AIRS version 5 CO retrieval: algorithm description and validation, submitted to IEEE T. Geosci. Remote, 2009. McMillan, W. W., Pierce, R. B., Sparling, L. C., Osterman, G.,
McCann, K., Fischer, M. L., Rappengl¨uck, B., Newsom, R., Turner, D., Kittaka, C., Evans, K., Biraud, S., Lefer, B., An-drews, A., and Oltmans, S.: An observational and modeling strategy to investigate the impact of remote sources on local air quality: A Houston, Texas case study from the Second Texas Air Quality Study (TexAQS II), J. Geophys. Res., 115, D01301, doi:10.1029/2009JD011973, 2010.
Niebauer, H. J.: Effects of El Nino–Southern Oscillation and North Pacific weather patterns on interannual variability in the subarctic Bering Sea, J. Geophys. Res.-Oceans, 93, 5051–5068, 1988. Olivier, J. G. J., Bloos, J. P. J., Berdowski, J. J. M., Visschedijk, A.
J. H., and Bouwman, A. F.: A 1990 global emission inventory of anthropogenic sources of carbon monoxide on 1◦×1◦ devel-oped in the framework of EDGAR/GEIA, Chemosphere-Global Change Science, 1, 1–17, 1999.
Olivier, J. G. J., and Berdowski, J. J. M.: Global emission sources and sinks, in: The Climate System, edited by: Berdowski, J. J. M., Guicherit, R., and Heij, B. J., A. A. Balkema Publish-ers/Swets & Zeitlinger Publishers, Lisse, The Netherlands, 33– 77, 2001.
Olsen, E. T., Fishbein, E., Lee, S.-Y., Manning, E., and McMil-lan, W. W.: AIRS/AMSU/HSB Version 5 Level 2 Product – Lev-els, Layers and Trapezoids, Jet Propulsion Laboratory, Pasadena, CA, USA, 2007.
Park, R. J., Jacob, D. J., Field, B. D., Yantosca, R. M., and Chin, M.: Natural and transboundary pollution influ-ences on sulfate-nitrate-ammonium aerosols in the United States: Implications for policy, J. Geophys. Res., 109, D15204, doi:10.1029/2003JD004473, 2004.
Quinn, P. K., Shaw, G., Andrews, E., Dutton, E. G.,
Ruoho-Airola, T., and Gong, S. L.: Arctic haze: current trends and knowledge gaps, Tellus B, 59, 99–114, doi:10.1111/j.1600-0889.2006.00238.x, 2007.
Quinn, P. K., Bates, T. S., Baum, E., Doubleday, N., Fiore, A. M., Flanner, M., Fridlind, A., Garrett, T. J., Koch, D., and Menon, S.: Short-lived pollutants in the Arctic: their climate impact and pos-sible mitigation strategies, Atmos. Chem. Phys., 8, 1723–1735, 2008, http://www.atmos-chem-phys.net/8/1723/2008/.
Raatz, W. E. and Shaw, G. E.: Long-Range Tropospheric Transport of Pollution Aerosols into the Alaskan Arctic, J. Appl. Meteorol., 23, 1052–1064, 1984.
Rahn, K. A.: Relative importances of North America and Eurasia as sources of arctic aerosol, Atmos. Environ., 15, 1447–1455, 1981. Rastigejev, Y., Park, R., Brenner, M. P., and Jacob, D. J.: Resolving intercontinental pollution plumes in global mod-els of atmospheric transport, J. Geophys. Res., 115, D02302, doi:10.1029/2009JD012568, 2010
Reid, J. S., Hyer, E. J., Prins, E. M., Westphal, D. L., Zhang, J., Wang, J., Christopher, S. A., Curtis, C. A., Schmidt, C. C., Eleu-terio, D. P., Richardson, K. A., and Hoffman, J. P.: Global mon-itoring and forecasting of biomass-burning smoke: Description and lessons from the Fire Locating and Modeling of Burning Emissions (FLAMBE) program, IEEE J. Sel. Top. Appl., 2(3), 144–162, doi:10.1109/JSTARS.2009.2027443, 2009.
Rodionov, S. N., Overland, J. E., and Bond, N. A.: The Aleutian Low and Winter Climatic Conditions in the Bering Sea. Part I: Classification, J. Climate, 18, 160–177, 2005.
Sachse, G. W., Hill, G. F., Wade, L. O., and Perry, M. G.: Fast-response, high-precision carbon monoxide sensor using a tunable diode laser absorption technique, J. Geophys. Res., 92, 2071– 2081, 1987.
Shaw, G. E.: The Arctic haze phenomenon, B. Am. Meteorol. Soc., 76, 2403–2413, 1995.
Shindell, D. T., Faluvegi, G., Lacis, A., Hansen, J., Ruedy, R., and Aguilar, E.: Role of tropospheric ozone increases in 20th-century climate change, J. Geophys. Res., 111, D08302, doi:10.1029/2005JD006348, 2006a.
Shindell, D. T., Faluvegi, G., Stevenson, D. S., Krol, M. C., Emmons, L. K., Lamarque, J. F., P´etron, G., Dentener, F. J., Ellingsen, K., Schultz, M. G., Wild, O., Amann, M., Atherton, C. S., Bergmann, D. J., Bey, I., Butler, T., Cofala, J., Collins, W. J., Derwent, R. G., Doherty, R. M., Drevet, J., Eskes, H. J., Fiore, A. M., Gauss, M., Hauglustaine, D. A., Horowitz, L. W., Isaksen, I. S. A., Lawrence, M. G., Montanaro, V., M¨uller, J.-F., Pitari, G., Prather, M. J., Pyle, J. A., Rast, S., Rodriguez, J. M., Sanderson, M. G., Savage, N. H., Strahan, S. E., Sudo, K., Szopa, S., Unger, N., van Noije, T. P. C., and Zeng, G.: Multimodel sim-ulations of carbon monoxide: Comparison with observations and projected near-future changes, J. Geophys. Res., 111, D19306, doi:10.1029/2006JD007100, 2006b.
http://www.atmos-chem-phys.net/8/5353/2008/.
Shindell, D. T. and Faluvegi, G.: Climate response to regional ra-diative forcing during the twentieth century, Nature Geosci, 2, 294–300, 2009.
Staudt, A. C., Jacob, D. J., Logan, J. A., Bachiochi, D., Kr-ishnamurti, T. N., and Sachse, G. W.: Continental sources, transoceanic transport, and interhemispheric exchange of carbon monoxide over the Pacific, J. Geophys. Res., 106(D23), 32571– 32590, 2001.
Stohl, A.: Characteristics of atmospheric transport into the Arctic troposphere, J. Geophys. Res., 111, D11306, doi:10.1029/2005JD006888, 2006.
Stohl, A., Berg, T., Burkhart, J. F., Fjæraa, A. M., Forster, C., Her-ber, A., Hov, Ø., Lunder, C., McMillan, W. W., and Oltmans, S.: Arctic smoke–record high air pollution levels in the European Arctic due to agricultural fires in Eastern Europe, Atmos. Chem. Phys., 7, 511–534, 2007,
http://www.atmos-chem-phys.net/7/511/2007/.
Streets, D. G., Zhang, Q., Wang, L., He, K., Hao, J., Wu, Y., Tang, Y., and Carmichael, G. R.: Revisiting China’s CO emis-sions after the Transport and Chemical Evolution over the Pa-cific (TRACE-P) mission: Synthesis of inventories, atmospheric modeling, and observations, J. Geophys. Res., 111, D14306, doi:10.1029/2006JD007118, 2006.
Susskind, J., Barnet, C. D., Blaisdell, J. M., Center, G. S. F., and Greenbelt, M. D.: Retrieval of atmospheric and sur-face parameters from AIRS/AMSU/HSB data in the pres-ence of clouds, IEEE T. Geosci. Remote, 41, 390–409, doi:10.1109/TGRS.2002.808236, 2003.
Szopa, S., Hauglustaine, D. A., and Ciais, P.: Relative contributions of biomass burning emissions and atmospheric transport to car-bon monoxide interannual variability, Geophys. Res. Lett., 34, L18810, doi:10.1029/2007gl030231, 2007.
Tanimoto, H., Sawa, Y., Yonemura, S., Yumimoto, K., Matsueda, H., Uno, I., Hayasaka, T., Mukai, H., Tohjima, Y., and Tsuboi, K.: Diagnosing recent CO emissions and ozone evolution in East Asia using coordinated surface observations, adjoint inverse modeling, and MOPITT satellite data, Atmos. Chem. Phys., 8, 3867–3880, 2008,
http://www.atmos-chem-phys.net/8/3867/2008/.
Turquety, S., Clerbaux, C., Law, K., Coheur, P. F., Cozic, A., Szopa, S., Hauglustaine, D. A., Hadji-Lazaro, J., Gloudemans, A. M. S., Schrijver, H., Boone, C. D., Bernath, P. F., and Edwards, D. P.: CO emission and export from Asia: an analysis com-bining complementary satellite measurements (MOPITT, SCIA-MACHY and ACE-FTS) with global modeling, Atmos. Chem. Phys., 8, 5187–5204, 2008,
http://www.atmos-chem-phys.net/8/5187/2008/.
Val Martin, M., Logan, J. A., Kahn, R., Leung, F.-Y., Nelson, D., and Diner, D.: Smoke injection heights from fires in North Amer-ica: Analysis of 5 years of satellite observations, Atmos. Chem. Phys. Discuss., 9, 20515–20566, 2009,
http://www.atmos-chem-phys-discuss.net/9/20515/2009/.
Vestreng, V. and Klein, H.: Emission data reported to UN-ECE/EMEP: quality assurance and trend analysis & presentation of WebDab, Norwegian Meteorological Institute, Oslo, Norway, MSC-W Status Report EMEP/MSC-W Note 1/02, 2002. Warneke, C., Bahreini, R., Brioude, J., Brock, C. A., de Gouw, J.
A., Fahey, D. W., Froyd, K. D., Holloway, J. S., Middlebrook, A., Miller, L., Montzka, S., Murphy, D. M., Peischl, J., Ryerson, T. B., Schwarz, J. P., Spackman, J. R., and Veres, P.: Biomass burning in Siberia and Kazakhstan as the main source for Arctic Haze over the Alaskan Arctic in April 2008, Geophys. Res. Lett., 36, L02813, doi:10.1029/2008GL036194, 2008.
Warner, J., Comer, M. M., Barnet, C. D., McMillan, W. W., Wolf, W., Maddy, E., and Sachse, G.: A comparison of satel-lite tropospheric carbon monoxide measurements from AIRS and MOPITT during INTEX-A, J. Geophys. Res., 112, D12S17, doi:10.1029/2006JD007925, 2007.
Yashiro, H., Sugawara, S., Sudo, K., Aoki, S., and Nakazawa, T.: Temporal and spatial variations of carbon monoxide over the western part of the Pacific Ocean, J. Geophys. Res., 114, D08305, doi:10.1029/2008jd010876, 2009.
Yurganov, L., McMillan, W. W., Grechko, E., and Dzhola, A.: Anal-ysis of global and regional CO burdens measured from space between 2000 and 2009 and validated by ground-based solar tracking spectrometers, Atmos. Chem. Phys. Discuss., 9, 28475– 24911, 2009,
http://www.atmos-chem-phys-discuss.net/9/28475/2009/. Zhang, L., Jacob, D. J., Boersma, K. F., Jaffe, D. A., Olson, J. R.,
Bowman, K. W., Worden, J. R., Thompson, A. M., Avery, M. A., and Cohen, R. C.: Transpacific transport of ozone pollution and the effect of recent Asian emission increases on air quality in North America: an integrated analysis using satellite, aircraft, ozonesonde, and surface observations, Atmos. Chem. Phys, 8, 6117–6136, 2008.
Zhang, Q., Streets, D. G., He, K., Wang, Y., Richter, A., Burrows, J. P., Uno, I., Jang, C. J., Chen, D., and Yao, Z.: NOxemission
trends for China, 1995–2004: The view from the ground and the view from space, J. Geophys. Res.-Atmos., 112, D22306, doi:10.1029/2007JD008684, 2007.
Zhang, Q., Streets, D. G., Carmichael, G. R., He, K. B., Huo, H., Kannari, A., Klimont, Z., Park, I. S., Reddy, S., Fu, J. S., Chen, D., Duan, L., Lei, Y., Wang, L. T., and Yao, Z. L.: Asian emis-sions in 2006 for the NASA INTEX-B mission, Atmos. Chem. Phys., 9, 5131–5153, 2009,