Phosphatase Activity on Microclusters in Early T Cell
Signaling
J. Joris Witsenburg1, Heike Glauner1, Jo¨rg P. Mu¨ller2, Johannes M. M. Groenewoud3, Gu¨nter Roth4,5, Frank-Dietmar Bo¨hmer2, Merel J. W. Adjobo-Hermans1, Roland Brock1*
1Department of Biochemistry, Nijmegen Centre for Molecular Life Sciences, Radboud University Nijmegen Medical Centre, Nijmegen, The Netherlands,2Institute for Molecular Cell Biology, Jena University Hospital, Jena, Germany,3Department of Medical Technology Assessment, Radboud University Nijmegen Medical Centre, Nijmegen, The Netherlands,4Laboratory for MEMS Applications, Department of Microsystems Engineering (IMTEK), Albert Ludwigs University, Freiburg, Germany,5BIOSS Centre for Biological Signalling Studies, Albert Ludwigs University, Freiburg, Germany
Abstract
T cell signaling is triggered through stimulation of the T cell receptor and costimulatory receptors. Receptor activation leads to the formation of membrane-proximal protein microclusters. These clusters undergo tyrosine phosphorylation and organize multiprotein complexes thereby acting as molecular signaling platforms. Little is known about how the quantity and phosphorylation levels of microclusters are affected by costimulatory signals and the activity of specific signaling proteins. We combined micrometer-sized, microcontact printed, striped patterns of different stimuli and simultaneous analysis of different cell strains with image processing protocols to address this problem. First, we validated the stimulation protocol by showing that high expression levels CD28 result in increased cell spreading. Subsequently, we addressed the role of costimulation and a specific phosphotyrosine phosphatase in cluster formation by including a SHP2 knock-down strain in our system. Distinguishing cell strains using carboxyfluorescein succinimidyl ester enabled a comparison within single samples. SHP2 exerted its effect by lowering phosphorylation levels of individual clusters while CD28 costimulation mainly increased the number of signaling clusters and cell spreading. These effects were observed for general tyrosine phosphorylation of clusters and for phosphorylated PLCc1. Our analysis enables a clear distinction between factors determining the number of microclusters and those that act on these signaling platforms.
Citation:Witsenburg JJ, Glauner H, Mu¨ller JP, Groenewoud JMM, Roth G, et al. (2013) A Quantitative Assessment of Costimulation and Phosphatase Activity on Microclusters in Early T Cell Signaling. PLoS ONE 8(10): e79277. doi:10.1371/journal.pone.0079277
Editor:Geetha P. Bansal, Tulane University, United States of America
ReceivedAugust 29, 2011;AcceptedSeptember 27, 2013;PublishedOctober 30, 2013
Copyright:ß2013 Witsenburg et al. This is an open-access article distributed under the terms of the Creative Commons Attribution License, which permits unrestricted use, distribution, and reproduction in any medium, provided the original author and source are credited.
Funding:This work has been supported by the Volkswagen Foundation (http://www.volkswagenstiftung.de/‘‘ Nachwuchsgruppen an Universita¨ten’’, I/7 7 472). The funders had no role in study design, data collection and analysis, decision to publish, or preparation of the manuscript.
Competing Interests:The authors have declared that no competing interests exist.
* E-mail: [email protected]
Introduction
The formation of membrane-proximal protein clusters upon engagement of the T cell receptor (TCR) is a hallmark of early T cell signaling [1,2,3]. Cluster formation is the result of protein interactions, driven by phosphorylation of immunoreceptor tyrosine-based activation motifs (ITAMs) in the TCR complex itself and of tyrosines in scaffolding proteins such as the linker for activation of T cells (LAT) [4,5,6,7] and reorganization of the cytoskeleton [8] but the exact mechanisms remain to be further elucidated [9]. These protein clusters represent the molecular platforms of early T cell signaling and ultimately coalesce to form an immunological synapse (IS) [2,10,11,12,13,14,15,16,17].
Besides the TCR, costimulatory receptors are of vital impor-tance for T lymphocyte functioning. Cluster of differentiation 28 (CD28) provides the most prominent costimulatory signal and regulates cytokine production, inhibits apoptosis and is required for full T cell activation [18,19,20]. CD28 signaling occurs primarily via Phosphatidylinositol 3-kinase (PI3K)-dependent pathways [21,22,23,24,25,26,27]. One of the downstream effectors
is phospholipase C-c1 (PLCc1) for which CD28 costimulation leads to increased activation and tyrosine phosphorylation [28,29]. Numerous studies have addressed the role of CD28 in T cell signaling and activation. Manz et al. [30] have even shown that CD28 costimulation decreases the number of engaged peptide-major histocompatibility complexes (pMHCs) per TCR cluster required for T cell activation. Additionally, CD28 has recently been observed to form microclusters that colocalize with TCR clusters upon stimulation with CD80. CD28 subsequently recruits protein kinase Ch (PKCh) clusters and both CD28 and PKCh
clusters migrate to subregions of the central supramolecular activation cluster (cSMAC) that are distinct from TCR subregions [31]. Importantly, however, the quantitative impact of CD28 costimulation on cluster phosphorylation has not been addressed so far.
analyzing the delivery of cytolytic granules and the formation of SRC family kinase microclusters upon TCR engagement on cytotoxic T lymphocytes [32] and signaling induced by viral envelope proteins [33]. The latter study also highlights the advantages that planar-supported substrates offer for quantitative analyses of signaling.
Conversely, microstructured surfaces have been employed to elucidate the molecular mechanisms that underlie the formation of the specific geometric arrangement of the IS [34] as well as the role of specific patterns in the arrangement of stimuli and costimuli in generating a T cell response [35]. The latter study employed microcontact printing for the generation of various patterns of TCR and CD28 stimuli.
Microcontact printing is a robust method for the generation of microstructures of functional proteins in various geometries in micrometer dimensions [36,37]. Through printing of stripe patterns, functional analysis of different stimuli has been conduct-ed side-by-side for single cells [38].This side-by-side arrangement of stimuli is of particular interest for quantitatively addressing the impact of costimulation on protein cluster formation and tyrosine phosphorylation. Here we describe an accessible procedure that combines microcontact printing, confocal microscopy, high-content image analysis and statistics to study, in parallel, the effect of different stimuli on tyrosine phosphorylation, cluster formation and membrane spreading during early T cell signaling. Within this setup we additionally include the simultaneous analysis of two different cell types and cells with different levels of receptor expression. We demonstrate that the main effect of CD28 costimulation is an increase in the number of microclusters formed as well as the formation of a larger contact area with the stimulating surface.
Moreover, we address the impact of deficiency of SH2-containing protein tyrosine phosphatase 2 (SHP2) on cluster formation. SHP2 is a cytoplasmic protein-tyrosine phosphatase (PTP) that is ubiquitously expressed [39]. Intriguingly, unlike its close relative SHP1, which is widely accepted as a negative regulator of T cell signaling [40], SHP2 has been implicated in both, the inhibition of T cell signaling [41,42,43,44], as well as sustained activation of the mitogen-activated protein kinase (MAPK) pathway by the TCR [40,45] and many growth factor and cytokine receptors [46]. The T cell signaling proteins PLCc
and PI3K might be directly regulated by SHP2 since it has been shown that these proteins and SHP2 bind to growth factor receptor-bound protein 2 (GRB2)-associated binding protein (GAB)-family adapter proteins which are activated upon activation of T and B cell receptors as well as insulin, growth factor and cytokine stimulation [47,48,49]. When addressing the impact of SHP2 on the phosphorylation of signaling microclusters, we show that the deficiency of this PTP leads to a significant increase in overall phosphotyrosine levels and, more specifically, phosphory-lation of PLCc.
Materials and Methods
Reagents
Reagents were purchased from Carl Roth (Karlsruhe, Ger-many) unless otherwise specified. aCD3 (mouse monoclonal IgG2a, clone OKT3) and aCD28 (mouse monoclonal IgG2a, clone 9.3) antibodies were kindly provided by Prof. Dr. Gundram Jung (Department of Immunology, University of Tu¨bingen, Germany). The unspecific mouse IgG2a isotype antibody (clone UPC 10) was purchased from Sigma-Aldrich (Deisenhofen, Germany), the aphosphotyrosine antibody (mouse monoclonal IgG1, clone P-Tyr-100) from Cell Signaling Technology (Leiden,
The Netherlands) and apY783-PLCc1 (rabbit polyclonal, sc-12943-R) from Santa Cruz Biotechnology (Heidelberg, Germany). The Celltrace CFSE cell proliferation kit containing the carboxy-fluorescein diacetate succinimidyl ester (CFDA-SE), Zenon mouse IgG labeling kits and secondary Alexa Fluor-conjugated antibodies were obtained from Molecular Probes, Invitrogen (Breda, The Netherlands). TheaIL2 antibodies (cat. 555051 and cat. 555040) and streptavidin-HRP (cat. 554066) were purchased from BD Pharmingen (Erembodegem, Belgium) and the TMB substrate solution from Thermo Scientific (Etten-Leur, The Netherlands).
Cell Culture
The Jurkat T cell leukemia line (ACC-282) was acquired from the DSMZ (Braunschweig, Germany). Additionally, Jurkat E6.1 SHP2 knock-down cells (SHP2 KD) (see below) were compared to unmodified Jurkat E6.1 T cells (TIB-152, ATCC) termed ‘wild type’ (wt) in this work.
Cells were cultured in RPMI 1640 with stable glutamine and 2.0 g/l NaHCO3 supplemented with 10% heat-inactivated fetal bovine serum (FBS) at 37uC and 5% CO2 under humidified conditions (medium and serum were both from PAN biotech GmbH, Aidenbach, Germany). Cultures were passed every 2–3 days and grown to densities of on average 7N105cells/ml.
Cell Transfection 5 N 10
6
Jurkat cells (ACC-282) in 100ml serum free RPMI medium were transfected with 5mg CD28-GFP (RG211318; OriGene Technologies Rockville, MD, USA) in a 2 mm electroporation cuvette (Cell Projects Limited, Kent, UK). Transfection was performed by electroporating the cells at 0.18 kV, 960mF and 200V (Gene Pulser; Bio-Rad Laboratories,
Veenendaal, The Netherlands). The cells were then transferred to 5 ml RPMI medium with 5% FBS and incubated at 37uC for 48 h. After the first 24 h an additional 5 ml of medium with 5% FBS was added to the cells.
Jurkat E6.1 SHP2 Knock-Down Cells
Plasmid pLKO.1 vectors encoding five nonvalidated shRNA targeting sequences forptpn11(SHP2) were obtained from Sigma-Aldrich (Mission shRNA lentivirus mediated transduction system, SHGLY-NM_002834.3). Targets were validated using transduc-tion of lentiviral particles into 293T cells (ACC 635, DSMZ). With shRNA NM_002834.3-1570s1c1 (targeting sequence CGCTAA-GAGAACTTAAACTTTC) a down regulation of SHP2 level to 10% was obtained on western blot (data not shown). For production of lentiviral particles 293T cells were transiently transfected with the pLKO.1-derivative plasmid carrying shRNA NM_002834.3-1570s1c1 in combination with pRev, pEnv-VSV-G and pMDLg using polyethyleneimine (PEI; described recently by Arora et al. [50]). Jurkat E6.1 cells were infected three times with the pseudotyped particles in the presence of 8mg/ml polybrene (1,5-dimethyl-1,5-diazaundecamethylene polymetho-bromide, Sigma-Aldrich) for 8, 16, and 24 h. Selection of cells with 2mg/ml puromycin was started 48 h after transduction.
Microcontact Printing
with the chromium masks in a cleanroom facility. After resist development and a hardbake (95uC over 1 h) the microstructured master was finalized with a protective silane coating of low-pressure vapor-deposited (3,3,3-Trifluoropropyl)-trichlorosilane (ABCR, Karlsruhe, Germany).
Stamps were generated by mixing an elastomer base and a cross-linking agent (Sylgard 184 silicone elastomer kit, Dow Corning, Wiesbaden, Germany) in a 10:1 ratio (w/w). The degassed prepolymer was poured onto the silicon master and cured at 65uC overnight. The PDMS layer was demoulded and cut into individual 868 mm stamps. Stamps were coated for 1 h at RT with 100ml of in total 107mg/ml antibody solution. These
solutions comprised of 7mg/ml goataguinea pig Alexa Fluor 647 for visualization of stamped features, 75mg/ml unspecific IgG2a for titration of the stimulus and lastly a stimulus of either 25mg/ml
aCD3, 25mg/mlaCD28 or a combination of 12.5mg/mlaCD3 and 12.5mg/ml aCD28. Additionally, control stripes were stamped using antibody solutions in which the stimulus was replaced by an additional 25mg/ml unspecific IgG2a. Meanwhile, microscope slides (7562561 mm) were cleaned through rubbing with demineralized water, rinsing with 70% ethanol and acetone and finally dried in a stream of filtered nitrogen. Coated stamps were rinsed with demineralized water, dried with filtered nitrogen and brought into contact with microscope slides for a few seconds. After careful removal of the stamp from the slide an adhesive frame of 161 cm (In situ frame, Peqlab; Erlangen, Germany) was stuck around the stamped area as an incubation chamber. Parts of the surface that had not been in contact with stamp features were functionalized through a 30 min incubation with 100ml of a 20mg/ml antibody solution comprised of 15mg/ml unspecific IgG2a and a stimulus of either 5mg/mlaCD3, 5mg/mlaCD28
or a combination of 2.5mg/ml aCD3 and 2.5mg/ml aCD28. Control surfaces were coated with 20mg/ml unspecific IgG2a only. After a wash step with 150ml PBS, slides were blocked with
1% BSA in PBS for 30 minutes. Before cell seeding slides were washed with 150ml PBS once more (Reviewed in [37]).
Cell Stimulation and Immunocytochemistry
After either transfection or (mock) labeling of cells with 1mM
CFDA-SE at 1N10 6
cells/ml according to the supplier’s protocol, cells were serum starved in order to reduce background levels of phosphorylation. 1N10
5
serum starved cells in RPMI 1640 medium were seeded onto functionalized glass surfaces and stimulated for 10 min at 37uC before they were fixed with 3% (w/v) paraformaldehyde (Merck, Darmstadt, Germany) for 10 min at 4uC followed by 15 min at RT, washed three times with PBS for five min and permeabilized with saponin buffer (0.1% saponin, 0.1% BSA in PBS) for 15 min. TheaphosphoTyr antibodies were fluorophore conjugated by formation of non-covalent immuno-complexes with Zenon Alexa Fluor 546 labeling kits following the supplier’s protocol, diluted in saponin buffer and incubated with the cells for 1 h. Alternatively the cells were incubated with 2mg/
mlapY783-PLCc1 in saponin buffer for 1 h, washed with saponin buffer for 5 min three times and incubated with 4mg/ml goat
arabbit Alexa Fluor 546 in saponin buffer for 1 h. Finally, samples were washed three times (PBS, 5 min) and coverslips were mounted using Mowiol mounting medium (Merck; [51]).
Microscopy and Image Analysis
Images were acquired with a TCS SP5 confocal laser scanning microscope equipped with an HCX PL APO 6361.2 N.A. water immersion lens and using the 488 nm line of an argon-ion laser, a 561 nm HeNe and a 633 HeNe laser (Leica, Rijswijk, The Netherlands) according to the used fluorophores and lateral
sampling rates of 120 nm. All images had a size of 204862048 pixels.
The fluorescence intensity of cellular areas at the contact plane of cells and functionalized glass was analyzed in individual confocal slices acquired with a pinhole diameter of 1 Airy unit, using ImageJ [52] with self-written macros (Macro S1 & Macro S2). Binary masks of the stripe image and the image of immunolabeled cells were generated. These masks and inverted duplicates thereof were combined and used to measure the integrated intensities of the immunolabel in cells on different surfaces. The masks were further used to determine the size of the surface areas and, in combination with the integrated intensities, provided the mean intensity of cellular pixels. The values of surfaces lacking cells were used for background correction during data processing.
For the discrimination between different cell types, binary masks were generated for CD28-GFP-high or CFSE-labeled cells and, combined with the immunofluorescence masks representing all cells, for the CD28-GFP-low or unlabeled cell population. Cluster-selective masks were generated from the image of the phosphotyr-osine signal using the local maxima function of ImageJ and self-written code. The quantities of labeled and unlabeled cells were determined manually using the cell masks and transmission images.
Data Transformation and Statistical Tests
In the microcontact printing experiments, for each image, the data was normalized by dividing the value of a specific cell type on a specific surface by the average value of all combinations of cell types and surfaces. This enabled pooling of the data sets of different experiments for statistical analyses. Based on histograms of the data and one-sample Kolmogorov–Smirnov tests it was confirmed that data sets of all subgroups could be considered to be normally distributed. Additionally, Levene’s test for equality of variances justified the comparison of populations using two-sample T tests when only the effect of cell type had to be determined and two-way factorial ANOVAs when both the effect of stimulus and cell type had to be measured. To determine whether cell populations had spreading preferences for a certain stimulus, surface-preference-scores (see Results) were subjected to one-sample T tests with a test value of 1.
Generally, null hypotheses were rejected when p-values were below 0.05 but Bonferroni corrections were applied where necessary. Statistical tests were performed using SPSS 16.0 for Windows (SPSS Inc., Chicago, IL, USA) and IBM SPSS Statistics, version 20 (IBM Corp., Armonk, NY, USA).
Flow Cytometry
Unspecific IgG2a,aCD3 oraCD28 antibodies were conjugated with either Zenon Alexa 488 or Zenon Alexa 647 according to the supplier’s instructions. 1N10
5
cells were incubated with the fluorescently labeled antibodies for 1 h at room temperature and washed three times in PBS. To prevent exchange of the non-covalently bound Zenon reagent between the primary IgG2a antibodies, the cells were fixed with 3% paraformaldehyde for 10 min at room temperature and washed in PBS before analysis using a FACSCalibur flow cytometer (Becton Dickinson, Beda, The Netherlands) counting at least 2.5N10
4
events per sample.
IL2 ELISA
Wells of a Microlon 96-well flat bottom plate (Greiner Bio-One, Alphen aan den Rijn, The Netherlands) were coated overnight at 4uC with 1mg/mlaCD3, 1mg/mlaCD28 or a mixture of 1mg/
Additional wells were treated with PBS only, either for negative controls or stimulation of cells with phorbol myristate acetate (PMA) and ionomycin. The plate was blocked for 30 min with 4% BSA in PBS and washed with RPMI medium. 1N10
5
cells were seeded per well and stimulated for 22 h at 37uC, 5% CO2 and under humidified conditions. Positive control samples were incubated with 12.5 ng/ml PMA and 500 ng/ml ionomycin. IL2 expression was determined through a sandwich ELISA using the reagents mentioned above. Plates were measured on a Benchmark Plus microplate spectrophotometer (Bio-Rad Labora-tories). ELISA results were analyzed with two-way factorial ANOVAs and Bonferroni post-hoc tests.
Results
Cells with high levels of CD28 expression have increased surface contact areas but lower local tyrosine
phosphorylation when stimulated withaCD28 on microstructured surfaces
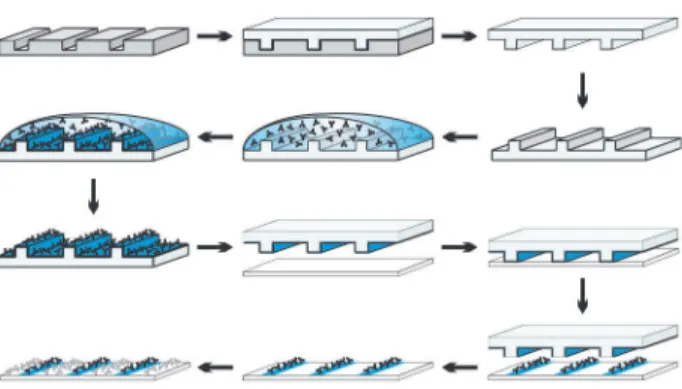
We first aimed to determine to what extent different expression levels of the CD28 coreceptor result in different levels of T cell Figure 1. Protocol for microcontact printing.A microstructured
silicon master is used as a template for the generation of PDMS stamps. The stamp is coated with antibodies, including a fluorescently labeled indifferent antibody for visualization of stamped features. Stamping transfers a monolayer of antibodies to a clean microscope slide. The areas in between stamped patterns are coated by incubation (‘overlay’) with a second antibody solution. Finally, the surface is blocked with BSA. doi:10.1371/journal.pone.0079277.g001
Figure 2. The effect of CD28 expression and segregated, stripe-shaped stimuli on tyrosine phosphorylation.The effect of receptor expression on signaling was studied using CD28-GFP transfected Jurkat ACC-282 T cells. After electroporation, cells were cultured for 48 h, serum starved for 6 h and then incubated on striped stimulatory surfaces for 10 minutes, fixed with 3% PFA and immunolabeled withaphosphotyrosine (A). The stimulatory surfaces were prepared using stamps coated with either 25mg/mlaCD3 (B & D); 25mg/mlaCD28 (C & G) or unspecific IgG2a only (E & F). The stamped areas were subsequently overlaid with 5mg/mlaCD28 (B & F); 5mg/mlaCD3 (C & E) or unspecific IgG2a only (D & G).B-G) Top left panels: transmission image; top right panels: CD28-GFP; bottom left:aphosphotyrosine; bottom right panels: overlay of the stamped pattern (blue) and theaphosphotyrosine label (grayscale). In the CD28-GFP and overlay panels the contrast and brightness are adjusted proportionally for clarity. Scale bars 20mm.
activation. On one hand these experiments served the validation of microcontact printing for quantitative analyses, on the other we intended to compare TCR receptor engagement and the CD28 costimulus in the induction and distribution of tyrosine phosphor-ylation. One stimulus was transferred onto cleaned glass surfaces by stamping, the other stimulus by incubation with a solution containing the stimulating antibody (termed ‘overlay’ in this work; Fig. 1). It has been shown previously that in this manner each part of the surface contains only one type of stimulus [38].
For quantitative immunofluorescence microscopy at the contact site of cells with a surface, variation is prone to arise between different samples due to small differences in focal planes and immunolabeling efficiency. As a consequence, with the analysis of different samples, small but relevant differences in signal intensity between cells or stimuli may be deemed insignificant. In order to overcome this hurdle we developed a protocol to facilitate a comparison of two different cell types on a side-by-side basis (Fig. 2A).
Especially in early T cell signal transduction, propagation of the signal is mainly driven through tyrosine phosphorylation [5]. We therefore chose to use phosphotyrosine levels as a marker to assess the impact of CD28 expression levels on early signal initiation. A
Jurkat T cell strain with no to low CD28 expression was transfected with CD28-GFP (Fig. S1). After cultivation for two days without selective pressure, the cells were incubated on surfaces functionalized with alternating stripes of aCD3 and
aCD28 stimulating antibodies for 10 min. Cells were incubated on surfaces of which theaCD3 stripes were stamped and theaCD28 stripes were overlaid (Fig. 2B) and vice versa (Fig. 2C) to correct for possible effects of the mode of surface preparation. After fixation, phosphotyrosine levels at the interface of the cells and surfaces were analyzed by confocal laser scanning microscopy using immunofluorescent staining. Labeling controls showed no aspecific clustering of the fluorophores (Fig. S2).The 10-min time point was selected as it provided sufficient time for cell spreading to occur, yet tyrosine microclusters could still be detected all over the cells. In order to sample large numbers of cells we scanned the maximal field of view at a lateral sampling frequency yielding diffraction limited resolution (for an example refer to Fig. S3).
When cells were stimulated with parallel stripes ofaCD3 and
aCD28 a clear accumulation of the CD28 receptor was observed on theaCD28 stripes (Fig. 2B&C). In contrast the formation of phosphorylated tyrosine clusters primarily took place on aCD3 stripes. Additionally, it appeared that Jurkat T cells expressing Figure 3. Quantification of the effect of CD28 expression on cell surface spreading and tyrosine phosphorylation.The original images of the experiment of Fig. 2 were quantified (see Macro S1) and the values were normalized to the mean value of the measured property within that
image. Normalized values of experiments with inverted stamp and overlay configurations were pooled. The graphs show the mean6SEM.A-C) Cells
stimulated with stripes containingaCD3 and stripes containingaCD28. (n= 10 images from two separate samples in which stamp and overlay stimuli were reversed (Fig. 2B & C) in total counting 1010 CD28 low and 127 CD28 high cells).D-F) Cells stimulated with stripes containingaCD3 and stripes containing unspecific IgG2a only. (n= 10 images from two separate samples in which stamp and overlay stimuli were reversed (Fig. 2D & E) in total counting 921 CD28 low and 97 CD28 high cells).G-I) Cells stimulated with stripes containing unspecific IgG2a only and stripes containingaCD28. (n= 10 images from two separate samples in which stamp and overlay stimuli were reversed (Fig. 2F & G) in total counting 1006 CD28 low and 165 CD28 high cells).A, D & G) The background-corrected,aphosphotyrosine intensity per surface area. Corrected model p-values were determined by two-way factorial ANOVAs in which no interaction terms were included.B, E & H) The contact surface area per cell. Two-sample T-tests were used to generate the p-values. C,F & I) The integrated, background-corrected,aphosphotyrosine intensity per cell (Two-sample T-tests).
high levels of CD28, as judged by GFP intensity (CD28-high cells), covered larger surface areas than low cells did. The CD28-high cells, however, appeared to have a lower degree of tyrosine phosphorylation than CD28-low cells, both on aCD3 and on
aCD28 stripes. In order to verify these observations we quantified the fluorescent intensities (Macro S1). To avoid artifacts as a result of the manner in which the stripes were prepared, the normalized results of both orientations of the experiment (Fig. 2B&C) were pooled. Data within images was normalized to the mean value within that image in order to eliminate variations between samples and experiments. The protocol yielded unpaired parametric statistical tests and provided information about relative quantita-tive differences between stimuli and cell types (Fig. 3). Datasets for each condition had comparable variances and followed normal distributions.
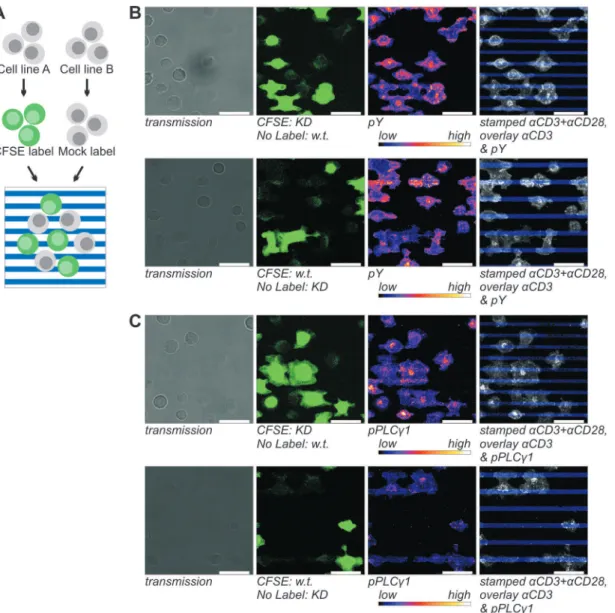
Quantification showed that cells indeed had a higher degree of tyrosine phosphorylation onaCD3 stripes than onaCD28 stripes (Fig. 3A). This effect was independent of CD28 expression levels, meaning that there was no significant difference in the increase between CD28-high and CD28-low cells. Furthermore, it confirmed that, on both aCD3 and aCD28, CD28-high cells had significantly lower phosphotyrosine levels per surface area than CD28-low cells. Expression of CD3 had not been reduced as a consequence of CD28-GFP expression (Fig. S1) and could therefore not have been the cause of this reduced phosphorylation. However, when the local phosphotyrosine densities were corrected for the increased cell spreading (Fig. 3B), CD28-high cells seemed to have a slightly higher total tyrosine phosphorylation level, but after a Bonferroni correction this difference could not be shown to be significant (Fig. 3C). Without CD28 costimulation (Fig. 2D& Figure 4. Detection of the stimulus dependence of total tyrosine phosphorylation (B) and phosphoY783 PLCc1 (C) in Jurkat cells and SHP2 KD cells.A) For the side-by-side analysis of signaling in Wt and SHP2 KD Jurkat E6.1 T cells, one of the lines was labeled with the cell tracer CFSE. After overnight serum starvation the cells are pooled and incubated on micropatterned, stimulating surfaces for 10 min. Subsequently, the cells are fixed with 3% PFA, permeabilized and immunolabeled for the detection of signaling clusters.B & C) In the top panels, SHP2 KD cells are CFSE labeled and in the bottom panels, wt cells are labeled. Panels from left to right: transmission images; CFSE; immunofluorescence; overlay of the stamped pattern (blue) and the immunolabel (grayscale). In the overlay panels the contrast and brightness for both channels were adjusted proportionally for clarity. 12.5mg/mlaCD3+12.5mg/mlaCD28 coated stamps were used to generate a striped pattern which was overlaid with 5mg/ mlaCD3. CFSE channels were recorded with saturated signals to facilitate image processing. Scale bars 20mm.
E), no significant differences were found between CD3 stimulated CD28-low and CD28-high cells in the degree of tyrosine phosphorylation per surface area (Fig. 3D), interaction surface area per cell (Fig. 3E) or total tyrosine phosphorylation per cell (Fig. 3F). As expected, significantly higher levels of phosphotyr-osine were observed onaCD3 stripes in these samples. It should be noted that this difference was noted primarily on samples where
aCD3 was applied as an overlay. WhenaCD3 was stamped, in many cells phosphotyrosine levels were observed to be higher on the overlay. However, as explained above, we corrected for this effect by pooling data from samples with inversed stamp-overlay orientations.
Finally, whenaCD28 stripes were compared with IgG control stripes (Fig. 2F &G) no significant differences were found in the phosphotyrosine signal per surface area between stripes or cells (Fig. 3G). The presence ofaCD28 stripes did however stimulate the CD28 cells to form larger interaction surfaces with the stripes (Fig. 3H). This indicates that Jurkat T cells can respond to CD28 stimulation alone when high levels of CD28 are expressed, albeit in a limited fashion. The increased surface area of CD28-high cells was accompanied by a proportionate increase in total phospho-tyrosine signal per cell (Fig. 3I). As we expect this fluorescence to be of membrane proximal, background phosphorylation levels independent of TCR and CD28 signaling, the proportionate increase in total phosphotyrosine signal per cell with increased cell spreading is unsurprising. Even though sample-to-sample variation imposes limits to comparisons between samples, cells clearly responded in a strongly reduced fashion to unspecific IgG2a coated surfaces as compared toaCD3/aCD28 patterned surfaces (Fig. S4). For none of the combinations of stimuli a significant interaction factor between CD28 expression and stimulating surface was found when two-way factorial ANOVAs including interaction terms were applied. Therefore there were no detectable differences in the response to the different stimuli between CD28-low and CD28-high cells. In other words, even though the CD28-low cells had higher local phosphotyrosine signals, the increase of tyrosine phosphorylation on aCD3 was comparable between the two cell types.
Treatment with cytochalasin D, an inhibitor of actin polymer-ization, drastically reduces cell adherence and spreading (Fig. S5) indicating that Jurkat T cells do not passively adhere to or spread on the striped surfaces and that the observed affects are an effect of CD28 costimulation.
SHP2 depletion increases cluster phosphorylation but not cluster numbers and decreases IL2 production
The analysis of phosphotyrosine levels, as described above, shows the potential of the striped pattern to perform a side-by-side analysis of two different stimuli. Importantly, we observed distinct differences in tyrosine phosphorylation and surface distribution between Jurkat T cells expressing different levels of CD28. Next, we intended to specifically address the role of the PTP SHP2 in cluster formation and phosphorylation and the CD28 dependence of the observed effects.
SHP2 is one of several PTPs involved in T cell signaling and its effects might therefore be relatively small. Moreover, the protein has been implicated to be involved in both activation and inhibition of cell signaling. By comparing a SHP2 knock-down clone of Jurkat E6.1 (SHP2 KD) with the ‘wild type’ Jurkat E6.1 line (wt) on striped surfaces we wanted to gain insight into whether this phosphatase noticeably affects overall tyrosine phosphoryla-tion. In addition the effect on the tyrosine residue 783 of PLCc1 in particular was tested as a candidate target of SHP2. In contrast to the combination of stimuli used above, in these experiments we intended to more closely capture the physiological setting of CD28 costimulation in early signaling, which is in colocalization with CD3 engagement. Therefore aCD3+aCD28 mixtures were compared toaCD3 alone.
In Jurkat E6.1 SHP2 KD cells the phosphatase was down-regulated by expression of lentivirally transduced shRNA. In comparison to wt cells, SHP2 expression was reduced to 13% in these cells (Fig. S6A), but this had no effect on receptor expression (Fig. S6B&C). SHP2 KD and wt Jurkat cells were incubated on stripes functionalized with a 1:1 ratio of aCD3 and aCD28 alternating with stripes of onlyaCD3 for 10 min and stained for phosphotyrosine or phosphoY783 PLCc1. By labeling one of two cell types with the cell tracer CFSE prior to incubation on micropatterned surfaces (Fig. 4A) the two types could easily be distinguished during microscopy (Fig. S3). We confirmed that all CFDA-SE treated cells were fluorescently labeled (Fig. S7).
Again confocal images were acquired with the focus on the plane of the contact area. Both cell lines responded in a comparable heterogeneous fashion to the stripes (Fig. S3). For both Jurkat strains approximately 80% of the cells had formed microclusters of pY or pPLCc1 and most cells had higher cluster numbers and increased phosphotyrosine (Fig. 4B) and pY783 PLCc1 signals (Fig. 4C) on the stripes containing both stimuli. However, some cells also formed large numbers of clusters on the
aCD3 coated surface. Interestingly, the cluster brightness varied strongly between cells within images. Additionally, cells spread more on stripes containing both stimuli than on stripes consisting Figure 5. Image processing of phosphoPLCc1 signals and cluster formation.Overview of the image processing protocol as described in Materials and Methods and used for the analysis of the experiments described in Fig. 4. In order to resolve clusters in print, an enlarged segment of a
microscopy image labeled withaphospho-PLCc1 (Fig. S3) is shown as an example. Image processing and quantification was done on a per image
basis. Macro S2 describes the full procedure utilized to analyze the images. In short, the pPLCc1 signal was thresholded to generate a binary mask of all cells. This image was inverted to generate a mask of the background signal. The CFSE image was thresholded and was used in combination with the mask of all cells to generate a mask of CFSE labeled cells and a mask of unlabeled cells. The image of the printed stripes was thresholded to generate a mask of the printed structures and inversed to also generate a mask of the overlaid areas. Combining the masks of the printed structures and overlaid areas with the masks of the cells formed the masks of the CFSE labeled cells on stamped stripes, the CFSE labeled cells on overlaid structures, the unlabeled cells on stamped stripes and the unlabeled cells on overlaid structures. These four masks were used to measure the surface areas the cells covered on both surfaces. Combining the stripe and overlay masks with the background mask enabled the measurement of surface areas not covered by cells. The last six generated masks were, in turn, applied to the original pPLCc1 image and from the resulting images the total pPLCc1 signal per condition could be determined. Together with the total surface areas of the specific condition, the signal intensity permm2was calculated. Surface specific background corrections were applied. In addition, a binary cluster mask was generated from the pPLCc1 image. This mask was segmented using the four masks of cells on surfaces creating four new masks. From these masks cluster numbers were counted and by applying them to the original pPLCc1 image cluster intensities could be determined. Finally, the cell numbers per image were determined by eye using the original transmission images and the cell masks. The various colors correspond to the graphs in Fig. 6 and indicate which masks and images are required to produce the particular data.
of only aCD3 (Fig. 4B & C). This contact difference was less pronounced whenaCD3 was stamped and aCD3+aCD28 was overlaid (Fig. S3, S4 & S7), indicating that, as above, stamping resulted in a different activity of the stimuli than functionalization by incubation with soluble antibodies. Therefore, experiments were also performed in which the stamped and overlaid stimuli were switched (results not shown but included in the quantitative analyses below). Comparable results were obtained independent of which cell strain was CFSE labeled (compare top and bottom panels of Fig. 4B&C).
Due to the heterogeneity of the cell response, quantitative analyses were necessary to extract subtle differences between SHP2 KD cells and the wt Jurkat cells. For this purpose we extended our image processing protocol for extensive quantifica-tion of clusters and cell surface distribuquantifica-tion (Macro S2 & Fig. 5).
As before, the normalized values of multiple images of several experiments, in which the orientation of stamped and overlaid surface and CFSE labeled and unlabeled cells varied, were pooled. For each condition, datasets followed normal distributions and groups showed comparable variances.
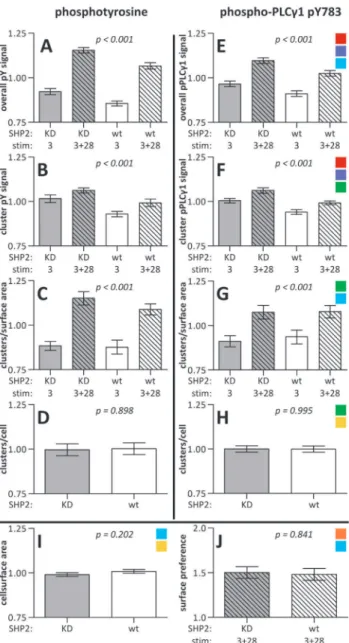
Quantification of the images revealed small but significant differences in early signaling events between SHP2 KD and wt Jurkat T cells. SHP2 KD cells had a 7.7% higher phosphotyrosine signal than wt cells (95% confidence interval (CI) 4.5%–10.9%; Fig. 6A& Fig. 7). In parallel the intensity of the phosphorylated tyrosine microclusters was 7.9% higher in these cells (CI 4.3%– 11.5%; Fig. 6B& Fig. 7). Similarly, the specific phosphorylation of tyrosine residue 783 in PLCc1 was 6.3% higher (CI 3.2%–9.4%; Fig. 6E & Fig. 7) as was the cluster-specific intensity (6.7%, CI 4.1%–9.3%; Fig. 6F& Fig. 7) in cells not expressing SHP2. There were no significant differences between the cell strains in the number of microclusters (Fig. 6C, D, G, H& Fig. 7), cell size (Fig. 6I) or surface preference (Fig. 6J; see below). See Table 1 for absolute values.
In addition to the effects of SHP2 deficiency, there were also clear differences between aCD3 stimulation alone and a C-D3+aCD28 costimulation. Cells formed 23.9% more phosphotyr-osine microclusters permm2 on stripes of mixed stimuli than on
stripes of onlyaCD3 (CI 17.2%–30.7%; Fig. 6C& Fig. 7). Also, the density of phosphorylated PLC1c1 microclusters was higher on aCD3+aCD28 than on aCD3 surfaces (15.3%, CI 8.3%– 22.4%; Fig. 6G& Fig. 7). The variance of the absolute number of signaling clusters per surface between images was much larger than the one of the normalized figures and therefore did not give significant information (Table 1).
This higher cluster density onaCD3+aCD28 coated surfaces is reflected in the overall signal intensities of the cells on the different surfaces. For phosphotyrosine this signal was 22.1% higher on
aCD3+aCD28 stripes than onaCD3 stripes (CI 18.9%–25.3%; Fig. 6A& Fig. 7). The 5.5% intensity increase of the clusters on mixed surfaces contributes relatively little to the large overall increase (CI 1.9%–9.1%; Fig. 6B& Fig. 7). For phosphoPLCc1 the overall signal was 12.2% higher (CI 9.1%–15.3%; Fig. 6E& Fig. 7) and the microclusters were 5.4% more intense (CI 2.8%– 8.0%; Fig. 6F& Fig. 7).
After having determined a direct effect of CD28 expression on cell spreading we aimed to assess in more detail the effect of CD28 costimulation on membrane distribution and spreading. In order Figure 6. Quantification of the effects of CD28 costimulation
and SHP2 deficiency.The values acquired through image segmen-tation as described in Fig. 5 were normalized to the mean value of the specific property for that image. The information of multiple images from multiple experiments was used for further analyses. The graphs depict the stimulus and SHP2 dependence of spreading and tyrosine
phosphorylation showing the mean 6 SEM (based on number of
images) of the respective property. KD = SHP2 knock-down E6.1 Jurkat cells; wt = wild type E6.1 Jurkat cells; 3 = stripes ofaCD3 alone; 3+28
= aCD3+aCD28-containing stripes (Fig. 4). The colored squares
correspond to the colors bordering images and masks in Fig. 5 used to retrieve the data required for the graph in question. Corrected model p-values were determined by two-way factorial ANOVAs in which no interaction terms were included (A-C & E-G) or two-sample T-tests (D& H-J). A-D) Cells labeled with the aphosphotyrosine antibody (n= 15 images resulting from three separate experiments with varying CFSE/ unlabeled and stamp/overlay conditions in total containing 861 KD and 615 wt cells).E-H) Cells labeled with theaphosphoY783-PLCc1 antibody
(n= 26 images resulting from five separate experiments with varying
CFSE/unlabeled and stamp/overlay conditions in total containing 1804 KD and 1502 wt cells).A & E) Average, background-corrected, overall
intensity per surface area. B & F) Average, background-corrected
intensity of cluster pixels.C & G) Average number of clusters per surface area.D & H) Average number of clusters per cell.I & J) The average contact surface area per cell (I) and surface-preference-score (J, see text)
were determined from pooled data from the phosphoTyr and
phosphoY783 PLCc1 experiments (n= 41 images from 8 experiments
with varying CFSE/unlabeled and stamp/overlay conditions in total containing 2665 KD and 2117 wt cells).
to quantify the preference of cells for contacting one of the two surfaces we devised a surface-preference-score (Fig. 6J, eq. 1). The score for theaCD3+aCD28 surface is defined as the ratio of cell surface on aCD3+aCD28 over cell surface on aCD3 stripes corrected by the ratio of the totalaCD3+aCD28 surface over the totalaCD3 surface.
aCD3zaCD28Surface
-Preference-Score~
Cell Surface OnaCD3zaCD28 Cell Surface OnaCD3
TotalaCD3zaCD28 Surface TotalaCD3 Surface
(1)
A surface-preference-score of 1 indicates no preference, a score
.1 indicates a preference for the cells to establish contact with
aCD3+aCD28 and a score , 1 indicates that the cells prefer
aCD3 surfaces. Both cell strains had a clear preference for the
aCD3+aCD28 surface as determined by one-sample T tests (p,0.001 for both; test value = 1). Together with the observed stretched shapes of the cells (Fig. S3 & Fig. 4) this clearly demonstrates that CD28 engagement also increases cell spreading in a costimulatory setting. No difference in surface preference was found between SHP2 KD and wt cells (Fig. 6J).
As before, no significant interaction factors between cell type and stimulating surface were found, indicating that there is no detectable difference in the effect of CD28 costimulation between wt and SHP2 KD cells.
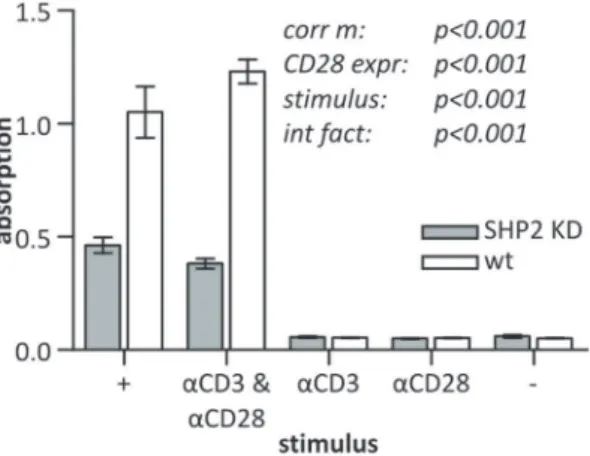
After having found that the inhibition of SHP2 expression stimulates the early T cell signaling response by increasing pY and pPLCc1, we probed for the induction of IL2 expression to address whether late T cell responses were also affected. SHP2 KD cells had a significantly reduced production of IL2 when stimulated withaCD3 andaCD28 compared to wt cells (Fig. 8). This effect was not restricted to extracellular stimulation but was also observed when PMA and ionomycin were used. This difference is remarkably different from the positive impact of SHP2 deficiency on early tyrosine phosphorylation. A Bonferroni post-hoc test showed that there were no significant differences between cells stimulated with PMA+ionomycin and cells stimulated with
aCD3 + aCD28. One may argue that the difference in IL2 production observed is due to stimulation-dependent apoptosis. However, levels of apoptosis were not found to be different for wt versus SHP2 KD cells, indicating that the observed difference could be attributed to an actual reduced IL2 production per cell (Fig. S8).
Discussion
Protein cluster formation is a hallmark of early T cell signaling and has received significant attention. Studies have addressed the effect of pMHC engagement, cluster migration, localization and colocalization of microclusters of many different signaling proteins over time [11,17,30,31,53,54,55,56]. Recently, photo-activatable localization microscopy and direct stochastic optical reconstruc-tion microscopy have been used for a detailed, quantitative analysis of LAT clusters and their phosphorylation at resolutions down to 20 nm [57,58].
Here, we established microcontact printing in combination with image processing for a quantitative analysis of stimulus-dependent protein microcluster formation in early T cell signaling. In a first step, we established that different levels of CD28 expression translated into different responses on antibody-coated surfaces. Consistent with a positive stimulatory role in signaling, Jurkat T cells expressing high levels of CD28 covered larger surface areas than CD28-low cells when stimulated with parallel stripes of
aCD28 and aCD3 or combinations ofaCD28 and IgG control stripes. Interestingly, we were not able to detect an increased level Figure 7. Impact of CD28 costimulation and SHP2 deficiency on cluster numbers and phosphorylation.Effects with 95% confidence intervals of CD28 costimulation (left) and the knock down of SHP2 (right) as predicted by ANOVAs on properties for which significant differences were found in Fig. 6. The effect is given as a fraction of the overall mean value for that specific property.
doi:10.1371/journal.pone.0079277.g007
Table 1.Measured cluster numbers and cell sizes.
Property SHP2 KD wt
pY clusters per cell 15.162.07 15.862.27
pPLCc1 (pY783) clusters per cell 12.960.77 13.060.88
cell contact surface (mm2) 167
63.93 17064.24
KD 3 KD 3+28 wt 3 wt 3+28
pY clusters per 100mm2 8.9
60.97 11.761.39 9.261.17 11.461.50
pPLCc1 (pY783) clusters per 100mm2
7.860.43 9.660.73 8.060.52 9.660.68
Values are given as mean6SEM. KD = SHP2 knock-down E6.1 Jurkat cells; wt = wild type E6.1 Jurkat cells; 3 = aCD3 stimulus alone; 3+28 =aCD3+a CD28-containing stripes.
of tyrosine phosphorylation in CD28-high cells. When no CD28 costimulus was present, no significant difference between the two cell lines was observed. This indicates that CD28-GFP expressing cells had not been compromised in their potential for activation through the stimulation of CD3. It has been shown that CD4+
T cells of rheumatoid arthritis patients express higher levels of CD28 and other markers of activated T cells than those of healthy controls [59]. The protocol presented here can serve as a tool to study how early signaling in such aberrant cells is affected and possibly provide clues for suitable treatments.
By performing a detailed side-by-side quantitative analysis of phosphotyrosine clusters on aCD3 and aCD3+aCD28 coated surfaces, we addressed to which extent the number and intensity of clusters were a function of the stimulus and the presence of an individual signaling protein.
CD28 costimulation led cells to form an increased density of phosphorylated microclusters (24% for pY and 15% for pY783 PLCc1) and relatively small increases in phosphotyrosine intensity of the clusters. Additionally,aCD3+aCD28 induced stronger local spreading than aCD3 alone. These results and the results discussed above show that CD28 plays a significant role in spreading of T cells suggesting that CD28 stimulation induces a T cells to more thoroughly probe the surface or APC it is currently engaging, even in the absence of CD3 engagement. Costimulation of T cells with CD28 has been previously demonstrated to promote expression of proteins involved in cytoskeletal remodeling [60] and the CD28 signal invokes actin reorganization and formation of lamellipodia through PI3K [21], cofilin [61] and Rho family GTPases [62]. Our data supports the notion that CD28 costimulation initiates qualitatively different signaling pathways than stimulation of the TCR.
The impact of SHP2 deficiency on cluster formation was qualitatively and quantitatively different from the impact of costimulation. In contrast to the effect of CD28 engagement, no significant difference in phosphorylated cluster density was observed. However, SHP2 deficiency did lead to a small but
significant increase of overall and cluster tyrosine phosphorylation and PLCc1 Y783 phosphorylation. PTP activity greatly exceeds kinase activity [63] and other PTPs may have overlapping substrate specificity with SHP2. Nevertheless, knock down of this single phosphatase had a perceivable effect on overall phospho-tyrosine levels. This demonstrates that the loss of SHP2 cannot be fully compensated by other phosphatases, such as SHP1, and therefore plays a non redundant role in T cell signaling. Interestingly, it has been recently found by Yokosuka et al. [44] that upon stimulation of the TCR and the negative regulator programmed cell death 1 (PD1), SHP2 itself forms clusters. In T cells expressing a phosphatase-dead dominant-negative form of SHP2 the phosphorylation of PD1 was increased which is in line with our observation of increased tyrosine phosphorylation.
In summary, these observations demonstrate that CD28 engagement contributes to the formation of clusters acting as signaling platforms, while SHP2 targets already formed signaling clusters. There were no indications that SHP2 specifically targets CD28 signaling.
Interestingly, for late T cell activity a reversed and large effect of SHP2 deficiency was observed. While general phosphotyrosine and phospho-PLCc1 signals were higher in the SHP2 KD cells during early signaling, IL2 production was lower as described previously [45]. This means that higher tyrosine phosphorylation levels during the first ten minutes of T cell stimulation do not necessarily result in a stronger T cell response. It also shows that SHP2, despite being one of many PTPs in T cells, has a significant regulatory effect on T cell activation. CD3 and CD28 stimulation were both necessary to generate an IL2 response. IL2 expression was also reduced for cells stimulated with PMA and ionomycin suggesting that SHP2 exerts this latter effect at a later stage of the signaling cascade than the initial dephosphorylating effect on PLCc. The effect on cytokine secretion observed is likely due to the positive effect of SHP2 on MAPK signaling [45,46] which is crucial for IL2 production [64]. Further research, however, is required in order to verify this hypothesis. Remarkably, it appears that SHP2 plays a dual role in IL2 production as Yokosuka et al. [44] observed SHP2, through PD1, negatively affected IL2 production.
The combination of micropatterned surfaces with quantitative image processing as demonstrated here, adds a valuable and accessible tool to the repertoire of analytical techniques in the analysis of early T cell signaling. Image processing is applied to a cell population in an unbiased fashion. The stamping of stripes enables a highly sensitive side-by-side analysis of different stimuli on a microscale level, which can be further extended to a side-by-side comparison of different cell strains eliminating noise arising from sample-to sample variation. Even though state-of-the-art superresolution techniques provide the means to visualize single molecules within clusters, challenges such as cell-to-cell and sample-to-sample variation still apply to these more advanced techniques.
In this study we addressed the role of the PTP SHP2 in cluster formation and phosphorylation using a SHP2 KD Jurkat strain next to wt Jurkat cells. However, quantitative comparisons of signaling can benefit the analysis of T cell biology in multiple other ways. T effector cells and T regulatory cells, for example, show very limited differences in the expression of signaling proteins, yet widely differ in their physiological role [65]. The approach shown here can be of great benefit to the quantitative understanding of the functional implications of differences in early T cell signaling. Figure 8. Effect of SHP2 depletion on IL2 expression.SHP2 KD
and wt Jurkat E6.1 T cells were stimulated with PMA+ionomycin (+), aCD3 &aCD28,aCD3 alone,aCD28 alone or were left unstimulated (–) for 22 h. IL2 in the supernatants was quantified by sandwich ELISAs.
Given are the absorption values6SEM. The p-values are from a full
Supporting Information
Figure S1 Over-expression of CD28 does not affect CD3 expression. Expression levels of CD28 (middle row) and CD3 (bottom row) were determined with flow cytometry for non-transfected Jurkat T cells (ACC-282; left) and CD28-GFP transfected cells (right). The top row shows a negative control in which cells were treated with unspecific IgG2a. Scatter plots with GFP expression on the X-axis and the immunolabelled receptors (Zenon Alexa 647) on the Y-axis are depicted.
(TIF)
Figure S2 Phospho tyrosine and phospho-PLCc1
label-ling control.Jurkat T cells were serum starved overnight and incubated on striped surfaces for 10 minutes. Surfaces were functionalized using stamps coated with 25mg/ml aCD3 and overlaid with 2.5mg/ml aCD3 + 2.5mg/ml aCD28. Samples
were immunolabeled with aphosphotyrosine conjugated with Zenon Alexa Fluor 546 component A and blocked with component B (A), the Zenon Alexa Fluor 546 component A blocked with component B without specific antibody (B), phosphoY783 PLCc1 andarabbit Alexa Fluor 546 (C) orarabbit Alexa Fluor 546 only (D). Images were acquired with a Zeiss LSM510 meta confocal laser scanning microscope using a 6361.4 N.A. PLAN APO objective and 543 nm and 633 nm HeNe lasers (Carl Zeiss, Sliedrecht, The Netherlands). Left panels: immuno-label. Right panels: stamped patterns. Contrast and brightness were adjusted proportionally. Scale bars 5mm.
(TIF)
Figure S3 Overlay of typical microscopy images used for analysis. One field of view at 204862048 pixels. In this case stamps coated with 25mg/mlaCD3 were used to generate a striped pattern (blue) which was overlaid with 2.5mg/mlaCD3+ 2.5mg/mlaCD28. The CFSE labeled (green) SHP2 KD Jurkat T cells are clearly distinguishable from the non-CFSE labeled wt Jurkat cells. After fixation with 3% PFA the cells were immunolabeled with aphospho-PLCc1 (grayscale). For clarity, contrast and brightness are adjusted proportionally. Scale bar main image 50mm; scale bar enlargement 10mm.
(TIF)
Figure S4 Tyrosine phosphorylation on control surfac-es.CD28-GFP transfected Jurkat ACC-282 T cells were serum starved for 6 h and then incubated on striped surfaces for 10 minutes, fixed with 3% PFA and immunolabeled with a pho-sphotyrosine. Surfaces were functionalized using stamps coated with 25mg/ml aCD3 (A) or unspecific IgG2a only (B). The
remainder was subsequently overlaid with either 5mg/mlaCD28 (A) or unspecific IgG2a only (B). Top left panels: transmission image; top right panels: CD28-GFP; bottom left: a phosphotyr-osine; bottom right panels: overlay of the stamped pattern (blue) and theaphosphotyrosine label (grayscale). For a better compar-ison no adjustments were made to the contrast or brightness of the images. Scale bars 50mm.
(TIF)
Figure S5 Reduced adherence and spreading of cells treated with cytochalasine D. Jurkat T cells were serum starved overnight and were treated with 10mM cytochalasine D (Tocris Bioscience, Bristol, UK) 10 minutes prior to, and during incubation on striped surfaces. Surfaces were functionalized using stamps coated with 25mg/mlaCD3 and overlaid with 2.5mg/ml
aCD3+ 2.5mg/ml aCD28. Samples were immunolabeled with
aphosphotyrosine. Images were acquired with a Zeiss LSM510 meta confocal laser scanning microscope using a 6361.4 N.A. PLAN APO objective and 543 nm and 633 nm HeNe lasers (Carl
Zeiss, Sliedrecht, The Netherlands). Panels from left to right: transmission image, immunolabel and stamped patterns. Scale bars 20mm.
(TIF)
Figure S6 SHP2 expression in SHP2 knock-down cells is reduced to 13% of wild type levels but both lines express receptors at comparable levels.A) Total cell lysates of Jurkat E6.1 SHP2 KD cells and Jurkat E6.1 ‘wt’ cells were subjected to SDS-PAGE followed by immunoblotting of SHP2 expression using a SHP2 antibody (rabbit polyclonal, N-10) from Santa Cruz Biotechnology (Heidelberg, Germany) or b-actin antibodies (mouse monoclonal, AC-15, Sigma-Aldrich, Deisenhofen, Ger-many). After subsequent incubation with horseradish peroxidase– conjugated secondary antibodies, the blots were developed using Western Lightning chemiluminescence detection (Perkin Elmer Life Sciences, Boston, MA, USA) and quantitatively evaluated using a CCD camera-based system (LAS3000; Fujifilm, Du¨ssel-dorf, Germany). SHP2 levels were quantified in relation tob-actin levels. Below, SHP2 expression levels are given relative to levels in wt cells.B & C) Expression levels of CD3 (left panels, Zenon Alexa 488) and CD28 (right panels, Zenon Alexa 647) were determined with flow cytometry for SHP2 KD cells (A) and wt cells (B). The unfilled histograms show isotype controls while the filled histogramsaCD3 andaCD28 labeled populations, respectively. (TIF)
Figure S7 CFSE fluorescence (green) is retained by all cells after fixation, permeabilization and immunolabeling. Stamps coated with 25mg/mlaCD3 were used to generate striped
patterns (blue) which were overlaid with 2.5mg/mlaCD3+2.5mg/ml
aCD28. Jurkat E6.1 ‘wild type’ cells were labeled with CFDA-SE (A) or mock labeled (B), serum starved over night and subsequently incubated on the micropatterned surfaces for 10 minutes, fixed with 3% PFA and immunolabeled with aphospho-PLCc1 (grayscale). A & B were recorded with identical microscopy settings and all three channels are overlaid for both. For clarity, contrast and brightness were adjusted proportionally. Scale bar 50mm.
(TIF)
Figure S8 SHP2 knock down effect on phosphatidylser-ine exposure.Wells of a 96-well flat bottom plate were coated as described for the ELISA in the Materials and Methods section. In these wells 1N10
5
SHP2 KD or wt Jurkat T cells were stimulated with aCD3 & aCD28 (clone CD28.2; eBioscience, Frankfurt, Germany),aCD3 alone,aCD28 alone or were left unstimulated (-) for 24 (left) or 48 hours (right) at 37uC, 5% CO2 and under humidified conditions. Cells were subsequently stained with the Annexin V-PE 7-AAD Apoptosis Detection Kit I (BD Pharmin-gen, Heidelberg, Germany) using the suppliers protocol. Phospha-tidylserine exposure was determined using a FACS Canto flow cytometer (BD Biosciences, Heidelberg, Germany) and character-izing 1N10
4
cells per sample. The graph shows the percentage of annexin V negative cells6SEM of three independent experiments. (TIF)
Macro S1 Macro used for data extraction from images of CD28-GFP transfected cells exposed to stripes of different stimuli. This self-written macro was used in combination with ImageJ to analyze the confocal images described in Fig. 2. The macro separates CD28-low and CD28-high cells on the different stripes. Guidelines to determine threshold values are included in the macro.
(TXT)
of stimuli.This self-written macro was used in combination with ImageJ to analyze confocal images described in Fig. 4. of samples generated as described in Materials and Methods. The macro performs segmentation into CFSE labeled and unlabelled cells and signaling clusters on the different stripes as illustrated in Fig. 5. Guidelines to determine threshold values are included in the macro. (TXT)
Author Contributions
Conceived and designed the experiments: JJW HG FDB MJWAH RB. Performed the experiments: JJW HG JPM MJWAH. Analyzed the data: JJW HG JPM JMMG. Contributed reagents/materials/analysis tools: GR JPM FDB. Wrote the paper: JJW HG MJWAH RB.
References
1. Monks CR, Freiberg BA, Kupfer H, Sciaky N, Kupfer A (1998) Three-dimensional segregation of supramolecular activation clusters in T cells. Nature 395: 82–86.
2. Grakoui A, Bromley SK, Sumen C, Davis MM, Shaw AS, et al. (1999) The immunological synapse: a molecular machine controlling T cell activation. Science 285: 221–227.
3. Saito T, Yokosuka T, Hashimoto-Tane A (2010) Dynamic regulation of T cell activation and co-stimulation through TCR-microclusters. FEBS Lett 584: 4865–4871.
4. Houtman JC, Yamaguchi H, Barda-Saad M, Braiman A, Bowden B, et al. (2006) Oligomerization of signaling complexes by the multipoint binding of GRB2 to both LAT and SOS1. Nat Struct Mol Biol 13: 798–805.
5. Samelson LE (2002) Signal transduction mediated by the T cell antigen receptor: the role of adapter proteins. Annu Rev Immunol 20: 371–394.
6. Huse M (2009) The T-cell-receptor signaling network. J Cell Sci 122: 1269– 1273.
7. Wange RL (2000) LAT, the linker for activation of T cells: a bridge between T cell-specific and general signaling pathways. Sci STKE 2000: re1.
8. Billadeau DD, Nolz JC, Gomez TS (2007) Regulation of T-cell activation by the cytoskeleton. Nat Rev Immunol 7: 131–143.
9. Seminario MC, Bunnell SC (2008) Signal initiation in T-cell receptor microclusters. Immunol Rev 221: 90–106.
10. Braiman A, Barda-Saad M, Sommers CL, Samelson LE (2006) Recruitment and activation of PLCgamma1 in T cells: a new insight into old domains. Embo J 25: 774–784.
11. Bunnell SC, Hong DI, Kardon JR, Yamazaki T, McGlade CJ, et al. (2002) T cell receptor ligation induces the formation of dynamically regulated signaling assemblies. J Cell Biol 158: 1263–1275.
12. Campi G, Varma R, Dustin ML (2005) Actin and agonist MHC-peptide complex-dependent T cell receptor microclusters as scaffolds for signaling. J Exp Med 202: 1031–1036.
13. Yokosuka T, Sakata-Sogawa K, Kobayashi W, Hiroshima M, Hashimoto-Tane A, et al. (2005) Newly generated T cell receptor microclusters initiate and sustain T cell activation by recruitment of Zap70 and SLP-76. Nat Immunol 6: 1253– 1262.
14. Balagopalan L, Barr VA, Sommers CL, Barda-Saad M, Goyal A, et al. (2007) c-Cbl-mediated regulation of LAT-nucleated signaling complexes. Mol Cell Biol 27: 8622–8636.
15. Lee KH, Holdorf AD, Dustin ML, Chan AC, Allen PM, et al. (2002) T cell receptor signaling precedes immunological synapse formation. Science 295: 1539–1542.
16. Barda-Saad M, Braiman A, Titerence R, Bunnell SC, Barr VA, et al. (2005) Dynamic molecular interactions linking the T cell antigen receptor to the actin cytoskeleton. Nat Immunol 6: 80–89.
17. Bunnell SC, Singer AL, Hong DI, Jacque BH, Jordan MS, et al. (2006) Persistence of cooperatively stabilized signaling clusters drives T-cell activation. Mol Cell Biol 26: 7155–7166.
18. Acuto O, Michel F (2003) CD28-mediated co-stimulation: a quantitative support for TCR signalling. Nat Rev Immunol 3: 939–951.
19. Song J, Lei FT, Xiong X, Haque R (2008) Intracellular signals of T cell costimulation. Cell Mol Immunol 5: 239–247.
20. Thiel M, Wolfs MJ, Bauer S, Wenning AS, Burckhart T, et al. (2010) Efficiency of T-cell costimulation by CD80 and CD86 cross-linking correlates with calcium entry. Immunology 129: 28–40.
21. Pages F, Ragueneau M, Rottapel R, Truneh A, Nunes J, et al. (1994) Binding of phosphatidylinositol-3-OH kinase to CD28 is required for T-cell signalling. Nature 369: 327–329.
22. Ueda Y, Levine BL, Huang ML, Freeman GJ, Nadler LM, et al. (1995) Both CD28 ligands CD80 (B7-1) and CD86 (B7-2) activate phosphatidylinositol 3-kinase, and wortmannin reveals heterogeneity in the regulation of T cell IL-2 secretion. Int Immunol 7: 957–966.
23. Garcon F, Patton DT, Emery JL, Hirsch E, Rottapel R, et al. (2008) CD28 provides T-cell costimulation and enhances PI3K activity at the immune synapse independently of its capacity to interact with the p85/p110 heterodimer. Blood 111: 1464–1471.
24. Otsu M, Hiles I, Gout I, Fry MJ, Ruiz-Larrea F, et al. (1991) Characterization of two 85 kd proteins that associate with receptor tyrosine kinases, middle-T/ pp60c-src complexes, and PI3-kinase. Cell 65: 91–104.
25. August A, Dupont B (1994) CD28 of T-Lymphocytes Associates with Phosphatidylinositol 3-Kinase. International Immunology 6: 769–774.
26. Cantrell DA (2001) Phosphoinositide 3-kinase signalling pathways. J Cell Sci 114: 1439–1445.
27. August A, Gibson S, Kawakami Y, Kawakami T, Mills GB, et al. (1994) CD28 is associated with and induces the immediate tyrosine phosphorylation and activation of the Tec family kinase ITK/EMT in the human Jurkat leukemic T-cell line. Proc Natl Acad Sci U S A 91: 9347–9351.
28. Perez-Villar JJ, Kanner SB (1999) Regulated association between the tyrosine kinase Emt/Itk/Tsk and phospholipase-C gamma 1 in human T lymphocytes. J Immunol 163: 6435–6441.
29. Michel F, Attal-Bonnefoy G, Mangino G, Mise-Omata S, Acuto O (2001) CD28 as a molecular amplifier extending TCR ligation and signaling capabilities. Immunity 15: 935–945.
30. Manz BN, Jackson BL, Petit RS, Dustin ML, Groves J (2011) T-cell triggering thresholds are modulated by the number of antigen within individual T-cell receptor clusters. Proc Natl Acad Sci U S A 108: 9089–9094.
31. Yokosuka T, Kobayashi W, Sakata-Sogawa K, Takamatsu M, Hashimoto-Tane A, et al. (2008) Spatiotemporal regulation of T cell costimulation by TCR-CD28 microclusters and protein kinase C theta translocation. Immunity 29: 589–601. 32. Beal AM, Anikeeva N, Varma R, Cameron TO, Vasiliver-Shamis G, et al. (2009) Kinetics of early T cell receptor signaling regulate the pathway of lytic granule delivery to the secretory domain. Immunity 31: 632–642.
33. Vasiliver-Shamis G, Cho MW, Hioe CE, Dustin ML (2009) Human immunodeficiency virus type 1 envelope gp120-induced partial T-cell receptor signaling creates an F-actin-depleted zone in the virological synapse. J Virol 83: 11341–11355.
34. Mossman KD, Campi G, Groves JT, Dustin ML (2005) Altered TCR signaling from geometrically repatterned immunological synapses. Science 310: 1191– 1193.
35. Shen K, Thomas VK, Dustin ML, Kam LC (2008) Micropatterning of costimulatory ligands enhances CD4+T cell function. Proc Natl Acad Sci U S A 105: 7791–7796.
36. Singhvi R, Kumar A, Lopez GP, Stephanopoulos GN, Wang DI, et al. (1994) Engineering cell shape and function. Science 264: 696–698.
37. Bernard A, Renault JP, Michel B, Bosshard HR, Delamarche E (2000) Microcontact printing of proteins. Advanced Materials 12: 1067–1070. 38. Culley FJ, Johnson M, Evans JH, Kumar S, Crilly R, et al. (2009) Natural killer
cell signal integration balances synapse symmetry and migration. PLoS Biol 7: e1000159.
39. Feng GS, Hui CC, Pawson T (1993) SH2-containing phosphotyrosine phosphatase as a target of protein-tyrosine kinases. Science 259: 1607–1611. 40. Lorenz U (2009) SHP-1 and SHP-2 in T cells: two phosphatases functioning at
many levels. Immunol Rev 228: 342–359.
41. Lee KM, Chuang E, Griffin M, Khattri R, Hong DK, et al. (1998) Molecular basis of T cell inactivation by CTLA-4. Science 282: 2263–2266.
42. Latchman Y, Wood CR, Chernova T, Chaudhary D, Borde M, et al. (2001) PD-L2 is a second ligand for PD-1 and inhibits T cell activation. Nat Immunol 2: 261–268.
43. Newman DK, Hamilton C, Newman PJ (2001) Inhibition of antigen-receptor signaling by Platelet Endothelial Cell Adhesion Molecule-1 (CD31) requires functional ITIMs, SHP-2, and p56(lck). Blood 97: 2351–2357.
44. Yokosuka T, Takamatsu M, Kobayashi-Imanishi W, Hashimoto-Tane A, Azuma M, et al. (2012) Programmed cell death 1 forms negative costimulatory microclusters that directly inhibit T cell receptor signaling by recruiting phosphatase SHP2. J Exp Med 209: 1201–1217.
45. Nguyen TV, Ke Y, Zhang EE, Feng GS (2006) Conditional deletion of Shp2 tyrosine phosphatase in thymocytes suppresses both pre-TCR and TCR signals. J Immunol 177: 5990–5996.
46. Neel BG, Gu H, Pao L (2003) The ’Shp’ing news: SH2 domain-containing tyrosine phosphatases in cell signaling. Trends Biochem Sci 28: 284–293. 47. Holgado-Madruga M, Emlet DR, Moscatello DK, Godwin AK, Wong AJ (1996)
A Grb2-associated docking protein in EGF- and insulin-receptor signalling. Nature 379: 560–564.
48. Takahashi-Tezuka M, Yoshida Y, Fukada T, Ohtani T, Yamanaka Y, et al. (1998) Gab1 acts as an adapter molecule linking the cytokine receptor gp130 to ERK mitogen-activated protein kinase. Mol Cell Biol 18: 4109–4117. 49. Nishida K, Yoshida Y, Itoh M, Fukada T, Ohtani T, et al. (1999) Gab-family
adapter proteins act downstream of cytokine and growth factor receptors and T-and B-cell antigen receptors. Blood 93: 1809–1816.
51. Osborn M, Weber K (1982) Immunofluorescence and immunocytochemical procedures with affinity purified antibodies: tubulin-containing structures. Methods in Cell Biology: Cytoskeleton: Cytoskeletal Proteins Isolation and Characterization: 97.
52. Abramoff MD, Magelhaes PJ, Ram SJ (2004) Image Processing with ImageJ. Biophotonics International 11: 36–42.
53. Varma R, Campi G, Yokosuka T, Saito T, Dustin ML (2006) T cell receptor-proximal signals are sustained in peripheral microclusters and terminated in the central supramolecular activation cluster. Immunity 25: 117–127.
54. Hashimoto-Tane A, Yokosuka T, Sakata-Sogawa K, Sakuma M, Ishihara C, et al. (2011) Dynein-driven transport of T cell receptor microclusters regulates immune synapse formation and T cell activation. Immunity 34: 919–931. 55. DeMond AL, Mossman KD, Starr T, Dustin ML, Groves JT (2008) T cell
receptor microcluster transport through molecular mazes reveals mechanism of translocation. Biophys J 94: 3286–3292.
56. Hashimoto-Tane A, Yokosuka T, Ishihara C, Sakuma M, Kobayashi W, et al. T-cell receptor microclusters critical for T-cell activation are formed independently of lipid raft clustering. Mol Cell Biol 30: 3421–3429. 57. Owen DM, Rentero C, Rossy J, Magenau A, Williamson D, et al. (2010) PALM
imaging and cluster analysis of protein heterogeneity at the cell surface. J Biophotonics 3: 446–454.
58. Williamson DJ, Owen DM, Rossy J, Magenau A, Wehrmann M, et al. (2011) Pre-existing clusters of the adaptor Lat do not participate in early T cell signaling events. Nat Immunol 12: 655–662.
59. Salazar-Fontana LI, Sanz E, Merida I, Zea A, Sanchez-Atrio A, et al. (2001) Cell surface CD28 levels define four CD4+T cell subsets: abnormal expression in rheumatoid arthritis. Clin Immunol 99: 253–265.
60. Lichtenfels R, Rappl G, Hombach AA, Recktenwald CV, Dressler SP, et al. (2012) A proteomic view at T cell costimulation. PLoS One 7: e32994. 61. Lee KH, Meuer SC, Samstag Y (2000) Cofilin: a missing link between T cell
co-stimulation and rearrangement of the actin cytoskeleton. Eur J Immunol 30: 892–899.
62. Reif K, Nobes CD, Thomas G, Hall A, Cantrell DA (1996) Phosphatidylinositol 3-kinase signals activate a selective subset of Rac/Rho-dependent effector pathways. Curr Biol 6: 1445–1455.
63. Mustelin T, Tasken K (2003) Positive and negative regulation of T-cell activation through kinases and phosphatases. Biochem J 371: 15–27. 64. Fang H, Cordoba-Rodriguez R, Lankford CS, Frucht DM (2005) Anthrax lethal
toxin blocks MAPK kinase-dependent IL-2 production in CD4+T cells. J Immunol 174: 4966–4971.
![Fig. 1). It has been shown previously that in this manner each part of the surface contains only one type of stimulus [38].](https://thumb-eu.123doks.com/thumbv2/123dok_br/17161596.240725/5.918.88.829.88.557/fig-shown-previously-manner-surface-contains-type-stimulus.webp)