SED
7, 3021–3052, 2015Arctic soils of Western Siberia
E. Ejarque and E. Abakumov
Title Page
Abstract Introduction
Conclusions References
Tables Figures
◭ ◮
◭ ◮
Back Close
Full Screen / Esc
Printer-friendly Version Interactive Discussion
Discussion
P
a
per
|
Discussion
P
a
per
|
Discussion
P
a
per
|
Discussion
P
a
per
|
Solid Earth Discuss., 7, 3021–3052, 2015 www.solid-earth-discuss.net/7/3021/2015/ doi:10.5194/sed-7-3021-2015
© Author(s) 2015. CC Attribution 3.0 License.
This discussion paper is/has been under review for the journal Solid Earth (SE). Please refer to the corresponding final paper in SE if available.
Stability and biodegradability of humic
substances from Arctic soils of Western
Siberia: insights from
13
C-NMR
spectroscopy and elemental analysis
E. Ejarque1,2,3and E. Abakumov3
1
WasserCluster Lunz – Biologische Station GmbH, Lunz am See, Austria
2
Department of Limnology and Oceanography, University of Vienna, Vienna, Austria
3
Department of Applied Ecology, Saint Petersburg State University, Saint Petersburg, Russia
Received: 10 October 2015 – Accepted: 12 October 2015 – Published: 2 November 2015
Correspondence to: E. Ejarque ([email protected])
SED
7, 3021–3052, 2015Arctic soils of Western Siberia
E. Ejarque and E. Abakumov
Title Page
Abstract Introduction
Conclusions References
Tables Figures
◭ ◮
◭ ◮
Back Close
Full Screen / Esc
Printer-friendly Version Interactive Discussion
Discussion
P
a
per
|
Discussion
P
a
per
|
Discussion
P
a
per
|
Discussion
P
a
per
|
Abstract
Arctic soils contain large amounts of organic matter which, globally, exceed the amount of carbon stored in vegetation biomass and in the atmosphere. Recent studies empha-size the potential sensitivity for this soil organic matter (SOM) to be mineralised when faced with increasing ambient temperatures. In order to better refine the predictions
5
about the response of SOM to climate warming, there is a need to increase the spa-tial coverage of empirical data on SOM quantity and quality in the Arctic area. This study provides, for the first time, a characterisation of SOM from the Gydan Penin-sula in the Yamal Region, Western Siberia, Russia. On the one hand, soil humic acids and their humification state were characterised by measuring the elemental
composi-10
tion and diversity of functional groups using solid-state13C-NMR spectroscopy. Also, the total mineralisable carbon was measured. Our results show that there is a uni-formity of SOM characteristics throughout the studied region, as well as within soil profiles. Such in-depth homogeneity, together with a predominance of aliphatic carbon structures, suggests the accumulation in soil of raw and slightly decomposed organic
15
matter. Moreover, results on total mineralisable carbon suggest a high lability of these compounds. The mineralisation rate was found to be independent of SOM quality, and to be mainly explained solely by the total carbon content. Overall, our results provide further evidence on the fundamental role that the soils of Western Siberia may have on regulating the global carbon balance when faced with increasing ambient
tempera-20
tures.
1 Introduction
Polar soils play a key role in the global carbon balance, as they provide maximum stocks of soil organic matter (SOM) within the whole pedosphere (McGuire et al., 2009). Large amounts of organic matter have accumulated during the quaternary
pe-25
temper-SED
7, 3021–3052, 2015Arctic soils of Western Siberia
E. Ejarque and E. Abakumov
Title Page
Abstract Introduction
Conclusions References
Tables Figures
◭ ◮
◭ ◮
Back Close
Full Screen / Esc
Printer-friendly Version Interactive Discussion
Discussion
P
a
per
|
Discussion
P
a
per
|
Discussion
P
a
per
|
Discussion
P
a
per
|
atures and over moisture, which have kept decomposition rates low (Davidson and Janssens, 2006). However, current trends of climate warming and permafrost thaw-ing in the arctic region (Romanovsky et al., 2010) may favour an acceleration of the degradation of SOM, and hence, to an increase in the release of greenhouse gases like carbon dioxide and methane (Christensen et al., 1999; Gruber et al., 2004; Zimov
5
et al., 2006). Other consequences of climate change on SOM may include an increase of the thickness of the soil active layer – which may affect SOM transformation (Zubrzy-cki et al., 2014) –, as well as changes in land cover (Desyatkin and Desyatkin, 2006), length of the growing season, and soil evolution (Ivanov et al., 2015) – which may affect the availability and quality of SOM precursor materials.
10
In order to better predict how Arctic soils may respond to increasing climatic tem-peratures, recent research has focused in the total quantification of standing stocks of organic matter in soils from polar regions (Hugelius et al., 2012, 2014; Tarnocai et al., 2009). Such quantifications emphasize the large magnitude of stored carbon in arc-tic soils – estimated around 1024 Pg (Tarnocai et al., 2009) –, which largely exceeds
15
the total carbon globally contained in vegetation biomass (450–650 Pg) or in the atmo-sphere (589 Pg), according to the latest estimations (IPCC, 2013).
Parallel to quantification efforts, the characterisation of SOM lability and composition is fundamental in order to better understand (i) the humification degree that it has un-dergone during its time residence in soils, and (ii) its further potential biodegradability
20
if faced with increasing temperatures. SOM characteristics like the elemental compo-sition and the carbon chemical structure (via solid-state 13C-NMR spectorscopy) of humic acids have been commonly used to infer humification status in soils (Kogel-Knabner, 1997; Zech et al., 1997), and more specifically in Arctic soils (Abakumov and Fattakhova, 2015; Abakumov et al., 2014; Calace et al., 1995, 2005; Chukov et al.,
25
SED
7, 3021–3052, 2015Arctic soils of Western Siberia
E. Ejarque and E. Abakumov
Title Page
Abstract Introduction
Conclusions References
Tables Figures
◭ ◮
◭ ◮
Back Close
Full Screen / Esc
Printer-friendly Version Interactive Discussion
Discussion
P
a
per
|
Discussion
P
a
per
|
Discussion
P
a
per
|
Discussion
P
a
per
|
However, despite the recent increase in the research efforts in this direction, quantita-tive estimates of soil carbon stocks and mineralisation potential are still subject to large uncertainties, as extense polar land areas still remain uncharacterised (Horwath Burn-ham and Sletten, 2010; Hugelius et al., 2014). Moreover, there is a paucity of regional studies thoroughly assessing the quality of SOM across the Arctic and the Antarctic.
5
Therefore, in order to better constrain soil carbon stocks and their potential sensitivity and contribution to climate warming, there is a need for more detailed landscape-scale assessments of SOM in understudied areas.
This study presents, for the first time, a detailed characterization of the bulk organic matter and humic acids from soils of the Yamal region, located in northern Siberia,
10
Russia. This region, as is more than 60 % of the Russian land surface, is underlayed by permafrost (Kotlyakov and Khromova, 2002) and is almost entirely covered by tun-dra grasslands. Within the Arctic, the Yamal region has been especially sensitive to climate warming, as it experienced an increase in the average air temperature of 1– 2◦C over the past 30 years (Forbes et al., 2009). As mentioned, such increase in the
15
ambient temperatures may enhance SOM humification rates and carbon emissions to the atmosphere, potentially unbalancing the current carbon balance (McGuire et al., 2009).
The Yamal Region presents a diversity of soil types due to regionally-varying condi-tions of the cryopedogenesis process, including depth of the active layer, texture and
20
structure of parent materials and bedrocks, and historic climatic conditions. As is most common for the whole Siberia, the Yamal pensinsula is covered by Cryosols (according to the World Reference Base for Soil Resources (WRB) system, FAO, 2014), or Cry-ozems (according to the Russian Soil Taxonomy, Shishov et al., 2004), which are part of the Gelisol unit. More specifically, the main soil types can be classified as Histosols,
25
de-SED
7, 3021–3052, 2015Arctic soils of Western Siberia
E. Ejarque and E. Abakumov
Title Page
Abstract Introduction
Conclusions References
Tables Figures
◭ ◮
◭ ◮
Back Close
Full Screen / Esc
Printer-friendly Version Interactive Discussion
Discussion
P
a
per
|
Discussion
P
a
per
|
Discussion
P
a
per
|
Discussion
P
a
per
|
composed. In Cryosols there is often a cryogenic exchange of organic matter between different horizons which enhances additional long-term accumulation of carbon (Kaiser et al., 2007).
The general aim of this work is to characterize the humification process in soils of the Yamal region, as well as the mineralization potential of SOM. This is addressed
5
by quantifying and characterizing SOM from different sites across the Yamal Region, in order to eventually unveil landscape-geographical trends of humification. The main methodologies used are13C-NMR spectroscopy, elemental composition and total min-eralisable carbon analysis.
More specifically, the objectives are:
10
– To quantify total soil organic carbon content, together with the total mineralisable fraction.
– To characterize the elemental composition of humic acids and observe trends in their ratios.
– To provide detailed structural characteristics of humic acids using13C-NMR
spec-15
troscopy.
– To infer the humification degree of soil humic acids based on 13C-NMR spec-troscopy and elemental composition.
2 Methods
2.1 Study sites
20
SED
7, 3021–3052, 2015Arctic soils of Western Siberia
E. Ejarque and E. Abakumov
Title Page
Abstract Introduction
Conclusions References
Tables Figures
◭ ◮
◭ ◮
Back Close
Full Screen / Esc
Printer-friendly Version Interactive Discussion
Discussion
P
a
per
|
Discussion
P
a
per
|
Discussion
P
a
per
|
Discussion
P
a
per
|
of the Yamal Peninsula (Fig. 1). The Gydan Peninsula is a predominantly flat territory entirely covered by permafrost and tundra/forest-tundra vegetation. Soils have devel-oped on Pleistocene sands underlain by marine clays and alluvial sediments during the late Quaternary (Walker et al., 2009), largely influenced by cryogenesis. The average annual air temperature is−10◦C, where the minimal monthly average is registered in
5
January (−25◦C) and the maximal in August (+8◦C). On average, the air temperature
stays at positive values during 70 days per year. The average annual precipitation in the region is 325 mm yr−1and the average evaporation is between 50 and 100 mm yr−1 (Buchkina et al., 1998). Within the Arctic, the Yamal region is especially sensitive to climate warming, as it has experienced an increase of 1–2◦C of the average air
tem-10
peratures over the past 30 years (Forbes et al., 2009), and it is still predicted to increase at a rate of 0.01◦C yr−1during the next decades (Khrustalev et al., 2003).
In 2012, for the first time the Government of the Yamal-Nenets region in con-junction with the Arctic and Antarctic Research Institute of RosHydromet, performed a comprehensive expedition for the examination of the Yamal Peninsula (KAEMB
Arc-15
tic Yamal 2012). The second expedition was organized in September–October 2013 (KAEMB Arctic Yamal 2013) and in this occasion stops and field camps were performed in the Gydan Peninsula. In this study we present the results of the soils sampled during the second expedition.
2.2 Soil morphology and general characteristics of the sampling sites
20
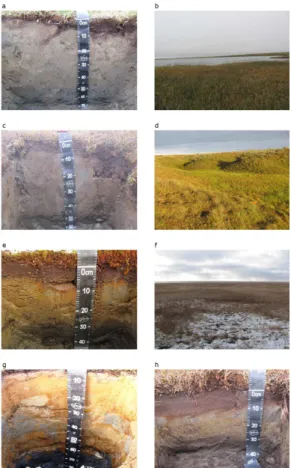
Typical Cryosol was investigated on the Yavay peninsula (72◦21.642′N, 75◦05.144′E) (Fig. 2a). It consists of an upper histic horizon of raw humus, some cryogenic cracks and a fairly homogenous mineral soil profile. The typical landscape of the Yavay penin-sula is shown on Fig. 2f. The deepness of the permafrost is about 70–80 cm. On the border of the permafrost and mineral soil the morphological features of gleyification are
25
evident. Here the soil was sampled at 0–5 cm.
SED
7, 3021–3052, 2015Arctic soils of Western Siberia
E. Ejarque and E. Abakumov
Title Page
Abstract Introduction
Conclusions References
Tables Figures
◭ ◮
◭ ◮
Back Close
Full Screen / Esc
Printer-friendly Version Interactive Discussion
Discussion
P
a
per
|
Discussion
P
a
per
|
Discussion
P
a
per
|
Discussion
P
a
per
|
Landscapes here (Fig. 2d) were less differentiated in relation to the elevation and were more overmoisted than the Yavay peninsula. The depth of visible permafrost border was about 90 cm. The soil was sampled at 0–10 cm.
The landscape of the Enisey Gulf (72◦22.451′N, 78◦38.586′E) was predominantly flat, without any relevant relief differentiation (Fig. 2f). Therefore, soils were highly
over-5
moisted and Histic Gleysols were dominant (Fig. 2e). The depth of permafrost in both plots of the Enisey Gulf was about 40–45 cm. The climate of the Enisey Gulf is consid-ered as the most severe in comparison with the other investigated plots. The soil was sampled at two depths: 0–5 and 5–9 cm.
Soils of the Beliy Island (73◦18.421′N, 71◦23.555′E) were classified as Entic Podozol
10
(Fig. 2g). The upper part of the horizon presented weak features of podzolisation, and it was underlayed by material affected by cryoturbation in the middle profile. The lower part was a Gleyic horizon (60–170 cm) of intensive blue color, underlayed by permafrost at 200 cm depth. The soil was sampled at 0–7 cm.
In Haranasale cape (71◦25.402′N, 73◦03.758′E) relief forms were very different and
15
presented hills and lowlands with relative elevation changes of about 100 m. Soils here consisted mainly of Histic Gleysols (Fig. 2h). The upper border of the permafrost layer was about 60–70 cm. Here two soil profiles were sampled: one at 0–5 and 5–11 cm depth (hereafter referred to as Haranasal-1) and another at 0–5, 5–10 and 20–30 cm depth (hereafter referred to as Haranasale-2).
20
2.3 Analytical methods
2.3.1 Bulk SOM characterisation
All chemical soil parameters were studied on a fine earth of soil after being passed through a 1 mm sieve. Total soil organic carbon content was determined by dichromate oxidation-titration method (Walkely, 1947). Total mineralisable carbon was determined
25
SED
7, 3021–3052, 2015Arctic soils of Western Siberia
E. Ejarque and E. Abakumov
Title Page
Abstract Introduction
Conclusions References
Tables Figures
◭ ◮
◭ ◮
Back Close
Full Screen / Esc
Printer-friendly Version Interactive Discussion
Discussion
P
a
per
|
Discussion
P
a
per
|
Discussion
P
a
per
|
Discussion
P
a
per
|
with 1 mol L−1 NaOH (Anderson, 1982) in duplicate. The amount of CO2 trapped in
the alkali solution was measured by titration after 7 days. Soil pH was determined according to standard procedure using soil/water or salt ratio of 1 : 2.5.
The optical index E4/E6 was measured on SOM humic substances solution as the absorbance measured at 465 nm divided by that at 690 nm (Chen et al., 1977). SOM
5
humic substances solution was obtained by diluting soil with a 0.1 M NaOH solution at a soil/solution mass ratio of 1 : 10 followed by gravity filtration. Further, E4/E6 data were used to estimate SOM lability using Kumada’s classification system (Kumada, 1987). For that, E4/E6 values were transformed into∆logK using the empirical rela-tionship∆logK =0.135×E4/E6 (Ikeya and Watanabe, 2003).
10
2.3.2 Extraction of humic acids
Humic acids were extracted from each soil sample according to the following proce-dure (Schnitzer, 1982). Briefly, humic acids (HAs) were extracted with 0.1 M NaOH (soil/solution mass ratio 1 : 10) under nitrogen gas. After 24 h of shaking, the alkaline supernatant was separated from the soil residue by centrifugation at 1516×gfor 20 min
15
and acidified to pH 1 with 6 M HCl to induce the precipitation of HAs. The supernatant, which contained fulvic acids (FA), was separated from the precipitate (containing HAs) by centrifugation at 1516×gfor 15 min. The HAs were then redissolved in 0.1 M NaOH
and shaken for 4 h under N2before the suspended solids were removed by centrifuga-tion. The HA solution was acidified again with 6 M HCl to pH 1, and the HAs were
sep-20
SED
7, 3021–3052, 2015Arctic soils of Western Siberia
E. Ejarque and E. Abakumov
Title Page
Abstract Introduction
Conclusions References
Tables Figures
◭ ◮
◭ ◮
Back Close
Full Screen / Esc
Printer-friendly Version Interactive Discussion
Discussion
P
a
per
|
Discussion
P
a
per
|
Discussion
P
a
per
|
Discussion
P
a
per
|
2.3.3 Characterisation of humic acids
HAs were characterized for their elemental composition (C, N, H, and S) using a Euro EA3028-HT analyzer. Data were corrected for water and ash content. Oxygen content was calculated by difference.
13
C-NMR spectra of humic acids were measured with a Bruker Avance 500 NMR
5
spectrometer (Karlsruhe, Germany, 2003) in a 4 mm ZrO2 rotor. The magic angle spinning speed was 20 kHz in all cases, and the nutation frequency of 13C fields for crosspolarization was u1/2p 1/4 62.5 kHz. Repetition delay and number of scans were 3 s. Groups of structural compounds were identified by the chemical shifts values: 190– 170 ppm – carboxyl group and amidic carbonyl, 170–150 ppm – aromatic C of fenols
10
and fenol esters, 150–135 ppm – alkylaromatic, 135–108 ppm – protonize aromatic car-bon, bridgehead C, 108–100 ppm – cellulose anomeric carbon and hemiacetal carcar-bon, 100–70 ppm – resonance region of C–H bonds, secondary alcohols, and other carbon atoms bound to oxygen, 70–50 ppm – methyl group resonance region of aliphatic and aromatic ethyl ethers, amino acid carbons, and methyl esters of carboxylic groups, 50–
15
32 ppm – resonance region of quarternal carbon and CH carbons, 32–27 ppm – res-onance region of CH2 alkyl structures in transconformation, 27–10 ppm – resonance
region of alkyl methyls and CH2units. Degree of aromaticity was calculated as a sum
of signals intensity in regions of 100–170+183–190 ppm, while the sum of aliphatic compounds were calculated in intervals 0–100+164–183 ppm.
20
2.4 Statistical analyses
All statistical analyses were performed within the R environment (R Development Core Team, 2015). Simple relationships between variables were explored using univariate linear model correlations based on Pearson’s R. For the total mineralisable carbon, a multivariate model analysis was performed to detect what SOM quantitative and
qual-25
SED
7, 3021–3052, 2015Arctic soils of Western Siberia
E. Ejarque and E. Abakumov
Title Page
Abstract Introduction
Conclusions References
Tables Figures
◭ ◮
◭ ◮
Back Close
Full Screen / Esc
Printer-friendly Version Interactive Discussion
Discussion
P
a
per
|
Discussion
P
a
per
|
Discussion
P
a
per
|
Discussion
P
a
per
|
fit for every possible combination of explanatory variables. The best model was con-sidered to be that with a lowest Mallow’s Cp (James et al., 2013). Computations were performed using the leaps package for R (Lumley, 2009).
In order to better understand the regional distribution of carbon structures a multivari-ate approach was used. A non-metric multidimensional scaling (NMDS) analysis using
5
Bray–Curtis dissimilarities was performed on the structural carbon compounds defined from13C-NMR spectra. The quality of the ordination was improved by submitting the data to Wisconsin double standardisation. Interpretation of the NMDS ordination was enhanced by overlaying information on the elemental composition of humic acids and characteristics of bulk SOM. This was achieved by performing a vector fitting analysis.
10
Variables were centered by subtracting their mean and scaled by dividing by their stan-dard deviation. Fittings were considered significant at p <0.01. Computations for the multivariate analysis were performed using the vegan package for R (Oksanen et al., 2012).
3 Results and discussion
15
3.1 Bulk soil organic matter characteristics
Across the studied region, soils contained an average of 14.3±10.8 % of total carbon
(Table 1). Among the surface layers (0–5 cm), the highest amounts of carbon were found in Enisey Gulf (36.4 %), followed by Gyda Yurivey Gulf (27.4 %, 0–5 cm). More moderate amounts of carbon were found in Yavay Cape (13.7 %) and Haranasale-2
20
Cape (12.3 and 7.5 %). These amounts are similar to total carbon contents previously reported in tundra Gelic gleysols (Dziadowiec et al., 1994). By contrast, Belyi Island was the location with the lowest carbon content in surface soil (5.7 %).
In Enisey Gulf, the high amounts of carbon in the surface decreased substantially at subsurface layers (from 36.4 % at 0–5 cm to 18.0 % at 5–9 cm), whereas in Haranasale
25
SED
7, 3021–3052, 2015Arctic soils of Western Siberia
E. Ejarque and E. Abakumov
Title Page
Abstract Introduction
Conclusions References
Tables Figures
◭ ◮
◭ ◮
Back Close
Full Screen / Esc
Printer-friendly Version Interactive Discussion
Discussion
P
a
per
|
Discussion
P
a
per
|
Discussion
P
a
per
|
Discussion
P
a
per
|
site1) or even increased (12.3 % at 0–5 cm to 15.2 % at 5–10 cm, site 2). Such increase of carbon content in depth may indicate cryoturbation, i.e. vertical soil mixing due to freezing and thawing cycles, a common process in Cryosols (Bockheim and Tarnocai, 1998). Further deep in the same soil profile (at 20–30 cm), carbon content was almost inexistent (0.4 %).
5
The optical index E4/E6 decreases with the level of carbon conjugation, and hence, has been commonly used to assess the molecular complexity of bulk organic matter (Chen et al., 1977; Peacock et al., 2014; Summers et al., 1987) and to infer the de-gree of humification of soil HAs (Hugelius et al., 2012; Ikeya and Watanabe, 2003; Kumada, 1987). The lowest value was found in the mineral layer of Haranasale-2
(Ta-10
ble 1). This is in accordance with the general finding that SOM in mineral horizons has a higher degree of humification than that in organic horizons (Hugelius et al., 2012). However, all samples exhibited E4/E6 values ranging between 0.15 and 0.86. Corre-sponding∆logK values, derived from E4/E6 using the empirical relationship in Ikeya and Watanabe (2003), indicates that all soils correspond to the A-type, which is the
15
highest lability class according to Kumada’s (1987) classification system of HAs. Our values are also remarkably lower than those previously reported in arctic tundra soils (Dziadowiec et al., 1994).
3.2 Elemental composition of humic acids
The H/C ratio, commonly interpreted as an indicator of the aromatic degree of humic
20
acids (Rice and McCarthy, 1991), had a very narrow range of variation (between 0.105 and 0.116, averaging 0.109±0.004, SD=0.004), indicating that all samples had
prac-tically the same level of molecular complexity. The highest values of these ratios were found in Enisey Gulf, Belyi Island and at the deep mineral layer of Haranasale-2 Cape (20–30 cm), indicating a slightly higher predominance of aliphatic structures in the
hu-25
SED
7, 3021–3052, 2015Arctic soils of Western Siberia
E. Ejarque and E. Abakumov
Title Page
Abstract Introduction
Conclusions References
Tables Figures
◭ ◮
◭ ◮
Back Close
Full Screen / Esc
Printer-friendly Version Interactive Discussion
Discussion
P
a
per
|
Discussion
P
a
per
|
Discussion
P
a
per
|
Discussion
P
a
per
|
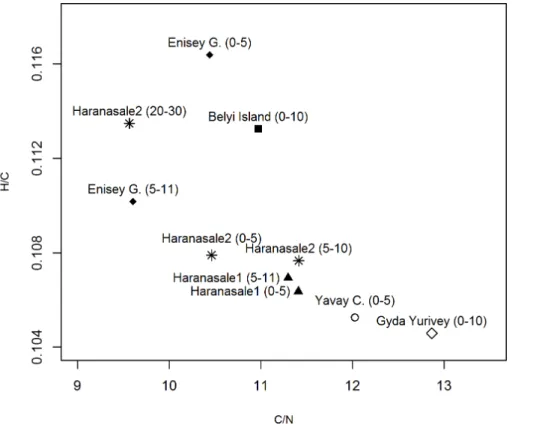
The H/C ratio was found to be negatively correlated with the C/N ratio (Fig. 3), even though it explained less than 50 % of its variance (r2=0.439, p <0.05, df =8,
F =8.035). This indicates that in sites with higher aromaticity, the nitrogen content was lower. This would be indicative of humic acids that are in a slightly more advanced stage in the humification process, during which bacteria would have utilised the
nitro-5
gen contained in the organic molecules.
Along soil profiles, the C/N content was found to be slightly lower at deeper layers in Haranasale-1 and Enisey Gulf (Table 2), indicating that humic acids have a slightly increased degree of decomposition in the subsurface layers (Kuhry and Vitt, 1996). However, in Haranasale-2 there was an increase from the surface layer (0–5 cm) to
10
the subsurface one (5–10 cm) from 10.46 to 11.41. This higher availability of N in the subsurface layer is consistent with the increase in total soil carbon content, and may be related to a lower degree of decomposition due to mobility of organic material from surface layer due to cryoturbation.
The O/C ratio, indicator of the oxygenation degree of humic acids, is related with
15
the presence of carbohydrates and carboxylic functional groups (Zaccone et al., 2007). In the three measured soil profiles an increase of the O/C ratio can be observed in depth, even though with progress of the humification it is expected to decrease. Due to the low variability in the O/C values (SD=0.095), such differences between the soil layers could be due to analytical variability rather than to any trends in the humification
20
process.
3.3 13C-NMR characterisation of humic acids
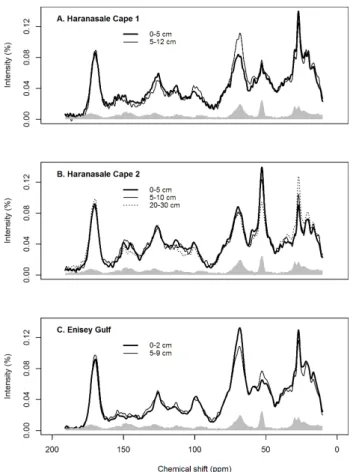
The 13C-NMR spectra reveal the structural diversity of carbon atoms within soil or-ganic matter (Table 3). Figures 4 and 5 show that there were only small differences in the13C-NMR spectral shapes, both accross the different surface layers, and within
25
SED
7, 3021–3052, 2015Arctic soils of Western Siberia
E. Ejarque and E. Abakumov
Title Page
Abstract Introduction
Conclusions References
Tables Figures
◭ ◮
◭ ◮
Back Close
Full Screen / Esc
Printer-friendly Version Interactive Discussion
Discussion
P
a
per
|
Discussion
P
a
per
|
Discussion
P
a
per
|
Discussion
P
a
per
|
mainly temperature and moisture, are the main drivers of soil humic acids composi-tion, and that chemical properties like C/N ratio and soil pH play only a secondary role (Zech et al., 1997).
In all sites,13C-NMR data showed that there was a predominance of aliphatic car-bons (68.85±3.60 %) over aromatic ones (31.15±3.60 %, Table 4). This may reflect
5
the predominance of non-ligneous vegetation as the main precursor of soil humic acids, similarly to what has been previously reported for arctic and antarctic soils (Abakumov et al., 2014; Calace et al., 1995).
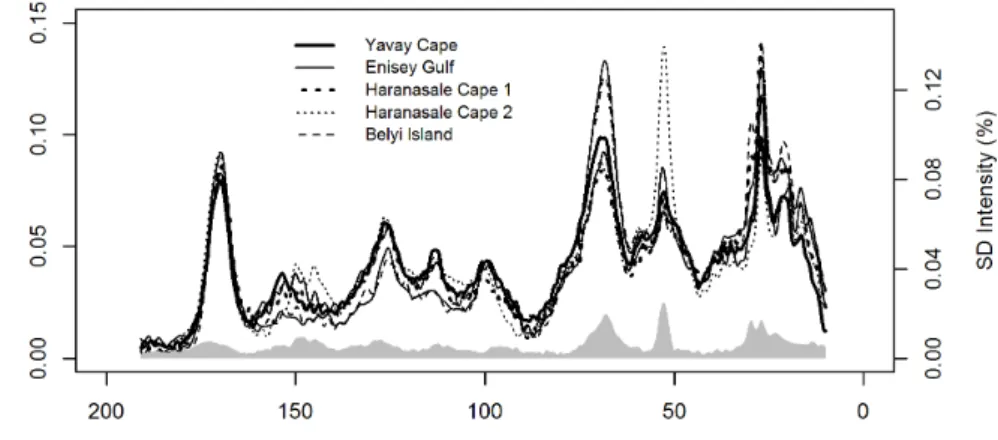
Despite this eminent homogeneity among sites, some patterns of C structural di-versity could be observed. As shown by the standard deviation of all measured13
C-10
NMR spectra (Figs. 4 and 5), the highest variability in the signal intensity was found in the resonance areas between 50–70 ppm and 32–27 ppm, both of which contain em-inently aliphatic molecules. This indicates that aromatic compounds are more stable both regionally and along soil profiles, whereas aliphatic molecules are more variable. This may be due to the fact that this fraction is considered to be more labile and
bio-15
geochemically reactive. Among the aromatic species, the highest signal was found at 170 ppm, related to carboxyl-C.
The comparison of the surface soil samples provides an idea of the regional diversity of SOM carbon structures.13C-NMR spectra (Fig. 4) show that in Enisey Gulf and Belyi Island the carbons in aromatic structres are less predominant than in the rest of sites.
20
By contrast, their signal at 70 ppm was markedly higher, indicating an increase of CH units bound to oxygen. On the other hand, the Haranasale-1 site presents a distinctive signature, consisting in a high methoxyl C peak at 55 ppm. Finally, in the region be-tween 0 to 50 ppm, indicating alkyl carbon structures, are higher in Enisey Gulf, Belyi Island and Haranasale-2 sites.
25
SED
7, 3021–3052, 2015Arctic soils of Western Siberia
E. Ejarque and E. Abakumov
Title Page
Abstract Introduction
Conclusions References
Tables Figures
◭ ◮
◭ ◮
Back Close
Full Screen / Esc
Printer-friendly Version Interactive Discussion
Discussion
P
a
per
|
Discussion
P
a
per
|
Discussion
P
a
per
|
Discussion
P
a
per
|
and hence, may indicate a low humification degree due to the low temperatures. How-ever, some variation could be observed in the aliphatic regions. Interestingly, every site presented different patterns. In Haranasale-1 site, the subsurface soil layer exhibited a higher signal intensity at the O-alkyl C peak at 70 ppm, whereas such signal remained constant at Haranasale-2, and increased in Enisey Gulf. On the other hand, the signal
5
at the methoxyl C peak (55 ppm) remained eminently constant in Haranasale-1 and Enisey Gulf, whereas in Haranasale 2 there was a clear decrease in depth. Finally, in the region of 0–50 ppm, the signal at the surface and subsurface layers remained sta-ble in the three sites. However, in Haranasale-2 site, where a third depth was sampled (20–30 cm), it can be seen that in this mineral layer there was an increase of the signal
10
intensity, indicating a higher prevalence of simple carbon bonds.
3.4 Total mineralisable carbon
The total carbon content of soils was found to be positively correlated with the total min-eralisable carbon, explaining nearly 58 % of its variability (r2=0.576, p value=0.01, df =8, F =10.86). Accordingly, the highest mineralization rates were found in Yavay
15
Cape (2.34 mg C g soil−1day−1) and in Enisey Gulf (2.32 and 2.19 mg C g soil−1day−1 at 0–5 and 5–9 cm, respectively; Table 1). Among the surface soil samples, the minimal biodegradability was found in Belyi Island (1.57 mg C g soil−1
day−1
). In the three sites were different depths were measured, located at Enisey Gulf and Haranasale Cape, the mineralization rates decreased with depth, and were minimal in the mineral deep
20
horizon (20–30 cm) of the Hystic Gleysol in Harnasale (0.58 mg C g soil−1
day−1
). In order to better understand the relationship between SOM biodegradability and its chemical quality, a multivariate linear regression analysis was performed, introducing the variables related to bulk SOM properties (total carbon content, pH, E4/E6 ratio), as well as those related specifically with the humic acids (elemental composition and
25
SED
7, 3021–3052, 2015Arctic soils of Western Siberia
E. Ejarque and E. Abakumov
Title Page
Abstract Introduction
Conclusions References
Tables Figures
◭ ◮
◭ ◮
Back Close
Full Screen / Esc
Printer-friendly Version Interactive Discussion
Discussion
P
a
per
|
Discussion
P
a
per
|
Discussion
P
a
per
|
Discussion
P
a
per
|
predictability provided by the univariate linear regression with total carbon content (the inclusion of new variables to the model increased the Cp).
These results emphasize that the biodegradability of SOM is not controlled by the characteristics of humic acids, most probably due to a high labile character in all sites. This is in accordance with findings that SOM biodegradability in Cryosols is mainly
lim-5
ited by environmental conditions (freezing and overmoisture) rather than by chemical conditions (Weintraub and Schimel, 2003).
3.5 Multivariate analysis of soil organic matter properties
An NMDS analysis provided further insight about the spatial distribution of the C struc-tural diversity of humic acids in the Yamal region, and its relationship with its elemental
10
composition and bulk SOM properties. An NMDS analysis (fit-basedR2=0.999, Non-metric fitR2=1, Fig. 6) performed on the13C-NMR groups, showed that a first axis of variation defined a gradient from aromatic (Haranasale-2 and Gyda Yurivey Gulf sites) to aliphatic carbon predominance (Belyi Island, Enisey Gulf and Haranasale-1 sites). An additional vector fitting analysis (variables significant atp <0.01) onto the NMDS
15
ordination, revealed that the secondary axis created an oxygenation gradient between C % and H % on the positive site (r2=7473, p <0.01 and r2=0.7717, p <0.01, respectively), and O % and O/C % on the negative site (r2=0.8135, p <0.01 and
r2=0.7783,p <0.01, respectively). According to that, the humic acids of Yavay Cape, and upper layers of Enisey Gulf and Haranasale-2 are related to low levels of
oxy-20
genation, whereas those of Haranasale-1 and deep layer of Haranasale-2 appear with higher levels of oxygenation. Furthermore, the positive secondary axis grouped sites with higher pH (r2=0.6074, p <0.05) and total mineralisable carbon (r2=0.6655,
p <0.05). Interestingly, the N elemental composition and C/N ratio of humic acids
where not significantly correlated within the NMDS ordination. Similarly, the optical
25
SED
7, 3021–3052, 2015Arctic soils of Western Siberia
E. Ejarque and E. Abakumov
Title Page
Abstract Introduction
Conclusions References
Tables Figures
◭ ◮
◭ ◮
Back Close
Full Screen / Esc
Printer-friendly Version Interactive Discussion
Discussion
P
a
per
|
Discussion
P
a
per
|
Discussion
P
a
per
|
Discussion
P
a
per
|
4 Conclusions
This study presents, for the first time, a detailed characterization of the humic acids of soils from western Siberia. Moreover, it expands the regional coverage of recent local scale studies of SOM lability in permafrost soils in periglacial environments (Dutta et al., 2006; Weintraub and Schimel, 2003). This may contribute to better depict the regional
5
variability of humic acids characteristics across the arctic region.
Our results revealed little spatial variability in the characteristics of soil organic matter and humic acids across the Yamal region. This reflects a homogeneity of the climatic conditions, as well as of the precursor materials, due to a homogeneous vegetation cover across the studied region. This is in line with previous studies which have
iden-10
tified temperature, water regime and vegetation as the main drivers of humification (Zech et al., 1997). Also, there was little differentiation along soil profiles. The predomi-nance of aliphatic carbon structures in depth indicates that soils remain at early stages of the humification process. This phenomenon has also been observed in other polar areas due to the effects of permafrost, were the low temperatures hinder the microbial
15
processes responsible for the humification and decomposition of the precursor organic materials.
Our results also showed that the bioavailability of soil organic matter is mainly related to the total quantity of organic carbon, but not so much to its quality (i.e. elemental com-position and carbon chemical structure). This reveals that most of the stored carbon is
20
highly labile, and therefore the limitation for bacterial utilization is not its quality but its quantity. These results further emphasize the potential sensitivity of these soils to-wards increasing climatic temperatures, and the rapid mineralization of organic matter that they may undergo.
Overall, we conclude that soils of western Siberia may play a key role in the global
25
SED
7, 3021–3052, 2015Arctic soils of Western Siberia
E. Ejarque and E. Abakumov
Title Page
Abstract Introduction
Conclusions References
Tables Figures
◭ ◮
◭ ◮
Back Close
Full Screen / Esc
Printer-friendly Version Interactive Discussion
Discussion
P
a
per
|
Discussion
P
a
per
|
Discussion
P
a
per
|
Discussion
P
a
per
|
Acknowledgements. This study was supported by Russian president grant for Young Doctors of Science “Complex investigation of soil diversity and ecological functions of Northern part of Western Siberia on example of of Yamal and Gydan peninsula”, No. MD 3615–2015-4. Sci-entific research was performed at the Center for Magnetic Resonance and at the Center for Chemical Analysis and Materials Research of Research park of St. Petersburg State University.
5
E. Ejarque benefited from the scholarship Erasmus Mundus Action 2 programme – ERANET-PLUS, financed by the European Commission. The great acknowledgments are made to Yamal region government for logistic support of the expedition “KAEMB Arctic Yamal 2013”.
We would like to dedicate this work to the memory of Petr Reihet and Vladimir Vanuito who died on 14 September 2013 during the expedition “KAEMB Arctic Yamal 2013”.
10
References
Abakumov, E. V. and Fattakhova, Y. M.: Characterization of humic substances of orhnitogenic soils of Antracrtica by 13-NMR spectroscopy, Russ. Ortnithological J., 24, 2463–2466, 2015. Abakumov, E., Lodygin, E. D., and Tomashunas, V.: Characterisation of Humic Substances
Isolated from Soils of Arctic and Antarctic by 13-C NMR spectroscopy, in: 17th IHSS
Confer-15
ence, Ioannina, Greece, 1–4 September 2014, 1–2, 2014.
Anderson, J. P. E.: Soil respiration, in: Methods of Soil Analysis, edited by: Page, A. L., Miller, R. H., and Keeney, D. R., Soil Sci. Soc. Am., Madison, 831–871, 1982.
Bockheim, J. G. and Tarnocai, C.: Recognition of cryoturbation for classifying permafrost-affected soils, Geoderma, 81, 281–293, doi:10.1016/S0016-7061(97)00115-8, 1998.
20
Buchkina, N. P., Zuyev, V. S., and Balashov, E. V.: Effects of tracked vehicles on the morpholog-ical and physmorpholog-ical properties of tundra soils, Soil Till. Res., 48, 317–324, doi:10.1016/S0167-1987(98)00158-5, 1998.
Calace, N., Campanella, L., De Paolis, F., and Petronio, B. M.: Characterization of Humic Acids Isolated from Antarctic Soils, Int. J. Environ. An. Ch., 60, 71–78,
25
doi:10.1080/03067319508027229, 1995.
SED
7, 3021–3052, 2015Arctic soils of Western Siberia
E. Ejarque and E. Abakumov
Title Page
Abstract Introduction
Conclusions References
Tables Figures
◭ ◮
◭ ◮
Back Close
Full Screen / Esc
Printer-friendly Version Interactive Discussion
Discussion
P
a
per
|
Discussion
P
a
per
|
Discussion
P
a
per
|
Discussion
P
a
per
|
Chen, Y., Senesi, N., and Schnitzer, M.: Information provided on humic substances by E4/E6 ratios, Soil Sci. Soc. Am. J., 41, 352–358, 1977.
Christensen, T. R., Jonasson, S., Callaghan, T. V., and Havström, M.: On the potential CO2 release from tundra soils in a changing climate, Appl. Soil Ecol., 11, 127–134, doi:10.1016/S0929-1393(98)00146-2, 1999.
5
Chukov, S. N., Abakumov, E. V., and Tomashunas, V. M.: Characterisation of humic acids iso-lated from Antarctic soils by 13C-NMR spectroscopy, Eurasian Soil Sci., 11, in press, 2015. Dai, X. Y., Ping, C. L., Candler, R., Haumaier, L., and Zech, W.: Characterization of soil organic
matter fractions of tundra soils in arctic Alaska by carbon-13 nuclear magnetic resonance spectroscopy, Soil Sci. Soc. Am. J., 65, 87–93, doi:10.2136/sssaj2001.65187x, 2001.
10
Davidson, E. A. and Janssens, I. A.: Temperature sensitivity of soil carbon decomposition and feedbacks to climate change, Nature, 440, 165–173, doi:10.1038/nature04514, 2006. Desyatkin, R. V. and Desyatkin, A. R.: Thermokarst Transformation of Soil Cover on
Cry-olithozone Flat Territories, edited by: Hatano, R. and Guggenberger, G., Hokkaido University Press, Sapporo, Japan, 213–224, 2006.
15
Dutta, K., Schuur, E. A. G., Neff, J. C., and Zimov, S. A.: Potential carbon release from permafrost soils of Northeastern Siberia, Glob. Change Biol., 12, 2336–2351, doi:10.1111/j.1365-2486.2006.01259.x, 2006.
Dziadowiec, H., Gonet, S., and Plichta, W.: Properties of humic acids of Arctic tundra soils in Spitsbergen, Pol. Polar Res., 15, 71–81, 1994.
20
Food and Agriculture Organisation: World Reference Base for Soil Resources, Food and Agri-culture Organisation of the United Nations, Rome, Italy, 2014.
Forbes, B. C., Stammler, F., Kumpula, T., Meschtyb, N., Pajunen, A., and Kaarlejärvi, E.: High resilience in the Yamal-Nenets social-ecological system, West Siberian Arctic, Russia, P. Natl. Acad. Sci. USA, 106, 22041–22048, doi:10.1073/pnas.0908286106, 2009.
25
Gruber, N., Friedlingstein, P., Field, C. B., Valentini, R., Heimann, M., Richey, J. E., Lankao, P. R., Schulze, E.-D., and Chen, C.-T. A.: The vulnerability of the carbon cycle in the 21st century: an assessment of carbon–climate–human interactions, in: The Global Car-bon Cycle: Integrating Humans, Climate, and the Natural World, edited by: Field, C. and Raupach, M. R., Island Press, Washington D. C., USA, 45–76, 2004.
30
SED
7, 3021–3052, 2015Arctic soils of Western Siberia
E. Ejarque and E. Abakumov
Title Page
Abstract Introduction
Conclusions References
Tables Figures
◭ ◮
◭ ◮
Back Close
Full Screen / Esc
Printer-friendly Version Interactive Discussion
Discussion
P
a
per
|
Discussion
P
a
per
|
Discussion
P
a
per
|
Discussion
P
a
per
|
Hugelius, G., Routh, J., Kuhry, P., and Crill, P.: Mapping the degree of decomposition and thaw remobilization potential of soil organic matter in discontinuous permafrost terrain, J. Geo-phys. Res.-Biogeo., 117, G02030, doi:10.1029/2011JG001873, 2012.
Hugelius, G., Strauss, J., Zubrzycki, S., Harden, J. W., Schuur, E. A. G., Ping, C. L., Schirrmeis-ter, L., Grosse, G., Michaelson, G. J., Koven, C. D., O’Donnell, J. A., Elberling, B., Mishra, U.,
5
Camill, P., Yu, Z., Palmtag, J., and Kuhry, P.: Improved estimates show large circumpolar stocks of permafrost carbon while quantifying substantial uncertainty ranges and identifying remaining data gaps, Biogeosciences Discuss., 11, 4771–4822, doi:10.5194/bgd-11-4771-2014, 2014.
Ikeya, K. and Watanabe, A.: Direct expression of an index for the degree of
humifica-10
tion of humic acids using organic carbon concentration, Soil Sci. Plant Nutr., 49, 47–53, doi:10.1080/00380768.2003.10409978, 2003.
IPCC: Climate Change: The Physical Science Basis. Contribution of the Working Group I to the Fifth Assessment Report of the Intergovernmental Panel on Climate Change, edited by: Stocker, T. F., Qin, D., Plattner, G. K., Tignor, M., Allen, S. K., Boschung, J., Nauels, A., Xia,
15
Y., Bex, V., and Midgley, P. M., Cambridge University Press, New York, USA, 2013.
Ivanov, I., Alexandrovskiy, A. L., Makeev, O. A., Bulgakov, D. S., and Abakumov, E. V.: Evolu-tion of soil and soil cover. Theory and diversity of natural evoluEvolu-tion and anthropogenic soil transformation, Moscow. Geos., Russia, 1–915, 2015.
James, G., Witten, D., Hastie, T., and Tibshirani, R.: An Introduction to Statistical Learning,
20
edited by: Casella, G., Fienberg, S., and Olkin, I., Springer, New York, USA, 426 pp., 2013. Kaiser, C., Meyer, H., Biasi, C., Rusalimova, O., Barsukov, P., and Richter, A.: Conservation of
soil organic matter through cryoturbation in arctic soils in Siberia, J. Geophys. Res.-Biogeo., 112, 1–8, doi:10.1029/2006JG000258, 2007.
Khrustalev, L. N., Emelianova, L. V., and Kaurkin, V. D.: Improvement of the prediction method
25
of the expected geocryology-climatic changes in the north of West Siberia, Earth’s Cryosph., 7, 23–29, 2003.
Kogel-Knabner, I.: 13C and 15N NMR spectroscopy as a tool in soil organic matter studies, Geoderma, 80, 243–270, 1997.
Kotlyakov, V. and Khromova, T.: Land Resources of Russia – Maps of Permafrost and Ground
30
Ice, Version 1, NSIDC: National Snow and Ice Data Center, Boulder, Colorado, USA, 2002. Kuhry, P. and Vitt, D. H.: Fossil carbon/nitrogen ratios as a measure of peat decomposition,
SED
7, 3021–3052, 2015Arctic soils of Western Siberia
E. Ejarque and E. Abakumov
Title Page
Abstract Introduction
Conclusions References
Tables Figures
◭ ◮
◭ ◮
Back Close
Full Screen / Esc
Printer-friendly Version Interactive Discussion
Discussion
P
a
per
|
Discussion
P
a
per
|
Discussion
P
a
per
|
Discussion
P
a
per
|
Kumada, K.: Chemistry of Soil Organic Matter, Tokyo and Elsevier, Amsterdam, the Nether-lands, 260 pp., 1987.
Lumley, T.: Leaps: Regression subset selection, available at: http://cran.r-project.org/package= leaps (last access: 10 May 2015), 2009.
McGuire, A. D., Anderson, L. G., Christensen, T. R., Dallimore, S., Guo, L. D., Hayes, D. J.,
5
Heimann, M., Lorenson, T. D., Macdonald, R. W., and Roulet, N.: Sensitivity of the carbon cycle in the Arctic to climate change, Ecol. Monogr., 79, 523–555, doi:10.1890/08-2025.1, 2009.
Oksanen, J., Blanchet, F. G., Kindt, R., Legendre, P., Minchin, P. R., O’Hara, R. B., Simp-son, G. L., Solymos, P., Henry, M., Stevens, H., and Wagner, H.: Vegan: Community Ecology
10
Package, available at: http://cran.r-project.org/package=vegan (last access: 15 April 2015), 2012.
Peacock, M., Evans, C. D., Fenner, N., Freeman, C., Gough, R., Jones, T. G., and Lebron, I.: UV-visible absorbance spectroscopy as a proxy for peatland dissolved organic carbon (DOC) quantity and quality: considerations on wavelength and absorbance degradation., Environ.
15
Sci. Process. Impacts, 16, 10–12, doi:10.1039/c4em00108g, 2014.
R Development Core Team: R: A language and environment for statistical computing, available at: http://www.r-project.org/, last access: 20 March 2015.
Rice, J. A. and McCarthy, P.: Statistical evaluation of the elemental composition of humic sub-stances, Org. Geochem., 17, 635–648, 1991.
20
Romanovsky, V. E., Drozdov, D. S., Oberman, N. G., Malkova, G. V., Kholodov, a. L., Marchenko, S. S., Moskalenko, N. G., Sergeev, D. O., Ukraintseva, N. G., Abramov, a. a., Gilichinsky, D. a., and Vasiliev, a. a.: Thermal state of permafrost in Russia, Permafr. Periglac. Process., 21, 136–155, doi:10.1002/ppp.683, 683 pp., 2010.
Schirrmeister, L., Grosse, G., Wetterich, S., Overduin, P. P., Strauss, J., Schuur, E. a G., and
25
Hubberten, H. W.: Fossil organic matter characteristics in permafrost deposits of the north-east Siberian Arctic, J. Geophys. Res.-Biogeo., 116, G00M02, doi:10.1029/2011JG001647, 2011.
Schnitzer, M.: Organic matter characterization, in: Methods of Soil Analysis. Part 2. Chemical and Microbiological Properties, Agronomy Monograph No. 9, edited by: Page, B., Miller, R.,
30
and Keeney, D., Soil Science Society of America, Madison, USA, 581–594, 1982.
SED
7, 3021–3052, 2015Arctic soils of Western Siberia
E. Ejarque and E. Abakumov
Title Page
Abstract Introduction
Conclusions References
Tables Figures
◭ ◮
◭ ◮
Back Close
Full Screen / Esc
Printer-friendly Version Interactive Discussion
Discussion
P
a
per
|
Discussion
P
a
per
|
Discussion
P
a
per
|
Discussion
P
a
per
|
Summers, R. S., Cornell, P. K., and Roberts, P. V.: Molecular size distribution and spectroscopic properties of aquatic humic substances, Sci. Total Environ., 62, 27–37, 1987.
Tarnocai, C., Canadell, J. G., Schuur, E. a G., Kuhry, P., Mazhitova, G., and Zimov, S.: Soil organic carbon pools in the northern circumpolar permafrost region, Global Biogeochem. Cy., 23, 1–11, doi:10.1029/2008GB003327, 2009.
5
Walkely, A.: A critical examination of a rapid method for determining organic carbon in soils-effect of variations in digestion conditions and of organic soil constituents, Soil Sci., 63, 251– 264, 1947.
Walker, D. A., Leibman, M. O., Epstein, H. E., Forbes, B. C., Bhatt, US, Raynolds, M. K., Comiso, J. C., Gubarkov, A. A., Khomutov, A. V, Jia, G. J., Kaarlejärvi, E., Kaplan, J. O.,
10
Kumpula, T., Kuss, P., Matyshak, G., Moskalenko, N. G., Orekhov, P., Romanovsky, V. E., Ukraientseva, N. G., and Yu, Q.: Spatial and temporal patterns of greenness on the Ya-mal Peninsula, Russia: interactions of ecological and social factors affecting the Arctic normalized difference vegetation index, Environ. Res. Lett., 4, 045004, doi:10.1088/1748-9326/4/4/045004, 2009.
15
Ward, C. P. and Cory, R. M.: Chemical composition of dissolved organic matter draining per-mafrost soils, Geochim. Cosmochim. Ac., 167, 63–79, doi:10.1016/j.gca.2015.07.001, 2015. Weintraub, M. N. and Schimel, J. P.: Interactions between carbon and nitrogen
mineraliza-tion and soil organic matter chemistry in arctic tundra soils, Ecosystems, 6, 129–143, doi:10.1007/s10021-002-0124-6, 2003.
20
Zaccone, C., Miano, T. M., and Shotyk, W.: Qualitative comparison between raw peat and related humic acids in an ombrotrophic bog profile, Org. Geochem., 38, 151–160, doi:10.1016/j.orggeochem.2006.06.023, 2007.
Zech, W., Senesi, N., Guggenberger, G., Kaiser, K., Lehmann, J., Miano, T. M., Miltner, A., and Schroth, G.: Factors controlling humification and mineralization of soil organic matter in the
25
tropics, Geoderma, 79, 117–161, doi:10.1016/S0016-7061(97)00040-2, 1997.
Zimov, S. A., Davydov, S. P., Zimova, G. M., Davydova, A. I., Schuur, E. A. G., Dutta, K., and Chapin, F. S.: Permafrost carbon. Stock and decomposability of a globally significant carbon pool, Geophys. Res. Lett., 33, L20502, doi:10.1029/2006GL027484, 2006.
Zubrzycki, S., Kutzbach, L., Grosse, G., Desyatkin, A., and Pfeiffer, E.-M.: Organic carbon
30
SED
7, 3021–3052, 2015Arctic soils of Western Siberia
E. Ejarque and E. Abakumov
Title Page
Abstract Introduction
Conclusions References
Tables Figures
◭ ◮
◭ ◮
Back Close
Full Screen / Esc
Printer-friendly Version Interactive Discussion
Discussion
P
a
per
|
Discussion
P
a
per
|
Discussion
P
a
per
|
Discussion
P
a
per
|
Table 1.Properties of bulk soil organic matter.
Site Soil depth Total C E465/E650 pH (CaCl2) Mineralisable C
(cm) (%) (mg C g soil−1
day−1
)
Yavay 0–5 13.7 0.400 5.47 2.341
Gyda Yuribey 0–10 27.4 0.828 3.94 2.103
Enisey Gulf 0–2 36.4 0.376 3.64 2.318
Enisey Gulf 5–9 18 0.709 4.54 2.189
Haranasale-1 0–5 7.5 0.372 3.79 0.910
Haranasale-1 5–12 6.8 0.859 3.56 0.875
Beliy Island 0–10 5.7 0.409 5.07 1.572
Haranasale-2 0–5 12.3 0.355 6.26 1.945
Haranasale-2 5–10 15.2 0.512 4.75 1.553
SED
7, 3021–3052, 2015Arctic soils of Western Siberia
E. Ejarque and E. Abakumov
Title Page
Abstract Introduction
Conclusions References
Tables Figures
◭ ◮
◭ ◮
Back Close
Full Screen / Esc
Printer-friendly Version Interactive Discussion
Discussion
P
a
per
|
Discussion
P
a
per
|
Discussion
P
a
per
|
Discussion
P
a
per
|
Table 2.Elemental composition and elemental ratios of the studied soils.
Site Soil depth (cm) N% C% H% O% C/N O/C H/C
Yavay 0–5 4.27 51.40 5.41 38.91 12.03 0.76 0.11
SED
7, 3021–3052, 2015Arctic soils of Western Siberia
E. Ejarque and E. Abakumov
Title Page
Abstract Introduction
Conclusions References
Tables Figures
◭ ◮
◭ ◮
Back Close
Full Screen / Esc
Printer-friendly Version Interactive Discussion
Discussion
P
a
per
|
Discussion
P
a
per
|
Discussion
P
a
per
|
Discussion
P
a
per
|
Table 3.13C-NMR section integrals (percent of total carbon) and key structures of soil humic
substances.
δ(13C) ppm 10–27 27–32 32–50 50–70 70–100 100–108 108–135 135–150 150–170 170–190 Site Key structures falMet f
trans al f
Q al f
OM al f
O2 al f
O1
al f
H
a faS faP f
CO2
a
SED
7, 3021–3052, 2015Arctic soils of Western Siberia
E. Ejarque and E. Abakumov
Title Page
Abstract Introduction
Conclusions References
Tables Figures
◭ ◮
◭ ◮
Back Close
Full Screen / Esc
Printer-friendly Version Interactive Discussion
Discussion
P
a
per
|
Discussion
P
a
per
|
Discussion
P
a
per
|
Discussion
P
a
per
|
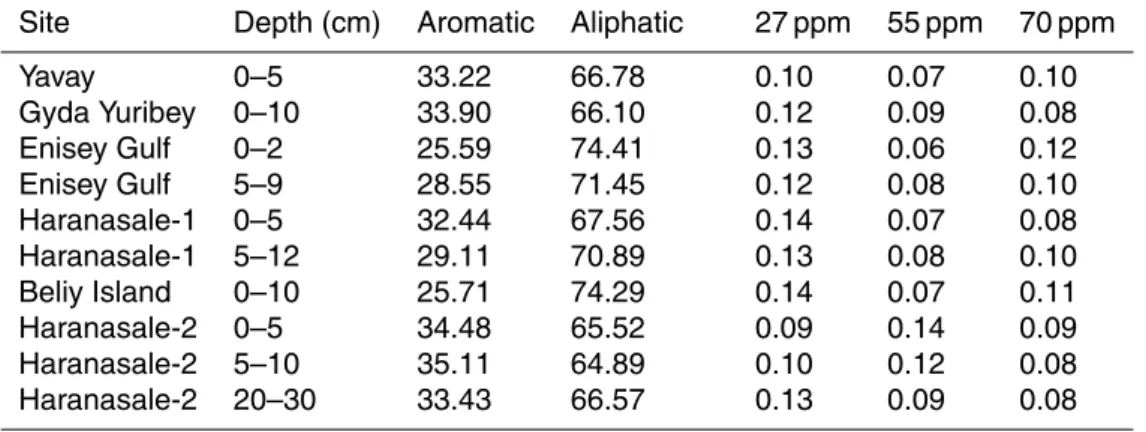
Table 4.Fraction of aromatic and aliphatic carbons, and maximal signal intensity at the three
ppm of maximal variability within the data set.
Site Depth (cm) Aromatic Aliphatic 27 ppm 55 ppm 70 ppm
Yavay 0–5 33.22 66.78 0.10 0.07 0.10
Gyda Yuribey 0–10 33.90 66.10 0.12 0.09 0.08
Enisey Gulf 0–2 25.59 74.41 0.13 0.06 0.12
Enisey Gulf 5–9 28.55 71.45 0.12 0.08 0.10
Haranasale-1 0–5 32.44 67.56 0.14 0.07 0.08
Haranasale-1 5–12 29.11 70.89 0.13 0.08 0.10
Beliy Island 0–10 25.71 74.29 0.14 0.07 0.11
Haranasale-2 0–5 34.48 65.52 0.09 0.14 0.09
Haranasale-2 5–10 35.11 64.89 0.10 0.12 0.08
SED
7, 3021–3052, 2015Arctic soils of Western Siberia
E. Ejarque and E. Abakumov
Title Page
Abstract Introduction
Conclusions References
Tables Figures
◭ ◮
◭ ◮
Back Close
Full Screen / Esc
Printer-friendly Version Interactive Discussion
Discussion
P
a
per
|
Discussion
P
a
per
|
Discussion
P
a
per
|
Discussion
P
a
per
|
Figure 1.Regional distribution of study sites in the Gydan peninsula. 1 – Haranasale cape,
SED
7, 3021–3052, 2015Arctic soils of Western Siberia
E. Ejarque and E. Abakumov
Title Page
Abstract Introduction
Conclusions References
Tables Figures
◭ ◮
◭ ◮
Back Close
Full Screen / Esc
Printer-friendly Version Interactive Discussion
Discussion
P
a
per
|
Discussion
P
a
per
|
Discussion
P
a
per
|
Discussion
P
a
per
|
Figure 2.Examples of soils and environments analized in this study. Yavay 1 (aandb), Gyda
SED
7, 3021–3052, 2015Arctic soils of Western Siberia
E. Ejarque and E. Abakumov
Title Page
Abstract Introduction
Conclusions References
Tables Figures
◭ ◮
◭ ◮
Back Close
Full Screen / Esc
Printer-friendly Version Interactive Discussion
Discussion
P
a
per
|
Discussion
P
a
per
|
Discussion
P
a
per
|
Discussion
P
a
per
|
Figure 4.13C-NMR spectra of surface soil samples. For reference, the gray spectra
SED
7, 3021–3052, 2015Arctic soils of Western Siberia
E. Ejarque and E. Abakumov
Title Page
Abstract Introduction
Conclusions References
Tables Figures
◭ ◮
◭ ◮
Back Close
Full Screen / Esc
Printer-friendly Version Interactive Discussion
Discussion
P
a
per
|
Discussion
P
a
per
|
Discussion
P
a
per
|
Discussion
P
a
per
|
Figure 5.13C-NMR spectra in soil profiles. For reference, the gray spectra corresponds to the
SED
7, 3021–3052, 2015Arctic soils of Western Siberia
E. Ejarque and E. Abakumov
Title Page
Abstract Introduction
Conclusions References
Tables Figures
◭ ◮
◭ ◮
Back Close
Full Screen / Esc
Printer-friendly Version Interactive Discussion
Discussion
P
a
per
|
Discussion
P
a
per
|
Discussion
P
a
per
|
Discussion
P
a
per
|
Figure 6. Non-metric multidimensional scaling analysis of humic acids based on their