ISSN 1553-619X
© 2006 Science Publications
Corresponding Author: Kazunori Nakase, MD PhD, The Department of Medical Oncology, Mie University School of Medicine, 2-174 Edobashi, Tsu, Mie 514-8507, Japan, Tel: +81-59-232-1111, Fax: +81-59-231-5200
Age Difference in Immunophenotype of Acute Leukemia
1,2Kazunori Nakase, 1Mary Sartor and 1Kenneth Bradstock
1The Department of Hematology, Westmead Hospital, Westmead, New South Wales, Australia 2The Department of Medical Oncology, Mie University School of Medicine, Tsu, Mie, Japan
Abstract: We examined the immunophenotype of 880 cases with acute leukemia and analyzed their age difference in relation to the morphological subtype and the karyotype. We divided the patients into 3 age groups: child (0-15 years), adult (16-59 years) and elderly (60 years and older) group. The diagnoses based on the French-American-British (FAB) criteria and the immunophenotype as follows: 453 patients as acute myeloid leukemia (AML), 366 as precursor B-cell acute lymphoblastic leukemia (ALL) (24 CD10- cases and 342 CD10+ cases), 10 B-cell ALL and 51 T-cell ALL. In AML, there were no significant age differences in the frequency of FAB subtypes. Karyotypically, the frequencies of t(8;21) and 11q23 decreased with age and that of 5/7/8 abnormality increased with age. As for the immunophenotype in each FAB subtype, CD11b in M2 (0%) and CD34 in M3 (0%) were less commonly expressed in the child group than in the other age groups. Whereas Both CD11b (100%) and CD34 (60%) in M4 were more predominantly expressed in the child group than in the other age groups. Lymphoid antigen, CD19 showed a higher frequency (38.5%) in the child M2 than did other age M2 groups, reflecting the distribution pattern of t(8;21) among the 3 age groups. Additionally, the child group more frequently expressed this antigen (33.3%) than the older groups among CD7+ AML. In ALL, the frequency of CD10+ precursor B ALL was more common in the child group (84%) than in the adult group. On the other hand, B-cell ALL showed a lower frequency (0.7%) in the child group and T-cell ALL did a higher frequency (18.3%) in the adult group than any other age groups, respectively. Although the frequency of t(9;22) increased with age in CD10+ precursor-B ALL, myeloid antigen (CD13/CD33) expression evenly distributed among the 3 age groups. Our results suggest that phenotypic heterogeneity gradually emerged with age irrespective of the pattern of karyotype.
Key words: Age difference, immunophenotype, acute leukemia
INTRODUCTION
Acute leukemia is known to be a heterogenous disease with diverse morphologic, cytogenetic and clinical characteristics[1,2]. It is well accepted that there are significant differences in these features of acute leukemia between pediatric and adult cases[3,4]. The incidence of acute lymphoblastic leukemia (ALL) is much more common in children than in adults, whereas that of acute myeloid leukemia (AML) is more often in adults than in children. In ALL, chromosomal translocation (4;11) is more frequently in pediatric cases than in adult ones[5]. On the other hand, the incidence of t(9;22) (Philadelphia chromosome, Ph) increases with patient age[6]. A hematopoietic stem cell or a bone marrow (BM) microenvironment appears to vary significantly with aging[7,8] and those changes may possibly influence the nature of leukemia cells. Therefore, comparative studies for age differences in the features of leukemia cells could be expected to provide a clue to clarify the pathogenesis of acute leukemia. Immunophenotyping has offered an objective
analysis of various differentiation antigen expression on the surface of leukemia cells and such immunophenotype is recognized as one of important biological natures of these leukemias[9-11]. However, little data are available about the differences in the phenotypic characteristics of acute leukemia cells according to the age of patients[12-14]. This may due to that pediatric and adult cases are separately treated by each physician and investigator, respectively and collaboration is restricted among them. In this study, we assessed 880 cases of acute leukemia (age range; 0-95 years) which have undergone immunophenotyping in a single laboratory to investigate the phenotypic differences among the patient age groups (child group; 0-15 years, adult group; 16-59 years and elderly group; 60 years and older) in relation to the morphological subtypes and the karyotypes.
MATERIALS AND METHODS
Patients were those referred to leukemia treatment units at eight large regional or tertiary referral hospitals in the Sydney Metropolitan or Newcastle areas in Australia. Diagnostic samples were referred for immunophenotyping studies at the Hematology Department at Westmead Hospital. Hematological diagnosis was made according to the French-American-British (FAB) criteria and immunophenotypes. The patients were classified as follows: 453 patients as AML, 366 as precursor B-cell ALL (24 DR+CD19+CD10- ALL and 342 HLA-DR+CD19+CD10+ ALL), 10 B-cell [surface immunoglobulin (sIg)+] ALL and 51 T-cell (CD7+) ALL. According to the age, we divided the patients into 3 age groups: child group (0-15 years, 367 cases), adult group (16-59 years, 351 cases) and elderly group (60 years and older, 162 cases) and compared the immunophenotypes in each subtype of acute leukemia cases among the patient age groups.
Immunophenotyping: Mononuclear cells (MNC) were separated from heparinized peripheral blood (PB) or BM by centrifugation on Ficoll-Isopaque (Pharmacia, Uppsala, Sweden). Before immunostaining, MNC were treated with heat-aggregated human AB serum to prevent non-specific binding of monoclonal antibodies (MoAbs) through Fc receptors. Cell surface antigens were detected by a standard indirect immunofluorescence method, as previously described[15], using a panel of MoAbs as follows: CD11b (WM20), CD13 (WM15), CD14 (FMC33), CD33(WM53) and CD41(WM18) as myeloid markers; CD2 (WM57) and CD7 (WM31) as T-cell markers; CD10 (WM21) and CD19 (FMC63) as B-cell markers; and HLA-DR (WM2) and CD34 (HPCA1) as stem cell markers. Sheep anti-mouse immunoglobulin (Ig) fluorescein-conjugates (SAM-FITC) was used as a second reagent. As negative controls, mouse IgG1 (WMD10), IgG2a (WMD6) and IgG2b (WMD7) were used. MoAbs of the WM series were produced in authors’ laboratory; FMC series, Dr. H.Zola, Flinders Medical Center, Adelaide; HPCA1 from Becton Dickinson (Mountain View, CA); SAM-FITC from Silenus (Melbourne, Australia). Samples were examined by flow cytometry using a Coulter Epics Profile cytometer (Coulter Cytometry, Hialeah, FL). Results were recorded on blast-gated populations. Positivity for each MoAb was uniformly defined as 20% or more of cells positive above the negative control.
Karyotype analysis: Karyotype analysis of bone marrow cells was performed at diagnosis on short term (usually 24 h) BM cultures. Metaphase chromosomes were banded by the conventional Giemsa banding technique and karyotyped according to the International System for Human Cytogenetic Nomenclature (ISCN)(1985).
Table 1: Distribution of FAB subtypes according age in AML
FAB subtype <16 16-59 59<
M 0 4 (6.0) 10(4.0) 8(5.8) M 1 11(16.4) 45(18.2) 32(23.0) M 2 15(22.4) 57(23.1) 31(22.3) M 3 11(16.4) 29(11.7) 12(8.6) M 4 12(17.9) 70(28.3) 26(18.7) M 5 12(17.9) 25(10.1) 18(12.9) M 6 1(1.5) 7(2.8) 9(6.5) M 7 1(1.5) 4(1.6) 3(2.2)
Total 67 247 139
Age (years)
Values are number of cases (%)
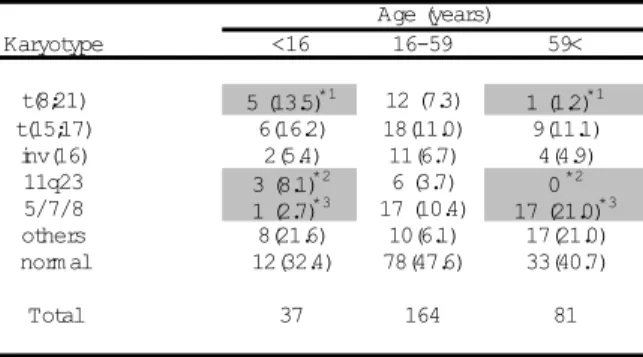
Table 2: Distribution of karyotypes according to age in AML
Karyotype <16 16-59 59<
t(8;21) 5 (13.5)*1 12 (7.3) 1 (1.2)*1
t(15;17) 6(16.2) 18(11.0) 9(11.1) inv(16) 2(5.4) 11(6.7) 4(4.9)
11q23 3 (8.1)*2 6 (3.7) 0 *2 5/7/8 1 (2.7)*3 17 (10.4) 17 (21.0)*3 others 8(21.6) 10(6.1) 17(21.0) norm al 12(32.4) 78(47.6) 33(40.7)
Total 37 164 81
Age (years)
Values are number of cases (%), *1, *2;p<.01, *3; p<.05
Table 3: Incidence of t(8;21) in M2 and of t(15;17) in M3
<16 16-59 59<
t(8;21) in M 2 4/7(57.1)*1*2
8/42(19.0)*1 1/17(5.9)*2 t(15;17) in M 3 6/7(85.7) 16/23(69.6) 9/9(100)
Age (years)
*1; p<.05, *2; p<.01
We examined the expression of following karyotypic abnormalities; t(8;21)(q22;q22) shown as t(8;21), t(15;17)(q22;q11) as t(15;17), inv/del(16)(q22) as inv(16), t/del(11)(q23) as 11q23, -5 or 5q-/-7 or 7q-/8+ as 5/7/8 and the other abnormalities.
Statistical analysis: Differences in the two groups were evaluated by chi-squared test. The statistical analyses were performed by STATISTICA software (Statsoft, Tulsa, OK). The significance level was set at p < .05.
RESULTS AND DISCUSSION
Table 4: Incidence of 5/7/8 abnormality in each FAB subtype according to age
Karyotype Age (years) M 1 M 2 M 3 M 4 M 5 M 6
5/7/8 <16 0/6 0/7*1 0/7 1/6(16.7) 0/7 ND
16-59 4/25(16) 6/42(14.3) 0/23 4/50(8.0) 3/14(21.4) 0/3
59< 4/20(20) 7/17(41.2)*1 0/9 2/13(15.4) 3/12(25) 0/1 FAB subtype
*1;p<.05
Table 5: Expression of myelomonocytic antigens and stem cell antigens in each FAB subtype according to age in AML
M arker Age (years) M 0 M 1 M 2 M 3 M 4 M 5 M 6 M 7
CD11b <16 ND 3/4(75) 0/6*1 2/6(33.3) 7/7(100)*2 4/4(100) 0/1 ND
16-59 3/4(75) 7/23(30.4) 14/32(43.8)*1 1/15(6.7) 27/41(65.9) 11/15(73.3) 3/4(75) 2/2(100)
59< 1/3(33.3) 7/13(53.8) 7/20(35) 1/6(16.7) 7/12(58.3)*2 7/9(77.8) 2/6(33.3) 1/1(100) CD13 <16 2/4(50) 8/10(80) 12/13(92.3) 9/10(90) 8/10(80) 4/8(50) 1/1(100) 0/1
16-59 5/8(62.5) 25/32(78.1) 37/46(80.4) 21/22(95.5) 44/56(78.6) 9/19(47.4) 5/6(83.3) 2/3(66.7) 59< 6/8(75) 21/24(87.5) 22/28(78.6) 6/8(75) 14/17(82.4) 11/15(73.3) 5/8(62.5) 2/2(100) CD14 <16 ND 1/6(16.7) 0/8 0/4 2/5(40) 2/7(28.6) 0/1 ND
16-59 0/3 2/28(7.1) 0/34 0/17 7/46(15.2) 5/13(38.5) 1/4(25) 0/3 59< 0/6 0/15 0/19 0/17 1/14(7.1) 7/10(70) 0/5 0/1 CD33 <16 3/4(75) 10/10(100) 11/13(84.6) 9/10(90) 7/9(77.8) 9/9(100) 1/1(100) 0/1
16-59 7/9(77.8) 28/33(84.8) 37/47(78.7) 22/23(95.7) 47/55(85.5) 16/18(88.9) 2/6(33.3) 2/3(66.7) 59< 4/8(50) 19/24(79.2) 20/27(74.1) 8/8(100) 13/17(76.5) 10/15(66.7) 4/8(50) 0/2 CD34 <16 4/4(100) 9/10(90) 8/13(61.5) 0/8*3 6/10(60)*4 3/9(33.3) 0/1 0/1
16-59 4/6(66.7) 21/30(70) 28/42(66.7) 7/22(31.8) 31/151(20.5)*4*5 6/14(32.9) 3/6(50) 0/3
59< 5/7(71.4) 12/20(60) 16/24(66.7) 4/8(50)*3 7/15(46.7)*5 6/12(50) 3/7(42.9) 0/1 HLA-DR <16 2/4(50) 9/10(90) 12/13(92.3) 4/10(40) 10/10(100) 9/9(100) 1/1(100) 0/1
16-59 8/8(100) 31/33(93.9) 39/45(86.7) 5/22(22.7) 51/56(91.1) 16/19(84.2) 4/6(66.7) 1/3(33.3) 59< 8/8(100) 18/24(75) 22/28(78.6) 4/8(50) 12/16(75) 14/15(93.3) 5/8(62.5) 2/2(100)
FAB subtype
Number of positive case/number of cases examined (%), *1, *2, *3, *5;p<.05, *2;p<.01, ND: not done
Table 6: Expression of lymphoid antigens in each FAB subtypes according to age in AML
M arker Age (years) M 0 M 1 M 2 M 3 M 4 M 5 M 6 M 7
CD10 <16 0/4 0/10 0/12 1/10(10) 0/9 0/9 0/1 0/1 16-59 0/7 1/33(3.0) 0/45 0/21 1/52(1.9) 0/19 0/4 0/2 59< 0/8 0/23 3/27(11.1) 0/8 0/17 0/15 0/8 0/2 CD19 <16 1/4(25) 2/10(20) 5/13(38.5)*1*2 1/10(10) 1/10(10) 1/9(11.1) 0/1 0/1 16-59 1/8(12.5) 3/31(9.7) 2/42(4.8)*1 3/21(14.3) 2/52(3.8) 2/14(14.3) 0/5 0/2
59< 0/8 1/23(4.3) 2/23(8.7)*2 0/7 1/13(7.7) 3/12(25) 0/8 0/2 CD2 <16 0/3 0/4 1/8(12.5) 0/4 1/5(20) 1/6(16.7) 0/1 ND
16-59 1/2(50) 1/20(4.3) 2/27(7.4) 4/14(28.6) 6/40(15) 1/9(11.1) 0/5 0/2 59< 0/2 2/11(18.2) 0/19 1/14(7.1) 0/8 0/6 0/6 ND CD7 <16 2/4(50) 4/10(40) 2/13(15.4) 1/9(11.1) 1/8(12.5) 2/7(28.6) 0/1 0/1
16-59 2/7(28.6) 10/29(34.5) 7/42(16.7) 1/20(5) 11/53(20.8) 3/18(16.7) 1/6(16.7) 0/2 59< 1/7(14.3) 3/20(15) 6/26(23.1) 1/8(12.5) 1/15(6.7) 0/13 2/8(25) 1/2(50)
FAB subtype
Number of positive case/number of cases examined (%), *1;p<.01, *2;p<.05, ND: not done
The most frequent FAB subtype was different in each age group: M2 (15 of 67 cases, 22.4%) in the child group, M4 (70 of 247 cases, 28.3%) in the adult group and M1 (32 of 139 cases, 23.0%) in the elderly group, respectively. However, the age differences in the frequency of FAB subtypes were not statistically significant.
Distribution of karyotypes according to the age is indicated in Table 2. The frequency of t(8;21) declined with increasing patient age and that of t(8;21) in the child group (5 of 37 cases, 13.5%) was significantly
Table 7: Immunophenotypes in each karyotype according to age in AML
M arker Age(years) t(8;21) t(15;17) 5/7/8
CD13 <16 3/4(75) 5/5(100) ND
16-59 5/9(55.6) 13/13(100) 10/15(66.7) 59< 0/1 3/5(60) 12/14(85.7)
CD33 <16 3/4(75) 4/5(80) ND
16-59 5/9(55.6) 14/14(100) 14/15(93.3) 59< 0/1 5/5(100) 9/14(64.3)
CD34 <16 3/4(75) 0/5 ND
16-59 6/8(75) 5/14(35.7) 9/14(64.3) 59< 1/1(100) 1/5(20) 10/12(83.3)
HLA-DR <16 4/4(100) 1/5(20) ND
16-59 9/9(100) 3/13(23.1) 15/15(100) 59< 1/1(100) 2/5(40) 13/14(92.9)
CD19 <16 4/4(100) 0/5 ND
16-59 3/6(50) 1/14(7.1) 1/14(7.1) 59< 1/1(100) 0/5 1/13(7.7)
CD7 <16 0/4 1/5(20) ND
16-59 0/9 2/12(16.7) 3/13(23.1)
59< 0/1 1/5(20) 3/11(27.3)
CD2 <16 0/4 0/3 ND
16-59 0/4 4/9(44.4) 0/8
59< ND 1/3(33.3) 1/8(12.5)
Number of positive case/number of cases examined ND: not done
patient age and 5/7/8 in the elderly group (17 of 81 cases, 21.0%) was significantly more prominent than that in the child group (1 of 37 cases, 2.7%)(p<.05). Among the FAB subtypes, this difference was observed only in M2 [0 of 7 cases in the child group vs. 7 of 17 cases in the elderly group (41.2%), p<.05] (Table 4). The other karyotypes [t(15;17), inv(16), other abnormalities and normal karyotype] occurred in each age group with approximately similar frequency.
Expression of myelomonocytic (CD11b, CD13, CD14 and CD33) and stem cell (CD34 and HLA-DR) markers in each FAB subtype according to the age is shown in Table 5. Among these markers, the frequency of CD11b in M2 and M4 and that of CD34 in M3 and M4 varied with patient age. CD11b in M2 was more common in the adult group (14 of 32 cases, 43.8%) than in the child group (0 of 6 cases)(p<.05), whereas CD11b in M4 was found more often in the child group (7 of 7 cases, 100%) than in the elderly group (7 of 12 cases, 58.3%)(p<.05). On the other hand, the frequency of CD34 in M3 ascended with increasing patient age and this was observed at a significantly higher rate in the elderly group (4 of 8 cases, 50%) than in the child group (0 of 8 cases)(p<.05). Whereas CD34 in M4 was less common in the adult group (31 of 151 cases, 20.5%) than in the child group (6 of 10 cases, 60%)(p<.01) and in the elderly group (7 of 15 cases, 46.7%)(p<.05), respectively.
Expression of lymphoid markers (CD10, CD19, CD2 and CD7) in each FAB subtype according to the age is indicated in Table 6. Among these markers, the frequency of CD19 in M2 was exclusively altered with patient age. CD19 in M2 in the child group (5 of 13 cases, 38.5%) was significantly more prominent than that in the adult group (2 of 42 cases, 4.8%)(p<.01) and that in the elderly group (2 of 23 cases, 8.7%)(p<.05), respectively.
Immunophenotypes (CD13, CD33, CD34, HLA-DR, CD19, CD7 and CD2 expression) in each karyotype [t(8;21), t(15;17) and 5/7/8] according to the age is shown in Table 7. The differences in the frequencies of such marker expression in each karyotype were not statistically significant among the 3 age groups. Since CD7+ AML is known as an immature subset of AML, we analyzed whether immunophenotypes of such AML cases differ among the age groups (Table 8). Only CD19 expression occurred more frequently in the child group (4 of 12 cases, 33.3%) than in the adult group (1 of 30 cases, 3.3%)(p<.01).
Immunophenotypes of ALL: Distribution of immunological ALL subtypes according to the age is indicated in Table 9. The numbers of the cases from child group (0-15 years), adult group (16-59 years) and elderly group (60 years and older) were 300, 104 and 23, respectively. The frequency of CD10 precursor B-cell ALL cases showed no statistically significant differences among the 3 age groups. On the other hand, CD10+ precursor B-cell ALL cases occurred significantly more common in the child group (252 of 300 cases, 84%) than in the adult group (70 of 104 cases, 67.3%)(p<.01). The frequencies of B-cell ALL and T-cell ALL cases changed with patient age. B-cell ALL in the child group (2 of 300 cases, 0.7%) was less commonly seen than that in the adult group (6 of 104 cases, 5.8%)(p<.01) and that in the elderly group (2 of 23 cases, 8.7%)(p<.01), respectively. T-cell ALL in the adult group (19 of 104 cases, 18.3%) showed a higher frequency than that in the child group (32 of 300 cases, 10.7%)(p<.05) and that in the elderly group (0 of 23 cases)(p<.05), respectively.
Myeloid antigen expression (CD13 or CD33) was more frequent in B-lineage ALL than in T-lineage ALL, but this difference was statistically significant only for CD33 expression [39 of 309 cases (12.6%) in B-lineage ALL vs. 0 of 41 cases, p<.05] (Table 10). B-lineage ALL (234 of 324 cases, 71.1%) had also more frequent stem cell marker, CD34 expression than did T-lineage ALL (9 of 40 cases, 22.5%, p<.01) (Table 10). However, the differences in the expression rate of CD13, CD33 and CD34 in each immunological subtype of ALL were not statistically significant among the 3 age groups.
The frequency of t(9;22) in CD10+ precursor B-cell ALL was less common in the child group (0 of 19 cases) than in the adult group (9 of 26 cases, 34.6%) (p<.01) and the elderly group (2 of 5 cases, 40%)(p<.01), respectively. In CD10 precursor B-cell ALL, 11q23 was more frequently seen in the child group (4 of 5 cases, 80%) than in the other age groups, but this difference was not statistically significant.
Table 8: Innunophenotypes of CD7 positive AML cells according to age
Age(years) CD11b CD13 CD33 CD34 HLA-DR CD19 CD2
<16 3/5(60) 10/12(83.3) 11/12(91.7) 6/12(50) 12/12(100) 4/12(33.3)*1 2/5(40)
16-59 8/24(33.3) 28/33(84.8) 30/33(90.9) 24/31(77.4) 30/32(93.8) 1/30(3.3)*1 5/23(21.7) 59< 3/9(33.3) 11/13(84.6) 10/13(76.9) 8/12(66.7) 14/14(100) 1/12(8.3) 2/8(25)
Number of positive case/number of cases examined (%), *1;p<.01
Table 9: Distribution of ALL subtypes according to age
Phenotype <16 16-59 59<
Precursor B-cell
CD10(-) 14(4.7) 9(8.7) 1(4.3)
CD10(+) 252(84)*1 70(67.3)*1 20(87.0) B-cell 2(0.7)*2*3 6(5.8)*2 2(8.7)*3 T-cell 32(10.7)*4 19(18.3)*4*5 0*5
Total 300 104 23
Age (years)
Values are number of cases (%), *1, *2, *3;p<.01, *4, *5<.05
subtype in AML, some investigators demonstrated different incidence rates of various FAB subtypes between children and adults[16,17]. Our results show that there were no statistically significant differences in the frequencies of FAB subtypes among the patient age groups, though the most frequent FAB subtype was different in each age group. However, in consistent with previous reports[8, 6,17], the distribution of karyotypes in AML obviously showed age differences. The frequencies of t(8;21) and 11q23 descended and that of 5/7/8 ascended with an increase of patient age, respectively. Within FAB M2 subtype, t(8;21) expression rate also became lower as the patient age increased. The age related phenotypic differences in each AML subtypes we found were the expression rate of CD11b, CD34 and CD19. Myelomonocytic marker, CD11b was less common in the children M2 (0 of 6 cases) compared to the adult M2 (14 of 32 cases, 43.8%, p<.05) and elderly M2 (7 of 20 cases, 35%), respectively. Whereas this molecule was predominant in the children M4 (7 of 7 cases, 100%) compared to the adult M4 (27 of 41 cases, 65.9%) and the elderly M4 (7 of 12 cases, 58.3%, p<.05), respectively. These results may suggest that pediatric cases possess more phenotypically pure character than adult and elderly cases, though this phenomenon restricted to M2 and M4 subtypes. In M4 children, not only CD11b but also CD14 (2 of 5 cases, 40%) and HLA-DR (10 of 10 cases, 100%) had a trend of higher frequencies, suggesting a more monocytoid feature in pediatric M4 than in adult and elderly ones. However, Frenkel et al.[13]. described that age difference in the frequency of CD11b expression was found only in M3, but not in M2 and M4 subtypes: the number of CD11b in M3
markedly decreased in adult patients compared to children. The reason for these discrepancies is not completely clear, but may relate to different patient populations or the different antibodies used. Regarding the stem cell marker, CD34 expression was less common in the children M3 (0 of 8 cases) than in the adult M3 (7 of 22 cases, 31.8%) and the elderly M3 (4 of 8 cases, 50%, p<.05), respectively. Since the adult t(15;17) cases also tended to have a higher CD34 expression rate (5 of 14 cases, 35.7%) when compared to the child t(15;17) cases (0 of 5 cases), adult M3 or t(15;17) cases might possess a phenotypically limited differentiation potential. On the other hand, the adult M4 showed a significantly lower CD34 expression rate (31 of 151 cases, 20.5%) than the children M4 (6 of 10 cases, 60%, p<.01) and the elderly M4 (7 of 15 cases, 46.7%, p<.05), suggesting that adult M4 cases may include a more heterogenous population in maturity. Concerning lymphoid marker, CD19 was more common in the children M2 (5 of 13 cases, 38.5%) than in the adult M2 (2 of 42 cases, 4.8%, p<.01) and in the elderly M2 (2 of 23 cases, 8.7%, p<.05), respectively. Since the expression of CD19 closely linked to the presence of t(8;21)[18,19], especially in the pediatric group (4 of 4 cases, 100%) (Table 7), these results seemed to reflect the distribution pattern of t(8;21) among the age groups. Additionally, CD19 was expressed more frequently in the child CD7+ AML (4 of 12 cases, 33.3%) than in the adult such AML (1 of 30 cases, 3.3%, p<.01), suggesting a relatively higher involvement of multipotent stem cells[20] in this type of child leukemia.
Table 10: Expression of different lineage antigens and karyotypes in each ALL subtypes according to age
Age(years) CD13 CD33 CD34 CD7 t(9;22) 11q23
B-lineage
Precursor B-cell
CD10(-) <16 0/14 2/13(15.4) 9/13(69.2) 1/13(7.7) 0/5 4/5(80)
16-59 0/9 2/9(22.2) 5/6(83.3) 0/9 1/3(33.3) 1/3(33.3)
59< 0/1 0/1 0/1 0/1 0/1 0/1
CD10(+) <16 36/243(14.8) 20/194(10.3) 164/226(72.6) 8/133(6.0) 0/19*1*2 0/19
16-59 7/69(10.1) 13/69(18.8) 44/60(73.3) 4/64(6.3) 9/26(34.6)*1 0/26
59< 2/18(11.1) 2/17(11.8) 10/15(66.7) 1/15(6.7) 2/5(40)*2 0/5
B-cell <16 0/1 ND 1/1(100) 0/1 ND ND
16-59 0/4 0/4 1/5(20) 0/5 0/2 0/2
59< 0/2 0/2 0/2 0/2 0/1 0/1
Total 45/361(12.5) 39/309(12.6)*3 234/329(71.1)*4 14/243(5.8) 12/62(19.4) 5/62(8.1)
Age(years) CD13 CD33 CD34 HLA-DR CD3 CD19
T-lineage
T-cell <16 1/30(3.3) 0/29 7/28(25) 4/31(12.9) 13/31(41.9) 1/32(3.1)
16-59 2/13(15.4) 0/12 2/12(16.7) 2/15(13.3) 10/15(66.7) 0/17
Total 3/43(7.0) 0/41(0)*3 9/40(22.5)*4 6/46(13.0) 23/46(50) 1/49(2.0)
Number of positive cases/number of cases examined (%), *1, *2, *4;p<.01, *3;p<.05
relatively low percentage of such leukemia in comparison with the other age groups due to the high frequency of T-cell ALL. Regarding the karyotype, the incidence of Ph significantly rose with increasing patient age, as previously described22. In similar to other reports[5,23], the expression rate of 11q23 tended to decrease with patient age. However, this phenomenon had no statistically significant difference probably due to the small number of patients examined in the present study. As for the myeloid antigens, CD13 and CD33, the expression rate was higher in B-lineage ALL than in T-lineage ALL, in consistent to other reports[14]. However, no age related difference was found among the immunological subtypes of ALL. Although in CD10+ precursor B-cell ALL, more Ph+ cases, which commonly express myeloid antigens (CD13 and/or CD33)[24,25], were observed as the patient age increased, these antigens evenly distributed among the 3 age groups. Khalidi et al.[14]. described that pediatric precursor B-cell ALLs less commonly expressed Ph, but had a higher frequency of myeloid antigen expression than did adult cases. This report and our results indicate that myeloid associated phenotypes tend to be expressed even in Ph precursor B-cell ALL in pediatric cases. In similar to the presence of CD7CD19 AML, this phenomenon suggests that phenotypic characteristics of multipotent stem cells, which are targets for leukemogenesis, may be preserved in pediatric cases than in adult and elderly cases.
In conclusion, our results show that there was an association between karyotypic abnormality and patient age at diagnosis, but phenotypic heterogeneity gradually emerged with increasing age irrespective of
the pattern of karyotype. As we grow older, hematopoietic cells and BM microenvironment probably accumulate the exposure to various unfavorable internal or environmental factors. Interaction with such agents and an aging of stem cell itself might result in leukemia cells with greater genetic instability and clonal diversity, which is possible to manifest the heterogeneity of phenotypic characteristics independently of karyotypic alterations.
ACKNOWLEDGMENT
This work was supported by a Grant from Japan Foundation for Aging and Health. We are grateful to Dr A Enno and Ms S Wilson [Newcastle Mater Hospital, New South Wales (NSW), Australia], Dr J Isbister, Dr DDF Ma and Mr M Piza (Royal North Shore Hospital, NSW, Australia), Dr D Rosenfeld (Liverpool Hospital, NSW, Australia), Dr A Dodds and Ms S Rhodes (St Vincent’s Hospital, NSW, Australia), Dr C Tiley (Gosford Hospital, NSW, Australia), Dr G Crane and Dr JW Hewson (Concord Hospital, NSW, Australia), Dr J Moore (New Children Hospital, NSW, Australia), Ms P Stavros (Westmead Hospital, NSW, Australia) for providing patients’ material and data.
REFERENCE
2. Fialkow, P.J., J.W. Singer and J.W. Adamson et al., 1981. Acute nonlymphocytic leukemia: heterogeneity of stem cell origin. Blood, 57: 1068-1073.
3. Brandt, L., P.G. Nilsson and F. Mitelman, 1979. Trends in incidence of acute leukemia. Lancet, 2: 1069.
4. Pendergrass, T.W., 1985. Epidemiology of acute lymphoblastic leukemia. Sem. Oncol., 12: 80-91. 5. Pui, C.-H., L.S. Frankel and A.J. Carroll et al.,
1999. Clinical characteristics and treatment outcome of childhood acute lymphoblastic leukemia with the t(4;11)(q21;q23): A collaborative study of 40 cases. Blood, 77: 440-447.
6. Wetzler, M., R.K. Dodge and K. Mrozek et al., 1999. Prospective karyotype analysis in adult acute lymphoblastic leukemia: the cancer and leukemia group B experience. Blood, 93: 3983-3993.
7. Morrison, S.J., A.M. Wandycz and K. Akashi et al., 1996. The aging of hematopoietic stem cells. Nat. Med., 2: 1011-1016.
8. Appelbaum, F.R., H. Gundacker and D.R. Head et al., 2006. Age and acute myeloid leukemia. Blood, 107: 3481-3485.
9. San Miguel, J.F., E. Ojeda and M. Gonzalez et al., 1989. Prognostic value of immunological markers in acute myeloblastic leukemia. Leukemia, 3: 108-111.
10. Bradstock, K., J. Matthews and E. Benson et al., 1994. Prognostic value of immunophenotyping in acute myeloid leukemia. Blood, 84: 1220-1225. 11. Nakase, K., K. Kita and H. Miwa et al., 2001.
Expression pattern of hybrid phenotype in adult acute lymphoblastic leukemia. Cancer Detect. Prev., 25: 394-405.
12. Giannoulis, N., C. Ogier and R. Hast et al., 1984. Difference between young and old patients in characteristics of leukemic cells: older patients have cell growing excessively in vitro, with low antigenicity despite high HLA-DR antigens. Am. J. Hematol., 16: 113-121.
13. Frenkel, M.A., N.N. Tupitsyn and A.K. Protasova et al., 1994. Blast cells in child and adult AML: comparative study of morphocytochemical, immunological and cytogenetic characteristics. Br. J. Haematol., 87: 708-714.
14. Khalidi, H.S., K.L. Chang and L.J. Medeiros et al., 1999. Acute lymphoblastic leukemia-survey of immunophenotype, French-American-British classification, frequency of myeloid antigen expression and karyotypic abnormalities in 210 pediatric and adult cases. Am. J. Clin. Pathol., 111: 467-476.
15. Nakase, K., M. Sartor and K. Bradstock, 1998. Detection of myeloperoxidase by flow cytometry in acute leukemia. Cytometry, 34: 198-202.
16. Rowley, J.D., G. Alimena and M. Garson et al., 1982. A collaborative study of the relationship of the morphological type of acute nonlymphocytic leukemia with patient age and karyotype. Blood, 59: 1013-1022.
17. Bernstein, R., M.R. Pinto and G. Morcom et al., 1982. Karyotype analysis in acute nonlymphocytic leukemia (ANLL): comparison with ethnic group, age, morphology and survival. Cancer Genet. Cytogenet., 6: 187-199.
18. Kita, K., K. Nakase and H. Miwa et al., 1992. Phenotypical characteristics of acute myelocytic leukemia associated with the t(8;21)(q22;q22) chromosomal abnormality: Frequent expression of immature B-cell antigen CD19 together with stem cell antigen CD34. Blood, 80: 470-477.
19. Nakase, K., K. Bradstock and M. Sartor et al., 2000. Geographic heterogeneity of cellular characteristics of acute myeloid leukemia: a comparative study of Australian and Japanese adult cases. Leukemia, 14: 163-168.
20. Mizutani, M., H. Miwa and T. Takahashi et al., 1997. Cellular characteristics of acute leukemia cells simultaneously expressing CD13/CD33, CD7 and CD19. Intl. J. Hematol., 66: 479-491.
21. Kita, K., K. Nasu and H. Kamesaki et al., 1985. Phenotypic characterization and clinical evaluation of 15 patients with lymphoblastic lymphoma. Acta Haematol. Jap., 48: 89-98.
22. Horibe, K., I. Tsukimoto and R. Ohno, 2001. Clinicopathologic characteristics of leukemia in Japanese children and young adults. Leukemia, 15: 1256-1261.
23. Rubnitz, J.E., F.G. Behm and J.R. Downing, 1996. 11q23 rearrangements in acute leukemia. Leukemia, 10: 74-82.
24. Hirsch-Gindberg, C., C. Childs and K.-S. Chang et al., 1999. Phenotypic and molecular heterogeneity in Philadelphia chromosome-positive acute leukemia. Blood, 71: 186-195.