Network Analysis for the Identification of
Differentially Expressed Hub Genes Using
Myogenin Knock-down Muscle Satellite Cells
Adeel Malik1,2☯, Eun Ju Lee1,3☯, Arif Tasleem Jan1, Sarafraz Ahmad1, Kyung-Hyun Cho1, Jihoe Kim1, Inho Choi1,3*
1School of Biotechnology, Yeungnam University, Gyeongsan, Republic of Korea,2Perdana University Centre for Bioinformatics, MARDI Complex, Jalan MAEPS Perdana, 43400 Serdang, Selangor, Malaysia, 3Bovine Genome Resources Bank, Yeungnam University, Gyeongsan, Republic of Korea
☯These authors contributed equally to this work. *[email protected]
Abstract
Muscle, a multinucleate syncytium formed by the fusion of mononuclear myoblasts, arises from quiescent progenitors (satellite cells) via activation of muscle-specific transcription factors (MyoD, Myf5, myogenin: MYOG,andMRF4). Subsequent to a decline in Pax7, induction in the expression of MYOG is a hallmark of myoblasts that have entered the differ-entiation phase following cell cycle withdrawal. It is evident that MYOG function cannot be compensated by any other myogenic regulatory factors (MRFs). Despite a plethora of infor-mation available regarding MYOG, the mechanism by which MYOG regulates muscle cell differentiation has not yet been identified. Using an RNA-Seq approach, analysis of MYOG knock-down muscle satellite cells (MSCs) have shown that genes associated with cell cycle and division, DNA replication, and phosphate metabolism are differentially expressed. By constructing an interaction network of differentially expressed genes (DEGs) using Gene-MANIA, cadherin-associated protein (CTNNA2) was identified as the main hub gene in the network with highest node degree. Four functional clusters (modules or communities) were identified in the network and the functional enrichment analysis revealed that genes included in these clusters significantly contribute to skeletal muscle development. To con-firm this finding,in vitrostudies revealed increased expression of CTNNA2 in MSCs on day 12 compared to day 10. Expression of CTNNA2 was decreased in MYOG knock-down cells. However, knocking down CTNNA2, which leads to increased expression of extracel-lular matrix (ECM) genes (type I collagenα1 and type I collagenα2) along with myostatin
(MSTN), was not found significantly affecting the expression of MYOG in C2C12 cells. We therefore propose that MYOG exerts its regulatory effects by acting upstream of CTNNA2, which in turn regulates the differentiation of C2C12 cells via interaction with ECM genes. Taken together, these findings highlight a new mechanism by which MYOG interacts with CTNNA2 in order to promote myoblast differentiation.
OPEN ACCESS
Citation:Malik A, Lee EJ, Jan AT, Ahmad S, Cho K-H, Kim J, et al. (2015) Network Analysis for the Identification of Differentially Expressed Hub Genes Using Myogenin Knock-down Muscle Satellite Cells. PLoS ONE 10(7): e0133597. doi:10.1371/journal. pone.0133597
Editor:Rossella Rota, Ospedale Pediatrico Bambino Gesu', ITALY
Received:March 17, 2015
Accepted:June 30, 2015
Published:July 22, 2015
Copyright:© 2015 Malik et al. This is an open access article distributed under the terms of the Creative Commons Attribution License, which permits unrestricted use, distribution, and reproduction in any medium, provided the original author and source are credited.
Data Availability Statement:All relevant data are available from GenBank with Short Read Archive under accession number SRR 1122446 (Lee et al. 2014). Additional data are available from the authors on request.
Introduction
Skeletal muscle, one of the most highly organized structures in the body, acts as a source of power for locomotion and other daily activities essential for survival. In vertebrates, develop-ment of skeletal muscle that commences at the embryonic stage ends only after postnatal growth during which an organism attains its fully developed size [1]. Skeletal muscle is unique in that this tissue arises from the fusion of mononuclear myoblasts accompanied by the expres-sion of several myogenic regulatory factors (MRFs) following cell cycle exit to ensure the coordinated response to neural input [2–7]. Among basic helix-loop-helix (bHLH) and MADS-box families of MRFs (MYOD, MYF5, MRF4, and myogenin: MYOG) that play a criti-cal role in myogenic differentiation, MYOD and MYF5 specificriti-cally play redundant roles during myoblast proliferation [8]. MYOG is responsible for terminal differentiation and cannot be compensated by other MRFs [9–12]. MYF5, MYOD, and MRF4 also spur the expression of genes that are essential for muscle satellite cells (MSCs) proliferation [8,13,14].
MSC progeny can be distinguished from their quiescent progenitors based on distinctive gene expression patterns. In adults, MSCs cycle through the steps of embryonic myogenesis to either add to or replace current muscle fibers [15–19]. Unlike the enigmatic status of genes that perform important functions in bovines, expression of a large number of genes (particularly those corresponding to different transcription factors) has been observed in mouse MSCs [20]. Therefore, it is important to delineate the expression profile of genes with unknown function in bovine-derived MSCs. Our interests in obtaining the regulatory profile of genes with impor-tant functions in mouse MSCs led us to perform the current investigation with bovine MSCs to have a clear understanding of bovine muscle development. By employing microarray, expressed sequence tag (EST) followed by RNA-Seq techniques to MSCs satellite cell analysis, we were able to delineate the regulatory network of genes corresponding to different transcrip-tion factors and certain prominent members of the extracellular protein family, involved in controlling myoblast differentiation [20,21]. We were able to elucidate and assign specific roles to certain genes, such as transthyretin, that are novel with respect to their involvement in myogenesis [22]. While investigating the gene expression profile of MYOG knock-down (MYOGkd) in bovine MSCs using RNA-Seq, we observed differential expression patterns of many genes, particularly those involved in biological pathways such as cell proliferation and DNA replication (up-regulated) or phosphate metabolic processes (down-regulated) [23].
A large number of high-throughput studies have been performed to explore the functional roles of genes found to have altered expression patterns during skeletal muscle differentiation [5,24–26]. Microarray [12,27,28] along with RNA-Seq [29] studies have improved our knowl-edge of myogenesis by identifying diverse types of target genes encoding myogenic transcrip-tion factors or novel myogenic regulatory factors which govern the fusion of myoblasts into myotubes that were otherwise hard to detect with conventional methods. In spite of these improvements, the roles that these genes play in skeletal muscle development as well as the understanding of underlying molecular mechanisms are still poorly understood. Therefore, we performed the current study to investigate the molecular mechanism underlying muscle cell differentiation by identifying genes involved in myogenesis. We created an interaction network of differentially expressed genes (DEGs) as well as additional related genes predicted by Gene-MANIA, identified hub genes in the network based on their node degree distribution, and per-formed a functional study using gene knock-down. Furthermore, we identified functional modules in this network of DEGs, and an enrichment analysis of these modules was carried out by the Database for Annotation, Visualization and Integrated Discovery (DAVID) func-tional analysis tool. Our findings offer new insights into the role of hub genes in skeletal muscle
development that will help to develop strategies for improving the meat quality and in combat-ing muscle diseases.
Materials and Methods
Datasets and network analysis
For this study, 230 up- and 223 down-regulated genes identified with bovine MYOGkd RNA-Seq data were analyzed [23]. Functional interactions between these DEGs were predicted by the GeneMANIA webserver [30]. In addition to the DEGs, 50 additional genes were used to create the interaction network using the Gene Ontology (GO) term“biological process”and
Homo sapiensas a source species. Three interaction networks were created using up-regulated genes, down-regulated genes, and a combination of the up- and down-regulated genes. Rela-tionships of genes in the network in terms of coexpression, physical and genetic interactions, pathways, colocalization, protein domain similarity, and predicted interactions were evaluated.
Detection of hub genes
In scale-free biological networks [31], nodes having large number of interacting partners repre-sent hubs in the network. Hubs were detected by calculating the node degree distribution [32] using the Network Analyzer (http://apps.cytoscape.org/apps/networkanalyzer) plugin of Cytoscape.
Community analysis and comparison of different clustering methods
The three interaction networks were visualized with Cytoscape 2.8.2 [33]. We also compared three widely used network clustering algorithms including MCL [34,35], MCODE [36], and the greedy algorithm (GLay) [37] using clusterMaker [38] and GLay plugins [39]. To explore the enriched biological functions within each cluster, the detected clusters were subjected to functional enrichment analyses by the DAVID tool (http://david.abcc.ncifcrf.gov/home.jsp). For the enrichment analysis, only communities with at least 10 nodes were evaluated.
Bovine MSCs culture
Bovine skeletal muscles were collected from the hind leg of 24- to 26-month old Korean cattle [40] with a body weight of 550–600㎏. The animals were handled according to a protocol approved by the Animal Care and Concern Committee of the National Institute of Animal Sci-ence (Republic of Korea). The collected muscle tissue was minced and digested with trypsin-EDTA (Gibco, CA, USA), centrifuged at 90 × g for 3 min, and the upper phase was passed through a 40-㎛cell strainer (Falcon, NY, USA). Following centrifugation of the filtrate at 2,500 rpm, the resulting pellet was collected, washed with Dulbecco’s modified Eagle’s medium (DMEM; HyClone Laboratories, UT, USA), and cultured at 37°C under 5% CO2in DMEM supplemented with 10% fetal bovine serum (FBS; HyClone Laboratories) and 1% penicillin/ streptomycin (P/S). The culture medium was changed every other day. To induce differentia-tion, the cells were allowed to grow without reducing serum (DMEM with 10% FBS and 1% P/ S) for 10, 12, 14, and 16 day. Bovine MSCs used in this study were provided by the Bovine Genome Resources Bank of Yeungnam University (Gyeongsan, Republic of Korea).
shRNA construction and MYOG knock-down in bovine MSCs
(MYOGwt) were transfected in 293 FT cells using CaCl2to generate viral particles. After 2 days of transfection, the supernatant containing viral particles expressing shRNA specific for bovine MYOG or the scrambled vector was collected and used to transfect MSCs (Day 8). The trans-fected cells were selected with 50㎍/㎖of G418 (Calbiochem, CA, USA). The selected cells were allowed to differentiate and harvested at Day 21. The following oligonucleotide was used to generate MYOG shRNA: 50
- GGATCCCGCGCAGACTCAAGCCGCCGGTGTTCAAGA GACACCTTCTTGAGTCTGCGCTTTTCCAACTCHGAG-30(sense). 293 FT cells were
pro-cured from Korea University Dr. Chun’s lab, Republic of Korea.
C2C12 cell culture
Mouse C2C12 cells (kindly provided by the Korean Cell Line Bank, Republic of Korea) were cultured in DMEM (HyClone Laboratories) supplemented with 10% FBS (HyClone Laborato-ries) and 1% P/S (Invitrogen, CA, USA) at 37°C in 5% CO2. For differentiation, cells grown to 70% confluence were incubated with differentiation media (DMEM with 2% FBS), and cul-tured for 0, 2, 4, and 6 days during which time the medium was changed every 2 day.
MYOG and CTNNA2 knock-down in C2C12 cells
MYOG expression was knocked down using shRNA. C2C12 cells grown to 30% confluence were transfected with 1 ng of vector containing MYOG shRNA or the scrambled vector using transfection reagent (Santa Cruz Biotechnology, CA, USA). Transfected cells treated with 2
㎍/㎖/ puromycin (Santa Cruz Biotechnology) for selection were grown to 70% confluence before switching to differentiation media. MYOG knock-down cells were cultured in differenti-ation media. Detailed informdifferenti-ation describing the shRNA sequences is provided inA) inS1
Table.
For CTNNA2 knock-down using siRNA, C2C12 cells grown to 50% confluence were trans-fected with 100μM of control or CTNNA2-specific siRNA (Thermo, Waltham, CO, USA) using Lipofectamine (Invitrogen) in transfection medium (Gibco, Grand Island, NY, USA). The transfected cells were grown to 70% confluence before switching to differentiation media. CTNNA2 knock-down cells were cultured in differentiation media. Detailed information describing the siRNA sequences is provided inB) inS1 Table.
RNA extraction and real-time RT-PCR
Cells were harvested with TRIzol reagent (Invitrogen) according to the manufacturer’s proto-col. Total RNA was extracted and stored in diethylpyrocarbonate (Sigma Aldrich)-treated H2O at -80°C until it was used for further experiments. Complementary DNA (cDNA) was synthe-sized from 1㎍of total RNA using reverse transcriptase (Invitrogen, Carlsbad, CA). Reverse transcription was then performed at 42°C for 50 min and 72°C for 15 min. Subsequently, 2㎕
of cDNA product and 10 pmol each of gene-specific primer were used for PCR with a 7500 real-time PCR system (Applied Biosystems, Foster City, CA, USA). A Power SYBR Green PCR Master Mix (Applied Biosystems) was used as the fluorescence source. Primers were designed with Primer 3 software (http://frodo.wi.mit.edu) using sequence information obtained from the NCBI. The primer sequences are provided inS2 Table.
Immunocytochemistry
permeabilization with 0.2% Triton X-100 (Sigma-Aldrich, MO, USA) for 5 min, the cells were incubated overnight with anti-CTNNA2 antibody (1:50; Abcam, MA, USA) at 4°C in a humid environment. Secondary antibody (1:100; Alexa Fluor 488 goat anti-rabbit SFX kit; Invitrogen) was then applied for 1 h at room temperature. Next, the samples were rinsed with PBS after which the nuclei were counterstained with 4’6’-diamino-2-phenylindole (DAPI; Sigma-Aldrich). Finally, pictures were taken using a fluorescent microscope equipped with a digital camera (Nikon, NY, USA).
Fusion index determination
Cell nuclei were stained with Giemsa G250 (Sigma-Aldrich) and pictures were captured ran-domly in three different fields using digital camera equipped with microscope. The number of nuclei in myotubes and total number of nuclei in the cells were also counted in each field. The fusion index was calculated as the percentage of nuclei incorporated into myotubes versus the total number of nuclei.
Western blot analysis
After washing with ice-cold PBS, cells were lysed with RIPA buffer (Thermo) containing prote-ase inhibitor cocktail (Thermo). Total protein was isolated by centrifugation of the lysate at 12,000 rpm for 10 min at 4°C after which the protein concentration was determined by the Bradford method. The total protein (40㎍) was separated in 8% or 10% SDS-polyacrylamide gels by electrophoresis and transferred to PVDF membranes (Millipore, MA, USA). The blots were subsequently blocked with 3% skim milk (BD, MD, USA) or BSA (Sigma-Aldrich) in TBST for 1 h and then incubated overnight at 4°C with antibodies against CTNNA2 (1:500, Santa Cruz Biotechnology), type I collagenα1 (COL1α1; 1:2500, Abcam), Myostatin (MSTN; 1:400, Santa Cruz Biotechnology), orβ-actin (1:2000, Santa Cruz Biotechnology) diluted with 1% skim milk or BSA in TBS. After washing with TBST, the blots were incubated with horse-radish peroxidase (HRP)-conjugated secondary antibody (goat anti rabbit or mouse, Santa Cruz Biotechnology) for 1 h at room temperature. After washing with TBST, antibody binding was detected with Super Signal West Pico Chemiluminescent Substrate (Thermo).
Statistical analysis
Mean values for normalized expression were compared using Tukey’s studentized range (HSD) to identify significant differences in gene expression. P-values<0.05 were considered statistically significant. Real-time RT-PCR data were analyzed with a one-way ANOVA using PROC GLM in the SAS package ver. 9.0 (SAS Institute, Cary, NC, USA).
Results
DEGs and network construction
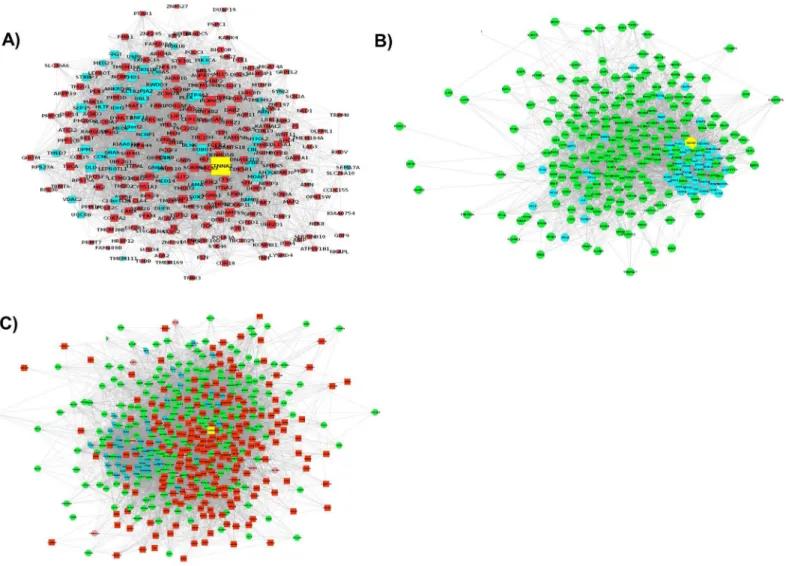
A total of 230 up-regulated and 223 down-regulated genes identified by comparing MYOGwt and MYOGkdprimary bovine MSCs were studied [23]. The GeneMANIA webserver was used to predict interactions between the DEGs and 50 additional related genes in the network using the GO term“biological process”and source organismHomo sapiensas additional parameters. Out of the 230 up- and 223 down-regulated genes, GeneMANIA was able to recognize 217 and 215 genes, respectively. Using these DEGs and the 50 related genes identified by GeneMANIA, three interaction networks were created. The first interaction network (Network 1) was created
nodes shown in cyan were GeneMANIA-predicted genes (Fig 1A). The second network ( Net-work2) contained 217 up-regulated genes (nodes in green) and GeneMANIA-predicted genes
(nodes in cyan;Fig 1B). Processes related to the cell cycle were the main processes in this net-work (S4 Table). The final network (Network 3) consisted of 432 genes (both up- and
down-regulated) as well as GeneMANIA-predicted genes (Fig 1C). The three interaction networks predicted by GeneMANIA were exported to Cytoscape for filtering (to remove duplicate edges and self-loops), and topological properties such as node degree were assessed. After removing the duplicate edges and self-loops,Network 1contained 264 nodes and 4545 edges whereas Network 2had 264 nodes and 4309 edges. Similarly, the filteredNetwork 3(the main network
in this study) had 481 nodes and 11374 edges, and functions related to the cell cycle were over-represented (Table 1).
Identification of hub genes
In order to identify potential hub genes, the node degree of each node in all three networks was calculated with the Network-Analyzer plugin of Cytoscape. Genes with the highest node degree
Fig 1. The interaction networks for DEGs as predicted by GeneMania and visualized in Cytoscape.The three networks represent interactions for A) down-regulated genes, B) up-regulated genes, and C) a combination of up- and down-regulated genes.
Table 1. Functional enrichment of differentially expressed genes (DEG) and 50 related genes in the network as reported by GeneMANIA.
Functions FDR
response to zinc ion 0.0000142
regulation of growth 0.000176
negative regulation of growth 0.000315
DNA strand elongation involved in DNA replication 0.000315
response to cadmium ion 0.000315
MCM complex 0.000315
interphase of mitotic cell cycle 0.00035
interphase 0.000386
S phase of mitotic cell cycle 0.000386
DNA strand elongation 0.000389
mitosis 0.000389
nuclear division 0.000389
cell cycle checkpoint 0.000447
regulation of cell cycle process 0.000477
S phase 0.000477
M phase of mitotic cell cycle 0.000642
G1/S transition of mitotic cell cycle 0.00088
organellefission 0.000981
cellular response to metal ion 0.00108
cellular response to inorganic substance 0.00153
regulation of mitotic cell cycle 0.00163
zinc ion binding 0.00163
perinuclear region of cytoplasm 0.00202
regulation of transcription involved in G1/S phase of mitotic cell cycle 0.00711
DNA-dependent DNA replication 0.0105
regulation of peptidase activity 0.0127
cell growth 0.0129
M/G1 transition of mitotic cell cycle 0.0169
microtubule associated complex 0.0204
response to interleukin-6 0.0205
transition metal ion binding 0.0211
regulation of endopeptidase activity 0.0231
enzyme inhibitor activity 0.0281
DNA replication 0.029
regulation of proteasomal protein catabolic process 0.0322
acute inflammatory response 0.0407
leukocyte migration 0.047
positive regulation of cell cycle process 0.0509
regulation of protein catabolic process 0.0522
regulation of cell growth 0.0553
proteasomal protein catabolic process 0.0618
positive regulation of cell cycle 0.0727
leukocyte chemotaxis 0.0734
acute-phase response 0.0734
neutrophil chemotaxis 0.0734
regulation of mitosis 0.0786
were considered hub genes in each of these networks. CTNNA2 was the hub gene inNetwork 1
andNetwork 3with node degrees of 89 and 136, respectively. InNetwork 2, CDC20 was the
top hub with a node degree of 83. InTable 2, all genes that had a node degree100 inNetwork 3are listed. Since CTNNA2 was identified as the top hub gene in two out of three interaction
networks (Networks 1and3),in vitrostudies were designed to explore the functional
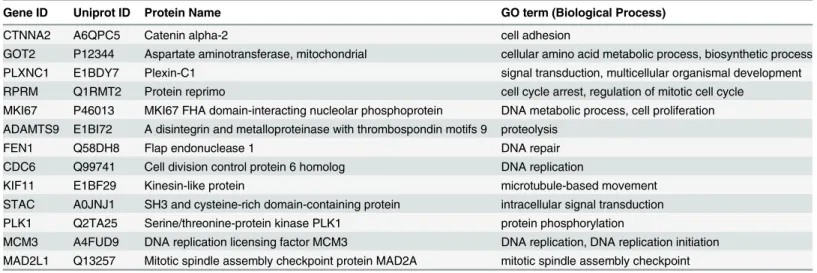
signifi-cance of this gene in skeletal muscle development using primary bovine MSCs. The top hub gene CTNNA2 and its interacting partners are presented inFig 2AInFig 2B, it can be observed that these interacting partners are involved in collagen catabolic processes and skele-tal muscle development (up-regulated genes), or processes related to cell growth and morpho-genesis (down-regulated genes). Similarly, the GeneMANIA-predicted first neighbors of CTNNA2 were involved in either DNA replication or DNA metabolic processes (Table 3).
Community analysis
SinceNetwork 3was largest of the three networks and contained both up- and down-regulated
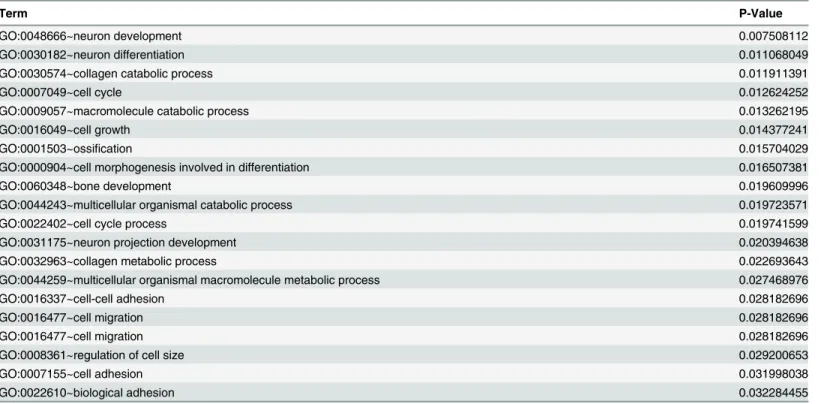
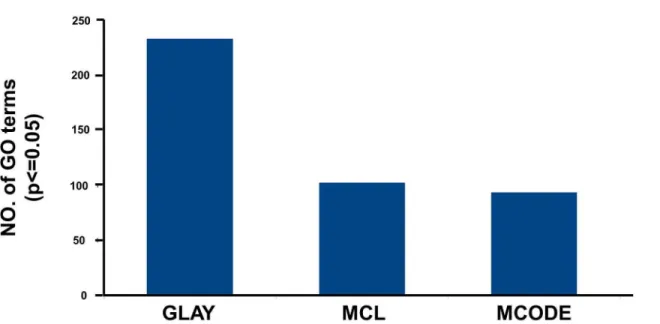
genes, we selected this network to identify functional modules using greedy algorithm (GLay). A total of four functional clusters were detected with only the first three clusters having more than ten genes; these were further subjected to functional analysis to identify enriched GO terms.Fig 3A(Cluster 1–4)shows the functional modules detected by GLay. A DAVID functional analysis tool was employed to categorize the genes in each cluster and observe the overrepresented GO terms in all three modules (Table 4). Overall, 233 enriched GO terms were identified in all three clusters. One hundred and thirty-six statistically significant (p-value0.05) GO terms were overrepresented in cluster 1, which was the largest detected clus-ter. Among the 10 most significant enriched factors, processes related to homeostasis were more prominent in cluster 1 (Table 4AandS5 Table). Other overrepresented processes in this cluster include leukocyte migration, response to wounding, and cell migration and motion. A total of 93 GO terms that were enriched in cluster 2 included processes related to the cell cycle and DNA replication (Table 4BandS6 Table). Cluster 3 was the smallest of all the modules detected. It consisted of only four statistically significant phosphorous metabolism-related GO terms such as protein amino acid phosphorylation and the phosphorous metabolic process
(Table 4C). No enriched category was observed in cluster 4 as this cluster was omitted from
the functional analysis because it only contained two genes.
In addition to GLay, we also compared the cluster analysis results with two other well-known clustering programs: MCODE and MCL. MCODE detected 12 clusters, but only nine
Table 1. (Continued)
Functions FDR
regulation of nuclear division 0.0786
regulation of proteolysis 0.082
cellular response to drug 0.082
anaphase-promoting complex-dependent proteasomal ubiquitin-dependent protein catabolic process
0.082
endopeptidase regulator activity 0.083
regulation of leukocyte migration 0.0896
proteasomal ubiquitin-dependent protein catabolic process 0.0938
cell chemotaxis 0.0965
microtubule-based process 0.0965
mitotic prometaphase 0.0965
that contained10 nodes were selected for enrichment analysis (Fig 3BCluster 1–8 along
with remaining one). These nine modules were associated with 93 statistically significant GO terms. Clusters 1, 8, and 9 did not have any enriched categories. Cluster 2 was enriched in leu-kocyte migration and enzyme-linked receptor protein signaling pathway, whereas cluster 3 showed overrepresentation of biosynthetic processes such as those involved in nitrogen com-pound and cofactor biosynthesis. Cluster 4, the largest cluster detected by MCODE, included processes related to the cell cycle and cell division. Cluster 5 was mainly associated with regula-tion processes that govern nucleocytoplasmic and intracellular transport, response to stimuli, immune effector activity, and neuron differentiation. In cluster 6, the enriched terms included cell motility, cell motion, and phosphorous metabolic process whereas cluster 7 was associated
Table 2. Summary of 13 hub genes detected by network analysis.
Gene ID Uniprot ID Protein Name GO term (Biological Process)
CTNNA2 A6QPC5 Catenin alpha-2 cell adhesion
GOT2 P12344 Aspartate aminotransferase, mitochondrial cellular amino acid metabolic process, biosynthetic process
PLXNC1 E1BDY7 Plexin-C1 signal transduction, multicellular organismal development
RPRM Q1RMT2 Protein reprimo cell cycle arrest, regulation of mitotic cell cycle MKI67 P46013 MKI67 FHA domain-interacting nucleolar phosphoprotein DNA metabolic process, cell proliferation ADAMTS9 E1BI72 A disintegrin and metalloproteinase with thrombospondin motifs 9 proteolysis
FEN1 Q58DH8 Flap endonuclease 1 DNA repair
CDC6 Q99741 Cell division control protein 6 homolog DNA replication
KIF11 E1BF29 Kinesin-like protein microtubule-based movement
STAC A0JNJ1 SH3 and cysteine-rich domain-containing protein intracellular signal transduction PLK1 Q2TA25 Serine/threonine-protein kinase PLK1 protein phosphorylation
MCM3 A4FUD9 DNA replication licensing factor MCM3 DNA replication, DNA replication initiation MAD2L1 Q13257 Mitotic spindle assembly checkpoint protein MAD2A mitotic spindle assembly checkpoint
doi:10.1371/journal.pone.0133597.t002
Fig 2. CTNNA2 is a hub in the network of down-regulated genes as well as the network created by combining the up- and down-regulated genes. A)The hub CTNNA2 (yellow) and its first neighbors. Genes that were up-regulated in MYOGkdcells are shown in green whereas the down-regulated genes are shown in red. The genes predicted by GeneMania are shown in cyan.B)Functional enrichment of first neighbors of CTNNA2. The green circles represent up-regulated gene nodes and are enriched in metabolic processes. The larger red circles represent down-regulated nodes and are enriched in processes related to cell growth, morphogenesis, and migration. The smallest circle (cyan) represents the group of genes predicted by GeneMania and is enriched for DNA replication and DNA metabolic processes.
with responses to wounding and inflammation in addition to the phosphorous metabolic pro-cess (A) inS7 Table). On the other hand, a total of seven clusters were detected by MCL with only one large cluster having more than 10 nodes (Fig 3C). This cluster had 102 significantly enriched GO terms with the most enriched representing processes related to the cell cycle and DNA replication (B) inS7 Table). For comparison, the numbers of statistically significant GO terms reported by three different algorithms are summarized inFig 4.
CTNNA2 expression during differentiation and effects of MYOG
knock-down in bovine MSCs
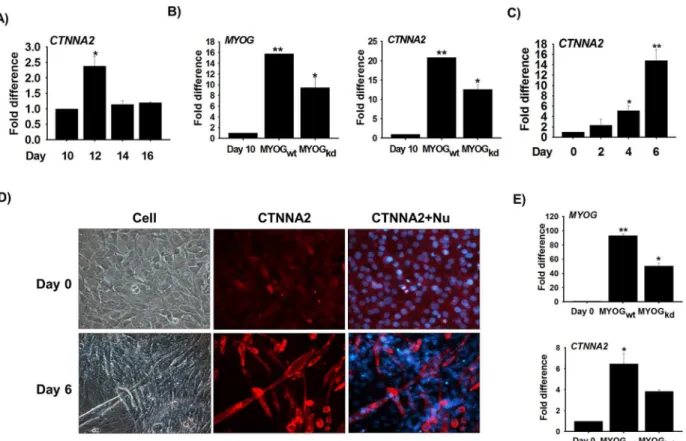
Based on our initial network analysis in which CTNNA2 was identified as the top hub gene with the maximum interacting partners (genes), anin vitrostudy was carried out to explore the functional significance of this gene in skeletal muscle development using primary bovine MSCs. After isolating the MSCs from bovine hind leg skeletal muscle, MSCs stained with Pax7 were used to determine cell purity. Around 85% of the total cell population was found to express Pax7. To elucidate the function of CTNNA2 during bovine MSC differentiation, changes in mRNA expression over time were evaluated. CTNNA2 expression was increased on Day 12 (Differentiation) compared to Day 10 (Proliferation) (Fig 5A). Correlation of CTNNA2 and MYOG expression was validated through RNA-Seq analysis (Lee et al., 2014). To establish the relationship between MYOG and CTNNA2, MYOG shRNA was transfected in MSCs. Expression of MYOG and CTNNA2 was decreased in MYOGkdcells compared to MYOGwtcells (Fig 5B). Results of these knock-down studies indicated that CTNNA2 expres-sion is involved in myogenesis and is regulated by MYOG.
Table 3. Top enriched GO terms for CTNNA2 and its first neighbors.
Term P-Value
GO:0048666~neuron development 0.007508112
GO:0030182~neuron differentiation 0.011068049
GO:0030574~collagen catabolic process 0.011911391
GO:0007049~cell cycle 0.012624252
GO:0009057~macromolecule catabolic process 0.013262195
GO:0016049~cell growth 0.014377241
GO:0001503~ossification 0.015704029
GO:0000904~cell morphogenesis involved in differentiation 0.016507381
GO:0060348~bone development 0.019609996
GO:0044243~multicellular organismal catabolic process 0.019723571
GO:0022402~cell cycle process 0.019741599
GO:0031175~neuron projection development 0.020394638
GO:0032963~collagen metabolic process 0.022693643
GO:0044259~multicellular organismal macromolecule metabolic process 0.027468976
GO:0016337~cell-cell adhesion 0.028182696
GO:0016477~cell migration 0.028182696
GO:0016477~cell migration 0.028182696
GO:0008361~regulation of cell size 0.029200653
GO:0007155~cell adhesion 0.031998038
GO:0022610~biological adhesion 0.032284455
CTNNA2 expression during differentiation and effects of MYOG,
CTNNA2 knock-down in C2C12 cells
To confirm the data obtained from the bovine MSC studies, the expression of CTNNA2 in C2C12 cells was assessed. mRNA expression was measured in cells cultured with 2% FBS for 0, 2, 4, and 6 days. It was found that mRNA levels had gradually increased by day 6 compared to day 0 (Fig 5C).
Protein localization studies using immunocytochemistry revealed that CTNNA2 expression was highly restricted to the cytoplasm. Expression had increased on day 6 compared to day 0
(Fig 5D). To elucidate the correlation between CTNNA2 and MYOG expression in C2C12
cells, MYOG knock-down was performed with shRNA. Results of the experiment revealed that expression of both MYOG and CTNNA2 was down-regulated in MYOGkdcells compared to MYOGwtcells. Data from the knock-down studies demonstrated that expression of CTNNA2 is regulated by MYOG in C2C12 cells.
Fig 3. Communities generated by three different clustering methods. A)Cluster 1–4: Greedy algorithm (GLay)-generated communities are shown. In
each community, up-regulated nodes are represented by green circles whereas the down-regulated nodes are shown in red. As presented in the figure, most nodes in a network were assigned to a community. Community 1 has CTNNA2 as the hub node highlighted in yellow.B)Cluster 1–8, along with remaining
one: MCODE-generated communities are shown. Many nodes are not clustered, and the top hub CTNNA2 is grouped into community 6.C)MCL produced only one large community with more than 10 nodes.
Myotube formation and ECM gene expression in C2C12 cells with
knocked down CTNNA2 expression
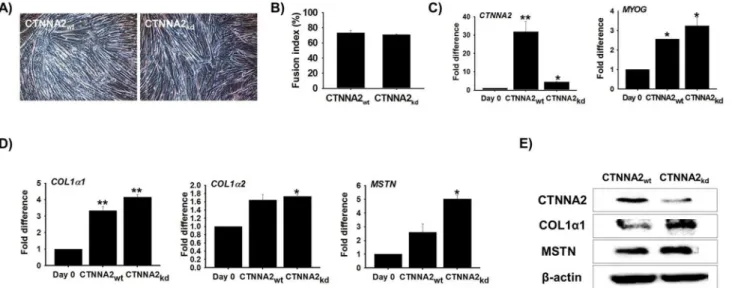
C2C12 cells transfected with CTNNA2 siRNA (CTNNA2kd) were cultured with 2% FBS for 6 day. Cell morphology, tube formation, and fusion index values were similar for both cell (nor-mal and knock-down) lines (Fig 6A and 6B).CTNNA2 and MYOG mRNA expression was also analyzed by real-time RT-PCR. CTNNA2 expression was decreased substantially whereas MYOG expression was not significantly altered by knocking down CTNNA2 (CTNNA2kd;Fig 6C). Simultaneously, ECM is considered essential for myotube formation and the expression of muscle-specific gene products [41]. The expression of ECM genes (COL1α1, COL1α2, and MSTN) was increased during myogenesis (unpublished data). To establish the relationship between CTNNA2 and the ECM during myogenesis, mRNA and protein expression of COL1α1, COL1α2, and MSTN was measured in CTNNA2kdcells. Both mRNA and protein expression of all three genes was significantly increased in CTNNA2kdcells compared to CTNNA2wtcells (Fig 6D and 6E). These results indicated that CTNNA2 helps maintain bal-ance between the expression of MRF and ECM gene expression during muscle differentiation.
Table 4. Enriched GO terms in each cluster detected by GLay.
Term P-value
A) Cluster 1
GO:0050900~leukocyte migration 1.316E-05
GO:0009611~response to wounding 1.5127E-05
GO:0055080~cation homeostasis 4.6482E-05
GO:0050801~ion homeostasis 5.6871E-05
GO:0006873~cellular ion homeostasis 6.7452E-05
GO:0055082~cellular chemical homeostasis 8.1336E-05
GO:0006928~cell motion 0.00011197
GO:0016477~cell migration 0.00012824
GO:0055066~di-, tri-valent inorganic cation homeostasis 0.00012879
GO:0030003~cellular cation homeostasis 0.00022731
B) Cluster 2
GO:0007049~cell cycle 2.611E-15
GO:0000278~mitotic cell cycle 1.6135E-13
GO:0022403~cell cycle phase 2.3341E-12
GO:0022402~cell cycle process 4.307E-12
GO:0007067~mitosis 4.6172E-11
GO:0000280~nuclear division 4.6172E-11
GO:0000087~M phase of mitotic cell cycle 6.3176E-11
GO:0048285~organellefission 9.2574E-11
GO:0000279~M phase 1.8784E-10
GO:0006260~DNA replication 2.4533E-09
C) Cluster 3
GO:0006468~protein amino acid phosphorylation 0.00187298
GO:0016310~phosphorylation 0.00414241
GO:0006793~phosphorus metabolic process 0.00947152
GO:0006796~phosphate metabolic process 0.00947152
Discussion
By definition, MSCs under the basal lamina are stem cells in muscle with the ability to self-renew and differentiate into myoblasts. Once satellite cells differentiate into myoblasts, they fuse into myofibers and contribute to myofiber growth. To obtain insight into the transcrip-tome of primary bovine MSCs, we recently performed an analysis with MYOGkdsamples using the RNA-Seq approach [23]. Generally, a typical high throughput analysis targets the identifi-cation of DEGs while a pathway analysis followed by experimental validation of a few selected genes (based on fold change in expression) is performed to measure functional enrichment. Knowing that DEGs may be equally or more significant for elucidating the process of skeletal muscle development, we created interaction networks of DEGs identified from MYOGkd sam-ples in order to obtain insight into the relationships with respect to one another. In the present study, we constructed three interaction networks (using up-regulated or down-regulated genes and a combination of all genes) from the list of DEGs for MYOGkdprimary bovine MSCs. As part of our previous study, we found that genes involved in cell division, DNA replication, and phosphate metabolic processes were differentially expressed [23]. The node degree of each gene in all three networks was calculated. It was observed that CTNNA2 had the highest node degree inNetworks 1and3, whereas CDC20 was the gene with highest node degree inNetwork 2. Since CTNNA2 was found to have the highest node degree in two out of three networks, this
gene was considered a hub gene in the present study. Therefore, its functional significance in skeletal muscle development was further explored.
The CTNNA2 gene encodes catenin alpha-2 or alpha N-catenin in humans and mice, but is recorded as an uncharacterized protein in the UniProt for bovine (UniProt IDs: P26232; Q61301). CTNNA2 protein acts as a linker between cadherin adhesion receptors and the cyto-skeleton to control cell-cell adhesion and differentiation in the nervous system. This protein also regulates morphological plasticity of synapses as well as cerebellar and hippocampal lami-nation during development [42–44]. CTNNA2 is also part of a cell surface complex that includes Ig/FNIII proteins CDO and BOC, N- and M-cadherin (promyogenic cell adhesion
Fig 4. Comparison of statistically significant GO terms reported by different algorithms.In the figure it can be observed that GLay produced the maximum number of statistically significant GO terms.
molecules), andβ- andα-catenin (cadherin-associated proteins) that may direct several aspects of myogenesis [45–48].
Recently, we identified CTNNA2 as a DEG that is down-regulated by at least 4-fold in MYOGkdprimary bovine MSCs using RNA-Seq analysis [23]. InFig 2,it can be observed that CTNNA2 CTNNA2 (a cell adhesion protein) has diverse interacting partners including other cell adhesion molecules such as PLXNC1, CDK5R1, CDH18, COL15A1, and JAM2 (down-reg-ulated) as well as IBSP, CLDN6, PCDHB11, and SELPLG (up-reg(down-reg-ulated). These cell adhesion molecules along with other genes as seen inFig 2are involved in various biological processes such as collagen catabolism, skeletal muscle development, cell growth, and morphogenesis
(Table 3). Moreover, we also observe cross-talk between these processes, thereby suggesting
that one gene may be involved in various myogenic pathways (Fig 2). CTNNA2 expression was also increased during myogenesis. CTNNA2 and MYOG expression was analyzed in CTNNA2 and MYOG knock-down cells. CTNNA2 expression was decreased in MYOGkd. However, expression of MYOG was not significantly altered in CTNNA2 knock-down cells. Results of this experiment indicated that MYOG may be upstream of CTNNA2.
To further explore the role of CTNNA2 in myogenesis, we evaluated genes (MYOG, COL1α1, COL1α2, and MSTN) that are known to play substantial roles in skeletal muscle
Fig 5. CTNNA2 expression during myogenesis in bovine MSCs and C2C12 cells.Bovine MSCs were cultured for 10, 12, 14, and 16 days in DMEM supplemented with 10% FBS and 1% penicillin/streptomycin (P/S). RNA was then isolated.A)CTNNA2 expression was analyzed by real-time RT-PCR and had increased on Day 12 compared to Day 10.B)MYOG gene expression was knocked down in bovine MSCs. MYOG and CTNNA2 expression was measured in MYOG knock-down cells. C2C12 cells were cultured with differentiation media for 0, 2, 4, and 6 days. mRNA expression was then analyzed by real-time RT-PCR.C)CTNNA2 expression was elevated on Day 6 compared to Day 0.D)Protein localization was observed by immunocytochemistry on Day 0 and 6. CTNNA2 protein was highly expressed inside myotubes on Day 6.E)MYOG expression was knocked down with shRNA in C2C12 cells that were cultured in differentiation media for 6 days. Gene expression was analyzed by real-time RT-PCR. Expression of MYOG and CTNNA2 was down-regulated in MYOGkd. The p-value indicated statistical significance of the data (p<0.05, mean±standard deviation [S.D.], n = 3).
development [49–51]. A substantial increase in the expression of these genes (Fig 6) in CTNNA2kdcells suggested that CTNNA2 holds a significant role in collagen catabolism, cell adhesion, and myogenesis. Collagen, proteoglycans, and adhesive glycoproteins are key com-ponents of the ECM, and are involved in ECM-receptor interactions as well as focal adhesion [50]. Explicit interactions among cells and ECM facilitated by transmembrane molecules or other cell surface-associated factors may directly or indirectly regulate cellular activities such as adhesion and migration [50].
Identifying the structure and function of biological networks is crucial for the exploration of biological phenomena. The interest in exploiting the use of network based studies to address key biological issues is ever increasing [52–54]. In this work, four functional modules or clus-ters were identified inNetwork 3using the GLay plugin for Cytoscape. Additionally, the
func-tional enrichment of each module in the network was explored using the DAVID funcfunc-tional annotation tool. Our analysis demonstrated that among the 10 most significant enrichments, cluster 1 homeostasis was highly overrepresented. Some of the genes grouped under homeosta-sis by the DAVID functional analyhomeosta-sis encode channel proteins such as ryanodine receptor 1 (RYR1) and sodium channel protein type 1 subunit alpha (SCN1A). RYR1 is an indispensable factor for maintaining calcium homeostasis in mammalian skeletal muscle. Inactivation of this protein is lethal at birth in mice and mutations of the RYR1 gene in humans are associated various muscle disorders [51]. Similarly, voltage-gated sodium channels are involved in the early increase and consequent transmission of action potential in skeletal muscle [55]. Cluster 2 was enriched in processes related to the cell cycle and DNA replication. It included genes that encode various cell division homologue proteins such as cell division cycle 45 (CDC45), CDC20, and CDC6. The third cluster in the network was enriched in phosphorous metabolic processes. The community structure of our network concurs with results of our recent work on MYOGkdprimary bovine MSCs [23].
Fig 6. Myogenesis and associated genes evaluated by CTNNA2 knock-down.C2C12 cells were transfected with CTNNA2-specific siRNA and incubated with 2% FBS for 6 d.A)Morphology of the CTNNA2wtand CTNNA2kdcells was similar.B)The fusion index was determined and the values were similar for CTNNA2wtand CTNNA2kdcells.C)mRNA expression was analyzed by real-time RT-PCR. CTNNA2 expression was decreased in CTNNA2 knock-down cells. However, MYOG expression was similar in the CTNNA2wtand CTNNA2kdcells.D)Expression of ECM genes was analyzed by real-time RT-PCR. COL1α1, COL1α2, and MSTN gene expression was increased in CTNNA2kdcells. In particular, MSTN expression was the highest among the four genes.E)Protein expression of CTNNA2, COL1α1, and MSTN in CTNNA2
kdwas analyzed by Western blotting. CTNNA2 and ECM protein expression levels were similar to the mRNA expression patterns. The p-value indicates the statistical significance (p<0.05, mean±S.D., n = 3).
Molecular target discovery and targeted therapeutics have become indispensable ever since the advancement of bioinformatics [56]. Although the present study highlights the importance ofin silicoapproaches for assigning novel role to genes such as CTNNA2 in myogenesis, at the same time our findings open up several avenues that emphasize the importance of predicting how genes interact with each other to regulate homeostasis. It is also apparent thatin silico -predicted results are highly correlated with experimental data. Altogether, understanding the structure and function of DEGs is essential not only for elucidating their roles during prolifera-tion and differentiaprolifera-tion, but can also be useful for predicting the binding specificities of genes to counteract several muscular dystrophies by designing potent inhibitors against target genes.
Supporting Information
S1 Table. A) shRNA information B) siRNA information.
(DOCX)
S2 Table. Primer information.
(DOCX)
S3 Table. Functional enrichment of down-regulated and 50 related genes in the network as reported by GeneMANIA.
(DOCX)
S4 Table. Functional enrichment of up-regulated and 50 related genes in the network as reported by GeneMANIA.
(DOCX)
S5 Table. 136 enriched GO terms in cluster 1 as detected by Glay.
(DOCX)
S6 Table. 93 enriched GO terms in cluster 2 as detected by GLay.
(DOCX)
S7 Table. A) Enriched GO terms in cluster 1 detected by MCODE, B) Enriched GO terms in clusters detected by MCL.
(DOCX)
Acknowledgments
All research materials used in this study were provided by the Bovine Genome Resources Bank of Yeungnam University (Gyeongsan, Republic of Korea).
Author Contributions
Conceived and designed the experiments: IC AM EJL. Performed the experiments: EJL AM. Analyzed the data: AM EJL IC. Contributed reagents/materials/analysis tools: KHC JK. Wrote the paper: IC AM EJL ATJ SA.
References
1. Meadows E, Cho JH, Flynn JM, Klein WH (2008) Myogenin regulates a distinct genetic program in adult muscle stem cells. Dev Biol 322: 406–14. doi:10.1016/j.ydbio.2008.07.024PMID:18721801
2. Olson EN, Brennan TJ, Chakraborty T, Cheng TC, Cserjesi P, Edmondson D, et al. (1991) Molecular control of myogenesis: antagonism between growth and differentiation. Mol Cell Biochem 104: 7–13.
PMID:1922004
4. Andrés V, Walsh K (1996) Myogenin expression, cell cycle withdrawal, and phenotypic differentiation are temporally separable events that precede cell fusion upon myogenesis. J Cell Biol 132: 657–66.
PMID:8647896
5. Moran JL, Li Y, Hill AA, Mounts WM, Miller CP (2002) Gene expression changes during mouse skeletal myoblast differentiation revealed by transcriptional profiling. Physiol Genomics 10: 103–11. PMID:
12181367
6. Janot M, Audfray A, Loriol C, Germot A, Maftah A, Dupuy F (2009) Glycogenome expression dynamics during mouse C2C12 myoblast differentiation suggests a sequential reorganization of membrane gly-coconjugates. BMC Genomics 10: 483. doi:10.1186/1471-2164-10-483PMID:19843320
7. Rajan S, Chu Pham Dang H, Djambazian H, Zuzan H, Ketela T, et al. (2012) Analysis of early C2C12 myogenesis identifies stably and differentially expressed transcriptional regulators whose knock-down inhibits myoblast differentiation. Physiol Genomics 2: 183–197. doi:10.1152/physiolgenomics.00093.
2011PMID:22147266
8. Rudnicki MA, Schnegelsberg PNJ, Stead RH, Braun T, Arnold HH, Jaenisch R (1993) MyoD or Myf-5 is required for the formation of skeletal muscle. Cell 75: 1351–1359. PMID:8269513
9. Rawls A, Morris JH, Rudnicki M, Braun T, Arnold HH, Klein WH, et al. (1995) Myogenin's functions do not overlap with those of MyoD or Myf-5 during mouse embryogenesis. Dev Biol 172: 37–50. PMID:
7589813
10. Cao Y, Kumar RM, Penn BH, Berkes CA, Kooperberg C, Boyer LA, et al. (2006) Global and gene-spe-cific analyses show distinct roles for Myod and Myog at a common set of promoters. EMBO J 25: 502–
511. PMID:16437161
11. Wang Y, Jaenisch R (1997) Myogenin can substitute for Myf5 in promoting myogenesis but less effi-ciently. Development 124: 2507–2513. PMID:9216993
12. Rajan S, Chu Pham Dang H, Djambazian H, Zuzan H, Fedyshyn Y, Ketela T, et al. (2012) Analysis of early C2C12 myogenesis identifies stably and differentially expressed transcriptional regulators whose knock-down inhibits myoblast differentiation. Physiol Genomics 2: 183–197. doi:10.1152/
physiolgenomics.00093.2011PMID:22147266
13. Kablar B, Asakura A, Krastel K, Ying C, May LL, Goldhamer DJ, et al. (1998) MyoD and Myf-5 define the specification of musculature of distinct embryonic origin. Biochem Cell Biol 76: 1079–1091. PMID:
10392718
14. Kassar-Duchossoy L, Gayraud-Morel B, Gomès D, Rocancourt D, Buckingham M, Shinin V, et al. (2004) Mrf4 determines skeletal muscle identity in Myf5:Myod double-mutant mice. Nature 431: 466–
471. PMID:15386014
15. Bischoff R. (1994) The satellite cell and muscle regeneration. Engel A. (Ed.), Myology, Mc-Graw Hill, New York 1: 97–118.
16. Charge SB, Rudnicki MA (2004) Cellular and molecular regulation of muscle regeneration. Physiol Rev 84: 209–238. PMID:14715915
17. Cossu G, Molinaro M (1987) Cell heterogeneity in the myogenic lineage. Curr Top Dev Biol 23: 185–
208. PMID:3330504
18. Gibson MC, Schultz E (1983) Age-related differences in absolute numbers of skeletal muscle satellite cells. Muscle Nerve 6: 574–580. PMID:6646160
19. Schultz E, Jaryszak DL, Valliere CR (1985) Response of satellite cells to focal skeletal muscle injury. Muscle Nerve 8: 217–222. PMID:4058466
20. Lee EJ, Lee HJ, Kamli MR, Pokharel S, Bhat AR, Lee YH, et al. (2012) Depot-specific gene expression profiles during differentiation and transdifferentiation of bovine muscle satellite cells, and differentiation of preadipocytes. Genomics 100: 195–202. doi:10.1016/j.ygeno.2012.06.005PMID:22728265
21. Lee EJ, Kamli MR, Pokharel S, Malik A, Tareq KM, Roof BA, et al. (2013) Expressed sequence tags for bovine muscle satellite cells, myotube formed-cells and adipocyte-like cells. PLOS ONE 8: e79780. doi:10.1371/journal.pone.0079780PMID:24224006
22. Lee EJ, Bhat AR, Kaml MR, Pokharel S, Chun T, Lee YH, et al. (2013) Transthyretin is a key regulator of myoblast differentiation. PLOS ONE 8: e63627. doi:10.1371/journal.pone.0063627PMID: 23717457
23. Lee EJ, Malik A, Pokharel S, Ahmad S, Mir BA, Cho KH, et al. (2014) Identification of genes differen-tially expressed in myogenin knock-down bovine muscle satellite cells during differentiation through RNA sequencing analysis. PLOS ONE 9: e92447. doi:10.1371/journal.pone. 0092447PMID: 24647404
25. Shen X, Collier JM, Hlaing M, Zhang L, Delshad EH, Bristow J, et al. (2003) Genome-wide examination of myoblast cell cycle withdrawal during differentiation. Dev Dyn 1: 128–138. PMID:12508234
26. Tomczak KK, Marinescu VD, Ramoni MF, Sanoudou D, Montanaro F, Han M, et al. (2004) Expression profiling and identification of novel genes involved in myogenic differentiation. FASEB J 18: 403–405.
PMID:14688207
27. Liu QC, Zha XH, Faralli H, Yin H, Louis-Jeune C, Perdiguero E, et al. (2012) Comparative expression profiling identifies differential roles for Myogenin and p38αMAPK signaling in myogenesis. J Mol Cell Biol 4: 386–397. doi:10.1093/jmcb/mjs045PMID:22847234
28. Wicik Z, Sadkowski T, Jank M, Motyl T (2011) The transcriptomic signature of myostatin inhibitory influ-ence on the differentiation of mouse C2C12 myoblasts. Pol J Vet Sci 4: 643–652. PMID:22439337
29. Langmead B, Trapnell C, Pop M, Salzberg SL (2010) Ultrafast and memory-efficient alignment of short DNA sequences to the human genome. Genome Biol 10: R25. doi:10.1186/gb-2009-10-3-r25PMID: 19261174
30. Warde-Farley D, Donaldson SL, Comes O, Zuberi K, Badrawi R, Chao P, et al. (2010) The GeneMANIA prediction server: biological network integration for gene prioritization and predicting gene function. Nucleic Acids Res 38: W214–20. doi:10.1093/nar/gkq537PMID:20576703
31. Albert R (2005) Scale-free networks in cell biology. J Cell Sci 118: 4947–4957. PMID:16254242
32. Wu XR, Zhu Y, Li Y (2005) Analyzing protein interaction networks via random graph model. Int. J. Inf. Technol 11: 125–132.
33. Smoot ME, Ono K, Ruscheinski J, Wang PL, Ideker T (2001) Cytoscape 2.8: new features for data inte-gration and network visualization. Bioinformatics 27: 431–432. doi:10.1093/bioinformatics/btq675
PMID:21149340
34. van Dongen S. Graph Clustering by Flow Simulation. Unpublished doctoral dissertation. Centre for Mathematics and Computer Science, University of Utrecht, The Netherlands. 2000a
35. van Dongen S. MCL—an algorithm for clustering graphs. Available:http://micans.org/mcl/ 2000b.
36. Bader GD, Hogue CW (2003) An automated method for finding molecular complexes in large protein interaction networks. BMC Bioinformatics 4: 2. PMID:12525261
37. Newman MEJ, Girvan M (2004) Finding and evaluating community structure in networks. Phys Rev E 69: 026113. PMID:14995526
38. Morris JH, Apeltsin L, Newman AM, Baumbach J, Wittkop T, Su G, et al. (2011) clusterMaker: a multi-algorithm clustering plugin for Cytoscape. BMC Bioinformatics 12: 436. doi: 10.1186/1471-2105-12-436PMID:22070249
39. Su G, Kuchinsky A, Morris JH, States DJ, Meng F (2010) GLay: community structure analysis of biologi-cal networks. Bioinformatics 26: 3135–3137. doi:10.1093/bioinformatics/btq596PMID:21123224
40. Lee SH, Park BH, Sharma A, Dang CG, Lee SS Choi TJ et al. (2014) Hanwoo cattle: origin, domestica-tion, breeding strategies and genomic selection. Journal of Animal Science and Technology 56: 2. doi: 10.1186/2055-0391-56-2
41. Dinh P, Sotiriou C, Piccart MJ (2007) The evolution of treatment strategies: aiming at the target. Breast 16: S10–6. PMID:17764940
42. Park C, Falls W, Finger JH, Longo-Guess CM, Ackerman SL (2002) Deletion in Catna2, encoding alpha N-catenin, causes cerebellar and hippocampal lamination defects and impaired startle modula-tion. Nat Genet 31: 279–84. PMID:12089526
43. Togashi H, Abe K, Mizoguchi A, Takaoka K, Chisaka O, Takeichi M (2002) Cadherin regulates dendritic spine morphogenesis. Neuron 35: 77–89. PMID:12123610
44. Abe T, Takagi N, Nakano M, Furuya M, Takeo S (2004) Altered Bad localization and interaction between Bad and Bcl-xL in the hippocampus after transient global ischemia. Brain Res 1009: 159–68.
PMID:15120593
45. Kang JS, Mulieri PJ, Hu Y, Taliana L, Krauss RS (2002) BOC, an Ig superfamily member, associates with CDO to positively regulate myogenic differentiation. EMBO J 21: 114–24. PMID:11782431
46. Kang JS, Feinleib JL, Knox S, Ketteringham MA, Krauss RS (2003) Promyogenic members of the Ig and cadherin families associate to positively regulate differentiation. Proc Natl Acad Sci U S A. 100: 3989–94. PMID:12634428
47. Kang JS, Yi MJ, Zhang W, Feinleib JL, Cole F, Krauss RS (2004) Netrins and neogenin promote myo-tube formation. J Cell Biol 167: 493–504. PMID:15520228
48. Reactome pathway:http://www.reactome.org/PathwayBrowser/#REACT_21402
49. Andrés V, Walsh K (1996) Myogenin expression, cell cycle withdrawal, and phenotypic differentiation are temporally separable events that precede cell fusion upon myogenesis. J Cell Biol 4: 657–66.
50. Li Y, Xu Z, Li H, Xiong Y, Zuo B (2012) Differential transcriptional analysis between red and white skele-tal muscle of Chinese Meishan pigs. Int J Biol Sci 6: 350–360. PMID:20617128
51. Monnier N, Ferreiro A, Marty I, Labarre-Vila A, Mezin P, Lunardi J (2003) A homozygous splicing muta-tion causing a deplemuta-tion of skeletal muscle RYR1 is associated with multi-minicore disease congenital myopathy with ophthalmoplegia. Hum Mol Genet 12: 1171–8. PMID:12719381
52. Lee J, Lee J (2013) Hidden information revealed by optimal community structure from a protein-com-plex bipartite network improves protein function prediction. PLOS ONE 8:e60372. doi:10.1371/journal. pone.0060372. 23577106PMID:23577106
53. Malik A, Lee J, Lee J (2014) Community-based network study of protein-carbohydrate interactions in plant lectins using glycan array data. PLOS ONE 9:e95480. doi:10.1371/journal.pone.0095480PMID: 24755681
54. Firoz A, Malik A, Singh SK, Jha V, Ali A (2014) Comparative Analysis of Glycogene Expression in Dif-ferent Mouse Tissues Using RNA-Seq Data. Int J Genomics 837365. doi:10.1155/2014/837365. 25121089
55. Desaphy JF, De Luca A, Camerino DC (1998) Blockade by cAMP of native sodium channels of adult rat skeletal muscle fibers. Am J Physiol 275: C1465–72. PMID:9843707