Ratio of RANKL/OPG mRNA Expression in Mesenchymal
Stem Cells by Suppressing Leptin
Der-Chih Yang1,4, Huey-Jen Tsay3, Shan-Yang Lin4, Shih-Hwa Chiou1,4, Mei-Jane Li4, Tai-Jay Chang4, Shih-Chieh Hung1,2,4,5*
1Institute of Clinical Medicine, National Yang-Ming University, Taipei, Taiwan,2Institute of Pharmacology, National Yang-Ming University, Taipei, Taiwan,3Institute of Neuroscience, National Yang-Ming University, Taipei, Taiwan,4Department of Medical Research and Education, Veterans General Hospital - Taipei, National Yang-Ming University, Taipei, Taiwan,5Department of Orthopaedics and Traumatology, Veterans General Hospital - Taipei, National Yang-Ming University, Taipei, Taiwan
Abstract
Background:Mesenchymal stem cells (MSCs) are a pluripotent cell type that can differentiate into adipocytes, osteoblasts and other cells. The reciprocal relationship between adipogenesis and osteogenesis was previously demonstrated; however, the mechanisms remain largely unknown.
Methods and Findings:We report that activation of PKA by 3-isobutyl-1 methyl xanthine (IBMX) and forskolin enhances adipogenesis, the gene expression of PPARc2 and LPL, and downregulates the gene expression of Runx2 and osteopontin, markers of osteogenesis. PKA activation also decreases the ratio of Receptor Activator of the NF-kB Ligand to Osteoprotegerin (RANKL/OPG) gene expression – the key factors of osteoclastogenesis. All these effects are mediated by the cAMP/PKA/CREB pathway by suppressing leptin, and may contribute to PKA stimulators-induced in vivo bone loss in developing zebrafish.
Conclusions:Using MSCs, the center of a newly proposed bone metabolic unit, we identified cAMP/PKA signaling, one of the many signaling pathways that regulate bone homeostasis via controlling cyto-differentiation of MSCs and altering RANKL/OPG gene expression.
Citation:Yang D-C, Tsay H-J, Lin S-Y, Chiou S-H, Li M-J, et al (2008) cAMP/PKA Regulates Osteogenesis, Adipogenesis and Ratio of RANKL/OPG mRNA Expression in Mesenchymal Stem Cells by Suppressing Leptin. PLoS ONE 3(2): e1540. doi:10.1371/journal.pone.0001540
Editor:Neil Hotchin, University of Birmingham, United Kingdom
ReceivedJuly 26, 2007;AcceptedJanuary 11, 2008;PublishedFebruary 6, 2008
Copyright:ß2008 Yang et al. This is an open-access article distributed under the terms of the Creative Commons Attribution License, which permits
unrestricted use, distribution, and reproduction in any medium, provided the original author and source are credited.
Funding:National Scientific Council (NSC-95-2314-B-075-047-MY3, NSC-95-2627-B-010-009-, NSC-96-2627-B-010-009-) and grants from National Yang-Ming University, Ministry of Education, Aim for the Top University Plan, and Veterans General Hospital-Taipei (V95E1-002 & V95E1-003).
Competing Interests:The authors have declared that no competing interests exist.
*E-mail: [email protected]
Introduction
Bone remodeling has long been considered to be controlled through the bone multicellular or metabolic unit (BMU), which contains two cellular activities: osteoclastic bone resorption and osteoblastic bone formation. However, recent genetic studies have shown that there is no obligatory tight cross-control of bone formation and bone resorptionin vivo. In osteopetrotic patients, the osteoclasts are either absent or non-functional, yet bone formation is unaltered [1]. The osteopenic transgenic mice, in which osteoblast ablation leads to a complete arrest of bone formation accompanied by bone loss, illustrate that the bone-resorption function is also independent of bone formation [2].
Several tissues constitute the skeletons, including bone, bone marrow, periosteum, perichondrium and cartilage. Therefore, it is possible that cells other than osteoblasts or osteoclasts are involved in bone remodeling. Mesenchymal stem cells (MSCs), first isolated and referred as mechanocytes or CFU-F cells by Friedenstein [3], can be derived from the bone marrow [4], trabecular bone [5] or dental root [6], have the capacity of self-renewal and can differentiate into several distinct cell types, including osteoblasts
and adipocytes. The differentiation of MSCs into either osteoblasts or adipocytes is exclusively and transcriptionally regulated by two key transcription factors, Runx2 (also called Cbfa1) and PPARc, respectively [7–11]. An inverse relationship between the differen-tiation of adipocytes and osteoblasts was demonstrated in cell and animal models and was found in various human diseases [12]. For example, decreased bone formation is accompanied by an increase in bone marrow adipogenesis in age-, immobility- and corticoste-roid-associated osteoporosis [13–15]. However the signaling pathways and molecular mechanisms that regulate this still remain largely unknown [16].
demonstrated to induce neuronal differentiation in a number of primary or cloned neural precursor cells derived from the CNS [18,19], and induce neuronal differentiation and neurite out-growth in MSCs [20]. An elevated plasma and urinary cAMP has long been found in osteoporotic patients [21], however, it is unclear where cAMP/PKA signaling plays an important role in controlling bone homeostasis and regulating cyto-differentiation of MSCs. In an attempt to investigate this issue in the current study, we indeed found that the addition of stimulators of cAMP/PKA signaling in a defined adipocyte induction medium (AIM) enhanced MSC adipogenesis and also found that cAMP/PKA signaling inhibited MSC osteogenesis. Thus, the current study provides a possible molecular mechanism for the reciprocal relationship between adipogenesis and osteogenesis, a well known differentiation phenotype.
Methods Cells
Primary MSCs were isolated from iliac crest of donors with informed consents and grown in DMEM-LG (Invitrogen, Grand Island, NY) supplemented with 10% fetal bovine serum (FBS, Invitrogen), 100 U/ml penicillin, 10 Ag/ml streptomycin, and 0.25mg/ml amphotericin B at 37uC under 5% CO2 atmosphere. The medium was changed twice a week and a subculture was performed at 1:3 to 1:5 split every week. The human MSC strain has been described previously and was originally derived from the bone marrow of a 61-year-old female donor. This strain has been transfected with a plasmid containing the type 16 human papilloma virus proteins E6/E7 [22]. This strain is now referred to as KP-MSCs and grown in the same culture condition with primary MSCs. Using flow cytometry, KP-MSCs express CD29 (a1 integrin), CD44 (hyaluronan receptor), CD90 (Thy-1), CD105 (endoglin), SH2, and SH3 (MSC markers). KP-MSC cells were harvested and used at passages 28–32.
Cytodifferentiation and cell treatments
One day before the initiation of differentiation, cells were seeded in growth medium at a density of 10,000 cells/cm2. For adipogenic induction, the cells were washed twice with PBS (Phosphate buffered saline) and treated in a defined Adipogenic Induction Medium [AIM: DMEM-LG supplemented with 10% FBS, 50mg/ml ascorbate-2 phosphate (Sigma, St. Louis, MO), 1027M dexamethasone (Sigma), 50mg/ml indomethacin (Sigma), and 10mg/ml insulin (Sigma)]. For experiments investigating cAMP/PKA modulators on adipogenic differentiation, cells were treated in AIM with the addition of 0.45 mM 3-isobutyl-1-methylxanthine (IBMX), (Calbiochem, La Jolla, CA), 100mM forskolin (Calbiochem), 11mM Sp-cAMP (Calbiochem), 20mM PKI (Sigma), or 11mM Sp-cAMP+20mM PKI. Medium was changed every 3 days. After the appearance of morphologic features of differentiation, cells were used for histochemical study.
Histochemical study
Cells were washed twice with PBS, fixed in 10% formalin for over 1 hour at room temperature, and stained with Oil Red-O (Sigma) to show adipogenic differentiation for 2 hours. The Oil Red-O working solution was prepared by mixing 15 ml of a stock (0.5% in isopropanol) and 10 ml of distilled water and filtering through a PDVF membrane (0.2mm) filter. Quantification of lipid accumulation was achieved by extracting Oil Red-O from stained cells with isopropanol and measuring the OD of the extract at 510 nm using an ELISA reader (Sepctra MAX 250; Molecular Devices, Sunnyvale, CA).
Measurement of leptin secretion
Leptin secretion was measured using commercially available ELISA kits according to the manufacturer’s instructions (Bio-Source International, Camarillo, CA) to determine the concen-tration of leptin in the conditioned medium of cells cultured in complete growth medium or in AIM with or without the PKA modulators.
Reverse transcription-polymerase chain reaction (RT-PCR)
Total RNA was extracted using the Trizol reagent (Invitrogen) according to the manufacturer’s specifications. First strand cDNA synthesis was performed using Superscript III reverse transcriptase (Invitrogen), Random primer (Invitrogen), 10 mM dNTPs (In-vitrogen), 56 First Strand synthesis buffer, 0.1 M DTT, and
RNaseOUT ribonuclease RNase inhibitor (Invitrogen). PCR was performed using cDNA as the template in a 50ml reaction mixture containing a specific primer pair of each cDNA according to the published sequences (Table 1). Each cycle consisted of the following three steps: denaturation for 45 sec at 94uC, annealing for 1 min at 51–58uC, and 90 sec of elongation at 72uC. The reaction products were resolved by electrophoresis on a 1.5% agarose gel and visualized with ethidium bromide.
Real-Time RT PCR
Expressions of the target gene PPARc2, Runx2, RANKL, OPG and the endogenous reference GAPDH were quantified using primers, probes, and standards. The primers and TaqMan probes were designed using the software Primer Express (Applied Biosystems, Warrington, UK). RT-PCR was performed according to a TaqMan two-step method using an ABI PRISM 7700 sequence detection system (Applied Biosystems). The non-template controls, standard dilutions, and tumor samples were assayed. Total RNA isolated from MSCs treated in various conditions was reversely transcribed to cDNA using an oligo deoxythymidine primer. A 20ml volume of PCR reaction mixture was used containing 50 ng of the sample cDNA: 9ml; 206Target Assay Mix or 206Endogenous
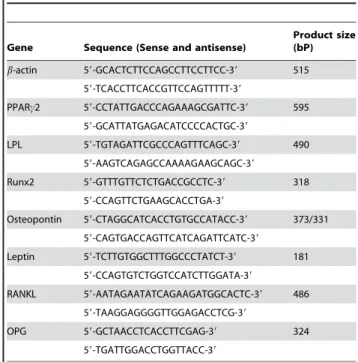
Table 1.PCR primers
Gene Sequence (Sense and antisense)
Product size (bP)
b-actin 59-GCACTCTTCCAGCCTTCCTTCC-39 515
59-TCACCTTCACCGTTCCAGTTTTT-39
PPARc2 59-CCTATTGACCCAGAAAGCGATTC-39 595
59-GCATTATGAGACATCCCCACTGC-39
LPL 59-TGTAGATTCGCCCAGTTTCAGC-39 490
59-AAGTCAGAGCCAAAAGAAGCAGC-39
Runx2 59-GTTTGTTCTCTGACCGCCTC-39 318
59-CCAGTTCTGAAGCACCTGA-39
Osteopontin 59-CTAGGCATCACCTGTGCCATACC-39 373/331
59-CAGTGACCAGTTCATCAGATTCATC-39 Leptin 59-TCTTGTGGCTTTGGCCCTATCT-39 181
59-CCAGTGTCTGGTCCATCTTGGATA-39
RANKL 59-AATAGAATATCAGAAGATGGCACTC-39 486
59-TAAGGAGGGGTTGGAGACCTCG-39
OPG 59-GCTAACCTCACCTTCGAG-39 324
59-TGATTGGACCTGGTTACC-39
Control Assay Mix: 1ml; 26TaqMan Universal Master Mix (with or without AmpErase UNG): 10ml (Applied Biosystems). The PCR cycling conditions included an initial phase of 2 min at 50uC, followed by 10 min at 95uC for AmpErase, 45 cycles of 15 min at 95uC and 1 min at 60uC. Real-time amplification of the genes for PPAR c2 (product number Hs00234592_m1), Runx2 (product number Hs00231692_m1), RANKL (product number Hs00243519_m1), OPG (product number Hs00171068_m1), and GAPDH (product number Hs99999905_m1) was performed using the ABI Assays on Demand primersßand TaqmanHuniversal PCR
master mix on the ABI 7500 real-time PCR machine according to the manufacturer’s instructions (Applied Biosystems). Analysis of the results was carried out using the software supplied with the machine. The software calculates PPAR c2, Runx2, RANKL and OPG expression relative to the GAPDH housekeeper gene (delta CT) and then relative to controls (delta delta CT) using the fluorescence threshold of the amplification reaction and the comparative CT method.
Western blot analysis
Protein was extracted from subconfluent cell cultures. The cells (86105) were rinsed with PBS and lysed in 0.2 ml of protein extraction reagent (M-PER, Pierce, Rockford, Illinois) plus protease inhibitor cocktail (HaltTM, Pierce) for 5 min on ice. Protein concentrations were determined using the BCA assay (Pierce). After being heated for 5 min at 95uC in a sample buffer, equal aliquots of the cell lysates were run on a 10% SDS polyacrylamide gel. Proteins were transferred to PVDF membrane filters. The filter was blocked for 1 hour with TBS containing 5% nonfat dry milk and 0.05% Tween 20 and then incubated overnight at 4uC with the primary antibodies. The filter was washed 3 times for 10 minutes each with TBS containing 0.05% Tween 20. Bound primary antibodies were detected by incubating for 1 hour with horseradish peroxidase-conjugated goat anti-mouse or anti-rabbit IgG (BD PharMingen, San Diego, CA). The filter was washed and developed using a chemiluminescence assay (Perkin Elmer Life Science, Inc., Boston, MA). Densitometric analysis was carried out using Image Master 2D Elite software (Amersham Biosciences). Activation of CREB was detected by Western blot analysis of the phosphorylation state using phospho-CREB antibodies (Cell Signaling Technology). The level of CREB phosphorylation was calculated as the density ratio of bands corresponding to pCREB and CREB.
Protein kinase A catalytic activity assays
cAMP-dependent PKA activities were assayed using the PepTag Assay for nonradioactive detection of PKA (Promega, Madison, WI) on the basis of the phosphorylation of fluorescent-tagged PKA-specific peptides. The cell lysate for PKA protein was prepared using a hypotonic extraction buffer (20 mM Tris, pH 7.5, 5 mM EDTA, 1 mM PMSF, and 10 mg/ml aprotinin). Aliquots of the PKA preparation and PKA catalytic subunit as a positive control were incubated for 30 min at 30uC in PepTag PKA 56reaction buffer (100 mM Tris-HCl, pH 7.4, 50 mM MgCl2, and 5 mM ATP) and 0.4mg/ml of the PKA-specific peptide substrate PepTag A1 (L–R–R–A–S–L–G; Kemptide). The reaction was stopped by heating for 10 min at 95uC. Phosphor-ylation of the PKA-specific substrates was used to measure kinase activity. Phosphorylated and unphosphorylated PepTag peptides were separated on a 0.8% PH 8.0 Tris-HCl agarose gel by electrophoresis. For the PKA assays, 10mg of protein was applied.
DNA delivery methods
For transfection of cells with pmaxGFP or pcDNA3 or pcDNA3-CREBR287L, Nucleofector technology (AMAXA
Bio-systems, Cologne, Germany) was used with each nucleofection sample containing 4mg of DNA, 46105 cells, and 100ml of Human MSC Nucleofector Solution. The transfection was carried out under the program C-17 of the Nucleofector device, as recommended by the manufacturer. The transfected cells were then suspended in an appropriate volume of 20% FBS supplemented DMEM-LG medium and seeded for further culture. After 24 hours of incubation, the medium was replaced by AIM with 100mM Forskolin for 3 days. The efficiency of transfection as evaluated by the expression of EGFP in cells transfected with pmaxGFP vector was more than 50%.
Zebrafish maintenance and histological staining
Zebrafish embryos were maintained in Embryo Medium at 28uC. To visualize developing bone, the embryos were immobi-lized in ice water, then fixed for 24 hours in buffered 4% paraformaldehyde. After washing twice in PBS, they were dehydrated in 50% and 100% ethanol each for 24 hours. They were placed in 0.05 mg/ml Alcian Blue in 3:7 glacial acetic acid : 100% ethanol for 20 min. Alcian Blue-stained zebrafish were then cleared in 1% KOH for one hour. The fish were then transferred to 2 mg/ml Alizarin Red in 1% KOH for 1 hour and cleared in 20% glycerol in 1% KOH for 40 min. Alizarin Red-stained zebrafish were photo-pictured or preserved in 50% and then 80% glycerol in 95% ethanol, followed by 100% glycerol.
Raman microspectroscopic study
Each specimen for spectroscopic study was dried at 25uC, 50% relative humidity (RH) for one week, and then immediately measured. The biophysical characteristics and molecular compo-sitions of the excised samples were determined by using a dispersive micro-Raman spectrophotometer (Ventuno, Jasco Co., Tokyo, Japan) equipped with a 30 mW green (532 nm) solid-state laser as standard. The pixel resolution was 1.3 cm21. The spectra were obtained in the 400–4000 cm21range [23].
Vibrational spectroscopic study
The calcified sample was dried for one week at 25uC, 50% RH condition, and then used for spectral investigation to determine its biophysical characteristics and molecular compositions by using both Fourier transform infrared (FTIR) microspectroscopy (Micro FTIR-200, Jasco Co.) with transmission technique and confocal micro-Raman spectrophotometer (Ventuno, Jasco Co., Tokyo, Japan) equipped with a 30 mW green (532 nm) solid-state laser as standard via non-destructive analysis [23].
Results
PKA stimulators enhance adipogenesis, inhibit
osteogenesis and decrease the ratio of RANKL/OPG gene expression
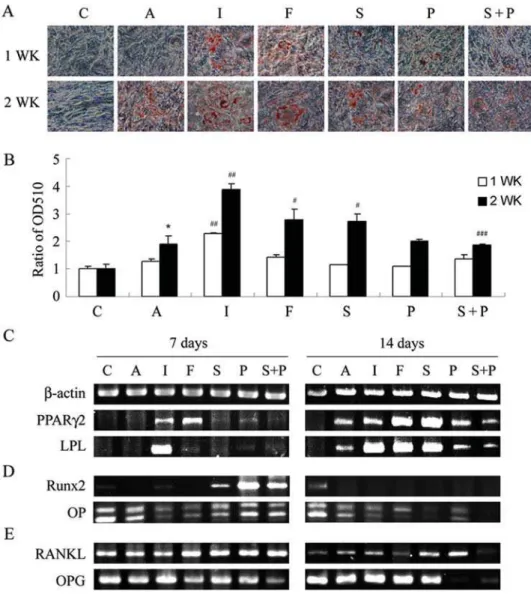
on adipogenesis [22]. To investigate the role of the cAMP/PKA signaling pathway in MSC differentiation, we first compared the effects of several modulators of the cAMP/PKA pathway, including stimulators such as IBMX, forskolin, and Sp-cAMP, inhibitors such as PKI and combinations of both on the adipogenesis of MSCs by measuring Oil Red-O staining (Fig. 1A and 2A). Both KP- and primary MSCs treated in AIM began to initiate adipogenesis, and the extension of treatment for 2 weeks significantly increased the intensity of Oil Red-O staining (Fig. 1A and 2A). However, incubation of KP-MSCs in a complete growth medium did not induce any increase in Oil Red-O staining, suggesting that the cells did not undergo spontaneous differenti-ation into adipocytes. Interestingly, IBMX added in AIM further increased Oil Red-O staining both at 7 and 14 days (Fig. 1B and 2B). The substitution of IBMX with either forskolin or Sp-cAMP significantly increased Oil Red-O staining at day 14 in comparison with the AIM group. The addition of PKI in AIM did not cause
any significant change in Oil Red-O staining, whereas, PKI significantly inhibited the stimulatory effect of IBMX , forskolin or Sp-cAMP on Oil Red-O staining as compared with the IBMX , forskolin or Sp-cAMP group at 14 days (Fig. 1B and 2B). Meanwhile, the effect of IBMX, forskolin or Sp-cAMP on lipid vesicle appearance was also inhibited by the addition of PKI (data not shown).
The effects of PKA modulators on KP-MSC adipogenesis was further investigated by RT-PCR to determine the mRNA expression of the key transcription factor, PPARc2, and a lineage marker of adipocytes, LPL (Fig. 1C). PPARc2 and LPL were not detected from cells in complete growth medium at 7 and 14 days or in AIM at day 7, but they could be detected in AIM at day 14, further confirming the initiation of adipogenesis in AIM but not in the complete growth medium. When adding IBMX or other PKA stimulators such as forskolin and Sp-cAMP in AIM, the expression of PPARc2 and LPL mRNA was up-regulated either at 7 or
Figure 1. PKA modulators influence adipogenesis, gene expression for adipogenesis, osteogenesis and osteoclast-inducing factors in KP-MSCs. (A)Enhancement of adipogenesis by IBMX, forskolin and Sp-cAMP. Cells were treated in complete growth medium [C] or in adipocyte induction medium without [A] or with the indicated modulator of PKA activity [I: IBMX (0.45 mM), F: forskolin (100mM), S: Sp-cAMP (11mM), P: PKI (20mM), S+P: Sp-cAMP+PKI] for 7 and 14 days. Differentiated adipocytes were detected by the accumulation of lipids, which were stained with Oil Red O.(B)Oil Red O staining as OD510. The results displayed in the bar graphs are quantitative analytic data from three independent experiments and are presented as the meanSD values. Each ratio was normalized to the control, and significance was determined by Student’s t-test. (* p,0.05 versus C;#
p,0.05,# #
,0.01 versus A,# # #
p,0.05 versus S). RT-PCR analysis of gene expression of makers for adipogenesis(C), osteogenesis(D), and osteoclast-inducing factors(E)after treatment with PKA modulators.
14 days. Adding PKI in AIM did not result in any significant change in mRNA expression of PPARc2 and LPL, whereas, PKI decreased the stimulator effect of Sp-cAMP on mRNA expression of these two genes. Levels of mRNA expression analyzed by real-time RT-PCR in primary MSCs also revealed the same results. Treatment with IBMX and forskolin significantly induced the expression of PPARc2 and the addition of PKI at the same time blocked the inductive effects (Fig. 2C). These results all together suggest a stimulatory role of cAMP/PKA signaling in MSC adipocyte differentiation and a low stimulation of cAMP/PKA signaling in cells treated with AIM.
An inverse relationship between MSC adipogenesis and osteogenesis was well known, therefore, we further investigated the effect of cAMP/PKA signaling pathway on gene expression of Runx2, the earliest transcription factor of osteoblast differentiation [7,8], and one osteoblast lineage markers, osteopontin (OP) (Fig. 1C). The level of Runx2 expression was low in cells treated in complete growth medium, and increased after the extension of the culture period for 14 days. This data support the previous finding that MSCs underwent spontaneous differentiation into osteoblasts when the cells reached confluence. The level of Runx2 expression did not significantly increase in cells treated in AIM
with or without any PKA stimulators. However, a substantial increase in Runx2 expression was observed in cells treated with PKI, suggesting the stimulatory effect of PKA inhibitor on MSC osteogenesis (Fig. 1D). Furthermore, cells treated in AIM without or with the PKA modulators for 14 days, which all expressed PPARc2, did not express any gene expression of Runx2, indicating the inverse relationship between adipogenesis and osteogenesis by MSCs. Cells in growth medium expressed OP and alkaline phosphatase (data not shown) gene expression, suggesting these genes are not exclusively expressed by osteoblasts. However, the gene expression of OP was down-regulated in cells treated in AIM with the addition of a PKA stimulator, including IBMX, forskolin and Sp-cAMP at 7 or 14 days as compared with the expression in AIM (Fig. 1D). Expression of Runx2 mRNA was also significantly increased in primary MSCs when treated with PKI (Fig. 2D). These results all together suggest an inhibitory role of cAMP/PKA signaling in MSC osteoblast differentiation.
Receptor Activators of NF-kB Ligand (RANKL) and osteopro-tegerin (OPG, a decoy receptor for RANKL) coordinate with one another to play a critical role in the regulation of osteoclast formation, and the relative presence of RANKL and OPG dictates osteoclastogenesis [25,26]. PKA stimulators such as IBMX, forskolin and Sp-cAMP, which stimulated the expression of PPARc2, inhibited the expression of RANKL (day 7 versus 14), stimulated the expression of OPG (day 7 versus 14), and thus decreased the RANKL/OPG ratio (Fig. 1E). On the other hand, inhibitors of PKA activity, which stimulated the expression of Runx2, inhibited the expression of OPG (Sp-cAMP+PKI versus PKI in day 7 and day 14), and thereby increased the RANKL/OPG ratio (Fig. 1E). Consistent with the effect in KP-MSCs, PKI also significantly increased the ratio of RANKL/OPG gene expression of primary MSCs when treated in AIM with or without PKA stimulators (Fig. 2E). These data suggest that osteoblast differentiation in MSCs, which is inhibited by cAMP/PKA signaling, is associated with an increase in the RANKL/OPG gene expression ratio.
PKA stimulators stimulate adipogenesis, inhibit
osteogenesis and increase osteoclast-inducing potential via suppressing leptin expression and secretion
Leptin is highly expressed and secreted by adipocytes residing in bone marrow and fat tissues [27]. The leptin secretion from adipocytes, however, is stimulated by insulin, one component of AIM [28,29], and is also regulated by subtracts modulating PKA activity [30]. We, therefore, investigated the role of leptin in PKA stimulators-mediated stimulation of adipogenesis-dependent gene expression, inhibition of osteogenesis-dependent gene expression, and decrease in the ratio of RANKL/OPG gene expression in MSCs. First, we measured leptin levels in cells treated in AIM with or without PKA modulators. The baseline for leptin concentration in a conditioned medium (CM) from cells treated in AIM was around 600 pg/104cells both at 1 and 2 weeks. Treatment with PKA stimulators such as IBMX, forskolin and Sp-cAMP significantly inhibited leptin secretion, although there is less inhibition with Sp-cAMP (Fig. 3A). However, PKA inhibitors caused a significant increase in leptin secretion only at 2 weeks, when comparing the treatments with cAMP and with Sp-cAMP+PKI (Fig. 3A). We, then, studied the expression of mRNA encoding for leptin as a possible explanation for the decrease in leptin secretion. At first, we found that MSCs expressed mRNA for leptin receptor (OB-R), and neither incubation in AIM nor treatment with PKA stimulators or inhibitors caused any significant change. The baseline for leptin mRNA (OB) in AIM was detectable, and the treatment with PKA stimulators greatly decreased leptin gene expression (Fig. 3B). Coincident with the Figure 2. PKA modulators influence adipogenesis, gene
expres-sion for adipogenesis, osteogenesis and osteoclast-inducing factors in primary MSCs. (A)Enhancement of adipogenesis by IBMX and forskolin. Cells were treated in complete growth medium [C] or in adipocyte induction medium without [A] or with the indicated modulator of PKA activity [I: IBMX (0.45 mM), F: forskolin (100mM), P: PKI (20mM), I+P: IBMX+PKI, F+P: forskolin+PKI] for 7 and 14 days. Differentiated adipocytes were detected by the accumulation of lipids, which were stained with Oil Red O.(B)Oil Red O staining as OD510. The results displayed in the bar graphs are quantitative analytic data from three independent experi-ments and are presented as the meanSD values. Each ratio was normalized to the control, and significance was determined by Student’s t-test. (** p,0.01 versus C;#
p,0.05,# #
,0.01 versus A,# # #
p,0.05 versus I or F). Real-Time RT-PCR analysis of the gene expression ratio of PPARc2/GADPH (C), Runx2/GADPH (D), and RANKL/OPG (E) after treatment with PKA modulators for 7 days.
effect in inhibiting leptin secretion, Sp-cAMP inhibits leptin gene expression to a lesser degree. Interestingly, there was a great increase in leptin gene expression at 2 weeks of cells treated in AIM with IBMX, even though the leptin secretion in these cells was still far below baseline. However, the removal of IBMX from the medium in these cells induced leptin secretion (data not shown). These results are compatible with previous reports that leptin was secreted by adipocytes and suggest IBMX has a direct effect in inhibiting leptin expression and secretion.
To address whether PKA stimulators-mediated leptin suppres-sion may be required for their regulation of MSC differentiation, namely induction of adipogenesis and inhibition of osteogenesis, we investigate whether the effects of PKA stimulators would be
blocked by adding leptin exogenously. This was then demonstrat-ed by the addition of exogenous leptin in cells treatdemonstrat-ed in AIM with forskolin, which inhibited PPARc2 expression, stimulated Runx2 expression and increased the ratio of RANKL/OPG in a dose-dependent manner (Fig. 3C). The effects of exogenous leptin on regulating adipogenic, osteogenic and osteoclast-inducing factor gene expressions were also demonstrated in cells treated in AIM with IBMX when evaluated by real time PCR (Fig. 3D–F). These data clearly answer that PKA stimulators induce adipogenesis, inhibit osteogenesis and decrease the RANKL/OPG gene expression ratio via suppressing leptin expression and secretion.
PKA stimulators increase phosphorylation of CREB to regulate expression of leptin, PPARcand Runx2 and the ratio of RANKL/OPG
To determine whether PKA stimulators activate PKA in MSCs, cells were treated in AIM with IBMX, and PKA activity was assayed in serum-free conditions. Cells treated by serum depletion for 48 hours expressed a baseline of PKA activity, and the level of PKA activation increased immediately, reaching its peak, about threefold of baseline, at 2 hours after induction and gradually returned to the baseline at 24 hours after induction (Fig.4A). In a separate experiment with PKA activity analyzed at 2 hours after induction, while cells in IBMX or forskolin-containing AIM still expressed about twofold PKA activity, addition of the PKA inhibitor, PKI, blocked the activation of PKA by IBMX or forskolin (Fig. 4B). The CREB-binding protein transcriptional coactivator is an important regulator of gene expression through its ability to interact and cooperate with several transcription factors, such as CREB in response to cAMP/PKA signaling. Like its effect on modulating PKA activities in an induction medium, IBMX in AIM also phosphorylated CREB. CREB phosphorylation reached a peak level, more than fourfold the baseline, at 2 hours after induction, and maintained a twofold expression of the baseline level after 24 hours of induction (Fig. 4C and 4D). Similar to the block of PKA activity by PKI, phosphorylation of CREB by IBMX or forskolin was also blocked by the addition of PKI (Fig. 4E).
To directly assess the participation of CREB in directing differentiation into adipocytes or osteoblasts and controlling the ratio of RANKL/OPG, a control or a dominant-negative (DN) CREB plasmid, pcDNA3-CREBR287L, was transfected into MSCs before the initiation of differentiation (Fig. 4F). When compared with the control vector, transfection with DN CREB stimulated leptin expression, decreased PPARc2 expression, increased Runx2 expression, and increased the ratio of RANKL/OPG gene expression (Fig. 4G). These results demon-strate that cAMP/PKA/CREB pathway regulates cyto-differenti-ation and osteoclast-inducing potential of MSCs.
Leptin blocks PKA stimulator-induced bone loss in developing zebrafish
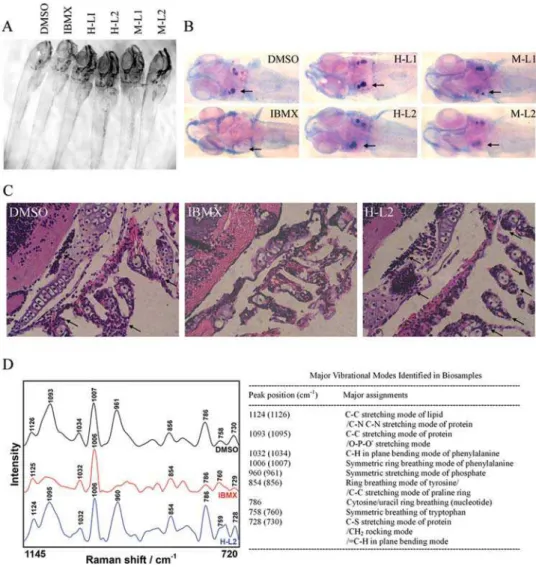
To investigate the in vivo role of activation of cAMP/PKA signaling on bone development, we used a zebrafish vertebrate model system. Since bone development is progressively increased at the beginning of larval stage embryos, IBMX treatment was initiated at 2 dpf (days after fertilization) [31]. The IBMX-treated embryos survived and had normal morphology for up to 8 dpf (Fig. 5A). Bone development was visualized in whole embryos by Alizarin Red S staining (Fig. 5B), along with hematoxylin-and-eosin staining of thin sections (Fig. 5C). In normal and vehicle (DMSO)-treated control embryos, mineralization as indicated by positive Alizarin Red S staining was apparent at the otoliths, and extensive skeletal development was evident in the cranial and Figure 3. PKA stimulators regulate gene expression for
adipogenesis, osteogenesis and osteoclast-inducing factors by suppressing leptin. (A,B) Suppression of leptin secretion and transcription by IBMX, forskolin and Sp-cAMP. Cell treatments were the same as Fig. 1.(A)Leptin concentrations in the conditioned medium of the last 2 days were measured by ELISA and normalized by cell numbers. The figure shows representative data from two independent experiments with three replicates for each condition; data are presented as the meanSD values, and significance was determined by Student’s t-test. (**,0.01 versus A;#
,0.05 versus S)(B)RT-PCR analysis of mRNA for leptin andb-actin.(C)Exogenous leptin inhibits forskolin-induced effects on gene expression of PPARc2 and Runx2 and the RANKL/OPG gene expression ratio. Cells were cultured in complete growth medium [C] or treated in AIM with 100mM forskolin [F] in the absence or presence of leptin (0.6, 1.5, 3mg/ml) for 7 days. RT-PCR analysis forb-actin, PPARc2, Runx2, RANKL and OPG. Real-Time RT-PCR analysis of the gene expression ratio of PPARc2/GADPH (D), Runx2/ GADPH(E), and RANKL/OPG.(F). Exogenous leptin inhibits the effects of AIM with IBMX (I: AIM with 0.45 mM IBMX) on gene expression of PPARc2, Runx2 and the RANKL/OPG gene expression ratio.
pharyngeal region at 8 dpf (normal, n = 10; control, n = 8). No bone formation was observed in any of the IBMX-treated embryos at 8 dpf (n = 19). Although, leptin was identified in fish using an antibody against mouse leptin, the fish leptin is still not isolated [32]. Therefore, we use leptin both from human and mouse to investigate leptin effects on zebrafish bone formation. Interesting-ly, human and mouse leptin block IBMX-induced bone loss both at 0.6 and 1.5mg/mL (H-L1, n = 14; H-L2, n = 15; M-L1, n = 17; M-L2, n = 14). These results were further evidenced by micro-scopic Raman spectroscopy (Fig. 5D). All of the embryos displayed
a similar peak at 1007 cm21that is assigned to phenylalanine and frequently maintains unchanged at different samples. A unique feature in the Raman spectrum of IBMX-treated embryos was a lack of the large peak at 961 cm21and 1095 cm21corresponding to then1 symmetric stretching mode of the phosphate group of
hydroxyapatite and the C-C stretching mode of protein/ phosphate stretching mode of DNA and RNA, respectively (Fig. 5D). The former is an indication of bone formation, the latter is a predominant signal of DNA/RNA formation [33]. The value of peak intensity ratio of 961 cm21/1007 cm21, as a Figure 4. PKA stimulators increase phosphorylation of CREB to regulate gene expression of leptin, PPARc2 and Runx2 and the RANKL/OPG ratio.Cells were treated in AIM with IBMX (0.45 mM) after serum starvation for 48 hours.(A)PKA activity increased immediately and reached the peak at 2 hours and gradually returned to the baseline at 24 hours.(B)Cells were treated in AIM with different combinations of IBMX (0.45 mM), forskolin (100mM), and PKI (20mM), and PKA activities were measured at 2 hours after treatment.(C,D)The same experiment of(A). Level of CREB phosphorylation was indicated as ratio of pCREB/CREB protein level.(E)The same experiment of(B)Levels of CREB phosphorylation were measured at 2 hours after treatment. Data are presented as the mean6SD values of three separate experiments, and significance was determined by Student’s t-test. (* p,0.05, ** p,0.01 versus the baseline).(F,G)Suppression of forskolin-induced modulation of gene expression of leptin, PPARc2, Runx2, RANKL and OPG by transfection with DN CREB. Cells were transfected with control (pcDNA3) or DN CREB vector for 48 hours, followed by treatment in AIM with forskolin (100mM) for 3 days.(F)Western blot analysis of CREB protein in the transfected cells.(G)RT-PCR analysis of gene expression in transfected cells. Transfection with DN CREB abrogated forskolin-induced block of leptin expression, initiation of PPARc2 expression, and inhibition of Runx2 expression, and increased the ratio of RANKL/OPG gene expression.
biomarker to investigate the extent of bone formation, was 0.82, 0.15 and 0.91 for DMSO, IBMX and IBMX with leptin, respectively. The similar value of 1095 cm21/1007 cm21for DMSO and IBMX with leptin suggests that both samples had the same phosphate group in the backbone conformations of RNA and DNA after embryo development, as compared with the smaller value of 1095 cm21/ 1007 cm21for IBMX. These findings confirm a critical role for leptin involvement in cAMP/PKA signaling-mediatedin vivobone loss in developing zebrafish. We were unable to investigate the role of leptin in adipogenesis in these embryos, because adipocytes have not been described in teleosts, and in other vertebrate species, fat deposition does not occur until the postnatal period.
Discussion
The cAMP/PKA pathway has been demonstrated in 3T3-L1 cells, murine preadipocytes, to stimulate adipogenesis by activating the transcription factor CREB [34,35]. However the direct effects of cAMP/PKA on the differentiation of MSCs are not well studied. In
the current report, we explored the direct involvement of cAMP/ PKA signaling in regulating MSC differentiation and its ability to control osteoclastogenesis. The addition of PKA stimulators in AIM enhanced Oil Red-O staining and the expression of markers for adipocytes (PPARc2 and LPL), inhibited the expression of markers for osteoblasts (Runx2 and Op), and increased the RANKL/OPG ratio at the mRNA level. We further demonstrated that PKA stimulators repressed leptin synthesis and secretion in MSCs and that the effects of PKA stimulators on MSCs were blocked by the administration of exogenous leptin. These data suggest that PKA stimulators exerted their effects on MSCs via the repression of endogenous leptin. Furthermore, the direct participation of CREB in the effects of PKA stimulators was demonstrated through the use of a DN CREB plasmid, which blocked the effects of the PKA stimulator when transfected into cells before differentiation. These results suggest that cAMP-dependent PKA activity is sufficient to increase CREB activity and to regulate three distinct lineage differentiations (adipogenesis, osteogenesis and osteoclastogenesis) that are involved in bone homeostasis.
Figure 5. Leptin abrogates IBMX-induced lack of skeletal ossification in developing zebrafish.Embryos were treated in vehicle DMSO, IBMX (0.045 mM), and IBMX with human [H] or mouse [M] leptin (L1: 0.6mg/mL, L2: 1.5mg/mL) at 2 dpf.(A)Morphology of embryos at 8 dpf.(B) Alizarin Red S and alcian blue staining of whole zebrafish reveals normal skeletal ossification in DMSO-treated embryos at otolith (arrow), while absent skeletal ossification is evident in IBMX-treated embryos. The addition of human and mouse leptin both in low and high concentrations abrogates IBMX-induced absence of skeletal ossification. (C) Hematoxylin-and-eosin staining of zebrafish sections reveals impaired bone development in IBMX-treated embryos. Arrows indicate bone development with cell aggregation at otolith and pharyngeal arches.(D)Raman microspectroscopic analysis of bone development at otolith in zebrafish.
However, the effects of IBMX, forskolin and Sp-cAMP on levels of gene expression were inconsistent in some situations, such as the mRNA level of Runx2 after stimulation with Sp-cAMP for 7 days. To understand the underlying mechanism, the abilities of these three reagents to activate PKA have been compared with those of IBMX and forskolin stronger than that of Sp-cAMP (data not shown), which may be used to explain how cells treated with Sp-cAMP still expressed Runx2.
In vitrostudies established that leptin enhanced the osteogenesis of human stromal cells, increased mineralization of the extracel-lular matrix, but inhibited adipogenesis [36,37]. Similar findings have been obtained with other cell models [38]. However, it is not clear from the animal studies whether leptin is a stimulator or an inhibitor of bone growth, as intracerebroventricular infusion of leptin affects bone mass and returns the high bone mass phenotype in ob/ob mice back to wild-type levels [39], whereas systemic administration has been reported to induce loss of bone marrow adipocytes and increase bone formation in ob/ob mice [27,40,41] and to reduce bone loss in ovariectomized rats [42] and in tail-suspended female rats [43]. In the current study, we found that the induction of adipogenesis in MSCs was associated with a decrease in leptin secretion and gene expression. The suppression of leptin expression is believed to play a role in the initiation of adipogenesis because the administration of exogenous leptin inhibited adipo-genesis. The addition of exogenous leptin from 0.6 to 3mg/mL not only inhibited the expression of PPARc2, but also stimulated the expression of Runx2 and the ratio of RANKL/OPG gene expression in a dose-dependent manner, indicating that leptin functions as a molecule rheostat that modulates bone homeostasis. Similar in in vitro MSC cultures, the role of leptin on bone homeostasis was also demonstrated in bone development of thein vivozebrafish model. Although plasma leptin levels were reported with diurnal variation and variant among individuals [44], a significant relationship was observed between plasma leptin concentration, and the bone mineral mass and density in healthy elderly men and women [45], and the presence of vertebral fractures in postmenopausal women [46]. These results further support our finding that cAMP/PKA signaling inhibited bone formation by suppressing leptin.
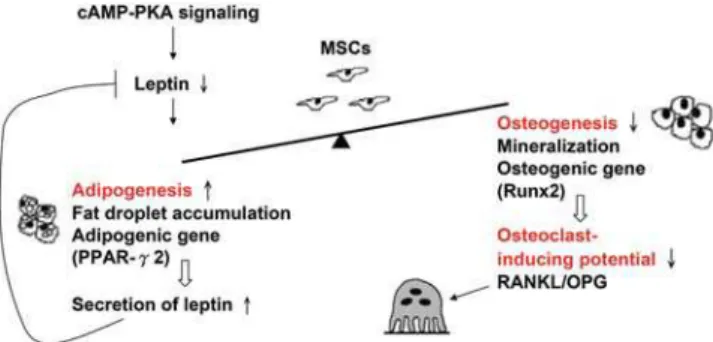
Bone formation has been studied over the past 20 years by investigating the balance between osteoblast and osteoclast function based on the concept that bone homeostasis is controlled by these two cells. In the current paper, we propose a new bone metabolic unit which highlights the role of MSCs, and upon which we identified cAMP/PKA signaling, one of the many signaling pathways that regulate bone homeostasis, which might determine the constitution of the cellular components via directing adipogenesis, osteogenesis and osteoclastogenesis by controlling the release of leptin from MSCs (Fig. 6). This new concept has been supported by a study on MSC differentiation, which has shown that a 14-3-3-binding protein, TAZ, co-activates
Runx2-dependent gene transcription while repressing PPARc2-Runx2-dependent gene transcription [16]. The concept is further supported by a most recent study by Zhao et al. [47]. They wisely identified 53 endogenous candidate suppressors of osteogenic specification by screening a synthetic SiRNA library targeting 5,000 human genes, which when silenced could initiate differentiation of MSCs into osteoblasts. 11 of those selected SiRNAs inhibited adipogenic differentiation of MSCs under conditions that induce adipogenic differentiation. Furthermore, cAMP was also identified to play opposing roles in osteogenesis vs. adipogenesis. The results from this and other studies show that the MSCs may be used to elucidate molecular signaling on the regulation of adult bone homeostasis by investigating the potential to differentiate into adipocytes and osteoblasts and to regulate osteoclastogenesis by changing the ratio of RANKL/OPG gene expression.
Supporting Information
Figure S1 The adipogenic differentiation of primary MSCs as demonstrated by Oil Red O staining. Primary MSCs were induced in AIM with (A) or without (B) 0.45 mM IBMX for 3 weeks.
Found at: doi:10.1371/journal.pone.0001540.s001 (1.85 MB TIF)
Acknowledgments
We would like to thank Dr. Mien-Chie Hung for advice in preparing the article.
Author Contributions
Conceived and designed the experiments: SH DY SC. Performed the experiments: DY HT ML. Analyzed the data: SH DY HT SL ML. Contributed reagents/materials/analysis tools: SH TC. Wrote the paper: SH DY.
References
1. Felix R, Hofstetter W, Cecchini MG (1996) Recent developments in the understanding of the pathophysiology of osteopetrosis. Eur J Endocrinol 134: 143–156.
2. Corral DA, Amling M, Priemel M, Loyer E, Fuchs S, et al. (1998) Dissociation between bone resorption and bone formation in osteopenic transgenic mice. Proc Natl Acad Sci U S A 95: 13835–13840.
3. Friedenstein AJ (1976) Precursor cells of mechanocytes. Int Rev Cytol 47: 327–359.
4. Prockop DJ (1997) Marrow stromal cells as stem cells for nonhematopoietic tissues. Science 276: 71–74.
5. Tuli R, Tuli S, Nandi S, Wang ML, Alexander PG, et al. (2003) Characterization of multipotential mesenchymal progenitor cells derived from human trabecular bone. Stem Cells 21: 681–693.
6. Sonoyama W, Liu Y, Fang D, Yamaza T, Seo BM, et al. (2006) Mesenchymal stem cell-mediated functional tooth regeneration in Swine. PLoS ONE 1: e79. 7. Ducy P, Zhang R, Geoffroy V, Ridall AL, Karsenty G (1997) Osf2/Cbfa1: a
transcriptional activator of osteoblast differentiation. Cell 89: 747–754. 8. Komori T, Yagi H, Nomura S, Yamaguchi A, Sasaki K, et al. (1997) Targeted
disruption of Cbfa1 results in a complete lack of bone formation owing to maturational arrest of osteoblasts. Cell 89: 755–764.
9. Otto F, Thornell AP, Crompton T, Denzel A, Gilmour KC, et al. (1997) Cbfa1, a candidate gene for cleidocranial dysplasia syndrome, is essential for osteoblast differentiation and bone development. Cell 89: 765–771.
10. Tontonoz P, Hu E, Spiegelman BM (1994) Stimulation of adipogenesis in fibroblasts by PPAR gamma 2, a lipid-activated transcription factor. Cell 79: 1147–1156.
11. Rosen ED, Sarraf P, Troy AE, Bradwin G, Moore K, et al. (1999) PPAR gamma is required for the differentiation of adipose tissue in vivo and in vitro. Mol Cell 4: 611–617.
12. Beresford JN, Bennett JH, Devlin C, Leboy PS, Owen ME (1992) Evidence for an inverse relationship between the differentiation of adipocytic and osteogenic cells in rat marrow stromal cell cultures. J Cell Sci 102 ( Pt 2): 341–351. 13. Meunier P, Aaron J, Edouard C, Vignon G (1971) Osteoporosis and the
replacement of cell populations of the marrow by adipose tissue. A quantitative study of 84 iliac bone biopsies. Clin Orthop Relat Res 80: 147–154. 14. Verma S, Rajaratnam JH, Denton J, Hoyland JA, Byers RJ (2002) Adipocytic
proportion of bone marrow is inversely related to bone formation in osteoporosis. J Clin Pathol 55: 693–698.
15. Nuttall ME, Gimble JM (2000) Is there a therapeutic opportunity to either prevent or treat osteopenic disorders by inhibiting marrow adipogenesis? Bone 27: 177–184.
16. Hong JH, Hwang ES, McManus MT, Amsterdam A, Tian Y, et al. (2005) TAZ, a transcriptional modulator of mesenchymal stem cell differentiation. Science 309: 1074–1078.
17. Kvissel A-K, Orstavik S, Oistad P, Rootwelt T, Jahnsen T, et al. (2004) Induction of C[beta] splice variants and formation of novel forms of protein kinase A type II holoenzymes during retinoic acid-induced differentiation of human NT2 cells. Cellular Signalling 16: 577–587.
18. Kim G, Choe Y, Park J, Cho S, Kim K (2002) Activation of protein kinase A induces neuronal differentiation of HiB5 hippocampal progenitor cells. Molecular Brain Research 109: 134–145.
19. Vogt Weisenhorn DM, Roback LJ, Kwon JH, Wainer BH (2001) Coupling of cAMP/PKA and MAPK Signaling in Neuronal Cells Is Dependent on Developmental Stage. Experimental Neurology 169: 44–55.
20. Chu MS, Chang CF, Yang CC, Bau YC, Ho LL, et al. (2006) Signalling pathway in the induction of neurite outgrowth in human mesenchymal stem cells. Cell Signal 18: 519–530.
21. Neelon FA, Birch BM, Drezner M, Lebovitz HE (1973) Urinary cyclic adenosine monophosphate as an aid in the diagnosis of hyperparathyroidism. Lancet 1: 631–633.
22. Hung SC, Yang DM, Chang CF, Lin RJ, Wang JS, et al. (2004) Immortalization without neoplastic transformation of human mesenchymal stem cells by transduction with HPV16 E6/E7 genes. Int J Cancer 110: 313–319. 23. Lin SY, Chen KH, Li MJ, Cheng WT, Wang SL (2004) Evidence of octacalcium
phosphate and Type-B carbonated apatites deposited on the surface of explanted acrylic hydrogel intraocular lens. J Biomed Mater Res B Appl Biomater 70: 203–208.
24. Nakahara H, Bruder SP, Haynesworth SE, Holecek JJ, Baber MA, et al. (1990) Bone and cartilage formation in diffusion chambers by subcultured cells derived from the periosteum. Bone 11: 181–188.
25. Simonet WS, Lacey DL, Dunstan CR, Kelley M, Chang MS, et al. (1997) Osteoprotegerin: a novel secreted protein involved in the regulation of bone density. Cell 89: 309–319.
26. Lacey DL, Timms E, Tan HL, Kelley MJ, Dunstan CR, et al. (1998) Osteoprotegerin ligand is a cytokine that regulates osteoclast differentiation and activation. Cell 93: 165–176.
27. Laharrague P, Larrouy D, Fontanilles AM, Truel N, Campfield A, et al. (1998) High expression of leptin by human bone marrow adipocytes in primary culture. Faseb J 12: 747–752.
28. Glasow A, Kiess W, Anderegg U, Berthold A, Bottner A, et al. (2001) Expression of leptin (Ob) and leptin receptor (Ob-R) in human fibroblasts: regulation of leptin secretion by insulin. J Clin Endocrinol Metab 86: 4472–4479. 29. Barr VA, Malide D, Zarnowski MJ, Taylor SI, Cushman SW (1997) Insulin
stimulates both leptin secretion and production by rat white adipose tissue. Endocrinology 138: 4463–4472.
30. Szkudelski T, Nowicka E, Szkudelska K (2005) Leptin secretion and protein kinase A activity. Physiol Res 54: 79–85.
31. Sierra-Honigmann MR, iacute, Nath AK, Murakami C, Garc, et al. (1998) Biological Action of Leptin as an Angiogenic Factor. Science 281: 1683–1686. 32. Johnson RM, Johnson TM, Londraville RL (2000) Evidence for leptin
expression in fishes. J Exp Zool 286: 718–724.
33. Deng H, Bloomfield VA, Benevides JM, Thomas GJ Jr (1999) Dependence of the Raman signature of genomic B-DNA on nucleotide base sequence. Biopolymers 50: 656–666.
34. Reusch JEB, Colton LA, Klemm DJ (2000) CREB Activation Induces Adipogenesis in 3T3-L1 Cells. Mol Cell Biol 20: 1008–1020.
35. Watanabe M, Inukai K, Katagiri H, Awata T, Oka Y, et al. (2003) Regulation of PPAR gamma transcriptional activity in 3T3-L1 adipocytes. Biochem Biophys Res Commun 300: 429–436.
36. Thomas T, Gori F, Khosla S, Jensen MD, Burguera B, et al. (1999) Leptin acts on human marrow stromal cells to enhance differentiation to osteoblasts and to inhibit differentiation to adipocytes. Endocrinology 140: 1630–1638. 37. Chang YJ, Shih DT, Tseng CP, Hsieh TB, Lee DC, et al. (2006) Disparate
mesenchyme-lineage tendencies in mesenchymal stem cells from human bone marrow and umbilical cord blood. Stem Cells 24: 679–685.
38. Reseland JE, Syversen U, Bakke I, Qvigstad G, Eide LG, et al. (2001) Leptin is expressed in and secreted from primary cultures of human osteoblasts and promotes bone mineralization. J Bone Miner Res 16: 1426–1433.
39. Ducy P, Amling M, Takeda S, Priemel M, Schilling AF, et al. (2000) Leptin inhibits bone formation through a hypothalamic relay: a central control of bone mass. Cell 100: 197–207.
40. Steppan CM, Crawford DT, Chidsey-Frink KL, Ke H, Swick AG (2000) Leptin is a potent stimulator of bone growth in ob/ob mice. Regul Pept 92: 73–78. 41. Hamrick MW, Della-Fera MA, Choi YH, Pennington C, Hartzell D, et al.
(2005) Leptin treatment induces loss of bone marrow adipocytes and increases bone formation in leptin-deficient ob/ob mice. J Bone Miner Res 20: 994–1001. 42. Burguera B, Hofbauer LC, Thomas T, Gori F, Evans GL, et al. (2001) Leptin Reduces Ovariectomy-Induced Bone Loss in Rats. Endocrinology 142: 3546–3553.
43. Martin A, de Vittoris R, David V, Moraes R, Begeot M, et al. (2005) Leptin modulates both resorption and formation while preventing disuse-induced bone loss in tail-suspended female rats. Endocrinology 146: 3652–3659.
44. Schoeller DA, Cella LK, Sinha MK, Caro JF (1997) Entrainment of the diurnal rhythm of plasma leptin to meal timing. J Clin Invest 100: 1882–1887. 45. Zoico E, Zamboni M, Adami S, Vettor R, Mazzali G, et al. (2003) Relationship
between leptin levels and bone mineral density in the elderly. Clin Endocrinol (Oxf) 59: 97–103.
46. Yamauchi M, Sugimoto T, Yamaguchi T, Nakaoka D, Kanzawa M, et al. (2001) Plasma leptin concentrations are associated with bone mineral density and the presence of vertebral fractures in postmenopausal women. Clin Endocrinol (Oxf) 55: 341–347.