Impact of Vehicle Class and Tire Pressure on Pavement
Performance in MEPDG
Mohamed
*I. E. Attia, and Manal
*A. Ahmed
*Assistant Professor, Zagazig University, Zagazig, Egypt
ABSTRACT
The new Mechanistic-Empirical Pavement Design Guide (MEPDG) design and analysis procedures defines the exact traffic loading by defining the specific number of each vehicle class and the use of axle load distribution factors instead of the equivalent single axle load (ESAL). The number of traffic inputs (parameters) in MEPDG was found to be 17024. This research aimed to evaluate the sensitivity of the predicted flexible pavement distress to vehicle class and tire pressure in MEPDG. To evaluate the impact of vehicle (truck) class on pavement sections, different cases of loading were analyzed. For each case, the MEPDG Ver. 1.1 was used to evaluate the effect of tire pressure by solving each case for a tire pressure of 120 and 140 psi. The effect of the traffic parameters on asphalt pavement (AC) rutting, base rutting, subgrade rutting, international roughness index (IRI), longitudinal cracking and fatigue (alligator) cracking were investigated.
It was found that vehicle class distribution (VCD) would cause clear impact (comparable to the effect of AADTT level) only if the major traffic is of specific class (very light or very heavy). If this is not the case, the vehicle class distribution will not be a significant factor that affects the final design because most of the trucks had similar impact on flexible pavement distresses. The impact of tire pressure is clear on longitudinal cracking, fatigue cracking and AC rutting, and have no significant impact on both base and subgrade rutting.
Key Words
:
MEPDG, Traffic Analysis, Flexible Pavement, Tire Pressure, Vehicle Class DistributionI.
INTRODUCTION
The Pavement design and analysis procedures contained in the new Mechanistic-Empirical Pavement Design Guide (MEPDG) represent a significant advances from those empirical procedures used in the American Association of State Highway and Transportation Officials (AASHTO) 1993 Guide as stated by many researchers [1-13]. One major enhancement in the analysis procedure is related to traffic inputs. The MEPDG define the exact traffic loading by defining the specific number of each truck class and the use of axle load distribution factors (ALDF) , or axle load spectra (ALS), rather than the traditional equivalent single axle load (ESAL) input in current procedures .
Through reviewing the MEPDG, the number of traffic inputs (parameters) was found to be 17024. Though many researchers investigated different traffic inputs in MEPDG and their impact on the predicted distress, limited work was conducted to evaluate and understand the effect of tire pressure and vehicle class in MEPDG on the predicted pavement distress.
The main objective of this study is to evaluate the sensitivity of the predicted flexible pavement distress to vehicle class and tire pressure in MEPDG. This objective can be achieved through the steps:
1. Review the current state of knowledge regarding the effect of different traffic inputs
in MEPDG on predicted flexible pavement distress.
2. Improve the understanding of the sensitivity of the predicted flexible pavement distress to vehicle class and tire pressure.
II.
Review of Traffic Inputs in MEPDG
Several reports and papers [1-13] summarized the main traffic inputs in the MEPDG and the effect of those inputs on predicted distress in MEPDG, the main elements of traffic inputs are summarized in the following section along with summary for their impact on flexible pavement distress.
Traffic Volume Basic Information
Two-way annual average daily truck traffic (AADTT) is considered the key element in traffic parameters and was found to directly affect predicted distress [7, 14], where as the three parameters: number of lanes, percent truck in design lane and percent truck in design direction are expected to affect the number of load repetition on pavement section and thus affect the predicted distress. It was reported that operational speed has no impact on predicted distress [7].
Axle load Distribution Factors (ALDF)
The axle load distribution factors represent the frequency of the total axle applications within each
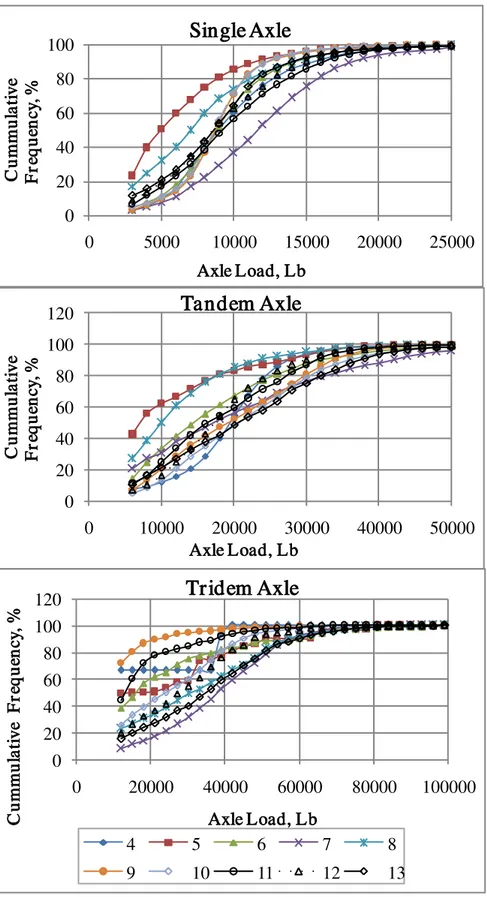
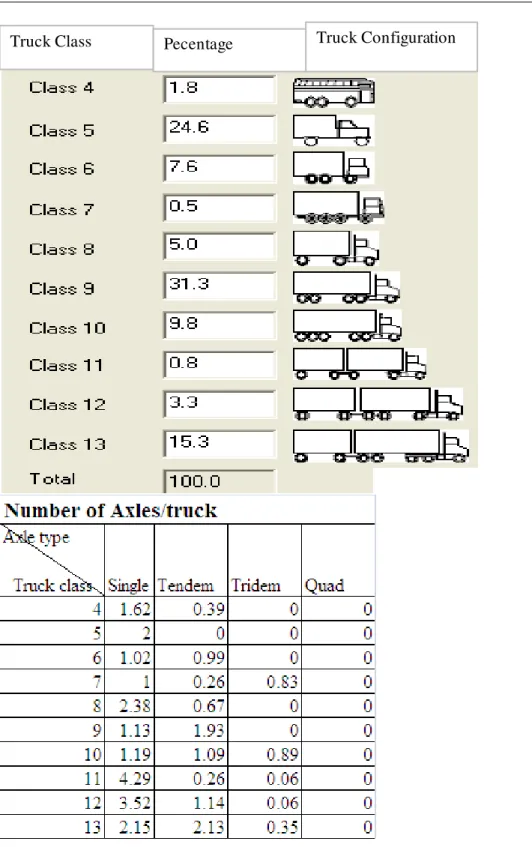
load interval for the four basic types of axle configurations (single, tandem, tridem and quad), for each vehicle class. MEPDG has 10 vehicle classes starting from Class 4 through Class 13 [3,4 ].Through working with the MEPDG it was found that the total number of axle load factors = 16800 input {12 months*10 truck classes* [39 possible loads*2 axle types (single, tandem) + 31possible loads*2 axle types (tridem and quad)]}. The summation of the axle load factor for each truck type for each axle type for each month should add up to 100%. Typical axle load distribution factor used in MEPDG is presented in Figure 1.
Because ALDF is thought of as a big step in mechanistic analysis, several researchers tried to evaluate the sensitivity of the MEPDG to the ALDF input parameters, however the results were contradictory. It was reported that MEPDG predicted performance is sensitive to site specific ALDF [1, 6, 8]. In another study, it was found that the MEPDG is moderately sensitive to axle load spectra (ALS) for typical Washington Department of Transportation (WSDOT) pavement design [3]. However this was not the case based on different ALDF collected in Ontario, where the pavement life of the pavement was almost unaffected by the ALDF [10]. El-Badawy et al. [13] reported that the state wide ALDF yielded higher longitudinal cracking compared to default MEPDG load spectra; however, no significant impact was found in the AC rutting, total rutting and international roughness index (IRI). This was based on data collected from 25 different sites in Idaho [13]. The difference in findings can be attributed to the fact that each researcher compared the typical MEPDG values with actually collected data on the state where the research was conducted, so the conclusions are confound within the used data set and was affected by how far the variation between the actual data set and the default MEPDG.
TrafficVolume Adjustment Factors
They included vehicle class distribution (VCD), monthly adjustment factors (MAF), hourly distribution factors (HDF), and traffic growth factors (TGF). The VCD include 10 classes of vehicles (numbered 4 through 13) as defined by Federal Highway Administration (FHWA) are used in MEPDG. Figure 2 presents the 10 classes along with the typical percentage of each class in the truck traffic stream. The predicted distress in MEPDG was sensitive to VCD based on clustering analysis for data from North Carolina [8], however the details regarding this impact was not reported. Swan et al. [10] evaluated changing Class 5 and Class 9 trucks by 15 and 30% and reported a variation of pavement life of less than 1 year based on IRI criterion (less than 127 in/mile). Li et al. [3] reported that VCD affect the predicted rutting and cracking, with no
effects on IRI. It was also reported that VCD affected pavement life based on rutting criterion [6]. The Monthly adjustment factors (MAF) consist of 10 vehicle classes *12 months = 120 inputs. Research [8], conducted at North Carolina showed that MEPDG predicted distress is not sensitive to MAF. However, Li et al.[3] reported that MAF affected the predicted rutting and cracking, with no effects on IRI. The hourly distribution factors (HDF)as 24 inputs were found to have little impact on predicted flexible pavement distresses [8, 9], and was reported in another study[3] to have no effect on predicted distress .Traffic growth factors: (either 1 parameter for all vehicle classes or 10 parameters if growth rate is different for each vehicle class). This should affect the total number of load repetition over the pavement life and is expected to have great impact on predicted distress.
General traffic inputs
General traffic inputs like number of axles/trucks as 40 inputs (10 vehicle classes * 4 types of axle configurations), whereas axle configuration are 6 inputs (average axle width, dual tire spacing, tire pressure, and axle spacing (3 parameters for tandem, tridem and quad axles)).Wheel base are 6 inputs as average axle spacing (3 categories; (short, medium and long)), percentage of trucks for each axle space. Lateral traffic wanders which are 3 inputs. It was reported to have no significant effect on predicted distress in MEPDG [7].
environmental conditions. Other researchers [15, 22] reported increase in pavement stress caused by high tire pressures. However they found the effect of high tire pressure was insignificant to pavement performance. Two sections with varying tire pressures were tested and it was reported that high tire pressures caused higher tensile strain at the bottom of the AC layer but had no significant effect on vertical strain at the top of subgrade [15, 23]. Based on field sections, a significant effect of tire pressures on tensile strain at the bottom of the AC layer of the pavements was also reported [24-27].
Limited work was conducted to evaluate the sensitivity of the predicted distress in MEPDG to the tire pressure. Currently, in MEPDG Ver. 1.1 the default tire pressure is set to 120 psi.
III.
RESEARCH METHODOLOGY
Previous studies were limited to small changes in specific truck types based on the state where the work was conducted. The idea of this study is to develop an understanding about the effect of VCD in a general manner not connected to a specific state. To evaluate the impact of vehicle (truck) class on pavement sections, different cases of loading were analyzed. The first case presents the typical vehicle class distribution. Then this case was compared to traffic streams that consisted of 100% of each truck type (i.e, one case with 100% Class 4, the second case consisted of 100% Class 5, and so on for all truck classes), so the total number of trucks over the pavement life is the same for all cases. The idea is to understand the impact of VCD on pavement performance isolated from any other factor. For each case, the MEPDG Ver. 1.1 was used to evaluate the effect of tire pressure by solving each case for a tire pressure of 120 and 140 psi. All the analysis was conducted on thin and thick hot mix asphalt (HMA) sections (2 inches vs. 6 inches thick HMA). Table 1 presents the input data for all the cases used in the MEPDG analysis.
The effect of the traffic parameters on asphalt pavement (AC) rutting, base rutting, subgrade rutting, international roughness index (IRI), longitudinal cracking and fatigue (alligator) cracking were investigated. The variation of the predicted distress was defined using Equation 1. The resulted variability was also compared to the variability resulted from increasing ADTT. Percent distress variability (PDV) for the impact of AADTT was compared to what was found for the effect of VCD. AADTT for thin pavement was evaluated at two levels (1000 and 4000 vehicle/day) for the default VCD. For thick pavement ADTT was ranged from (7000 to 14000 vehicle/day) for default VCD.
Percent Distress Variability (PDV) =
�� � −�� � ��� �
�� � *100 (1)
Where: Distress of reference case: is the distress after 10 years, calculated based on default MEPDG vehicle class distribution presented in Figure 2.
IV.
RESULTS AND ANALYSIS
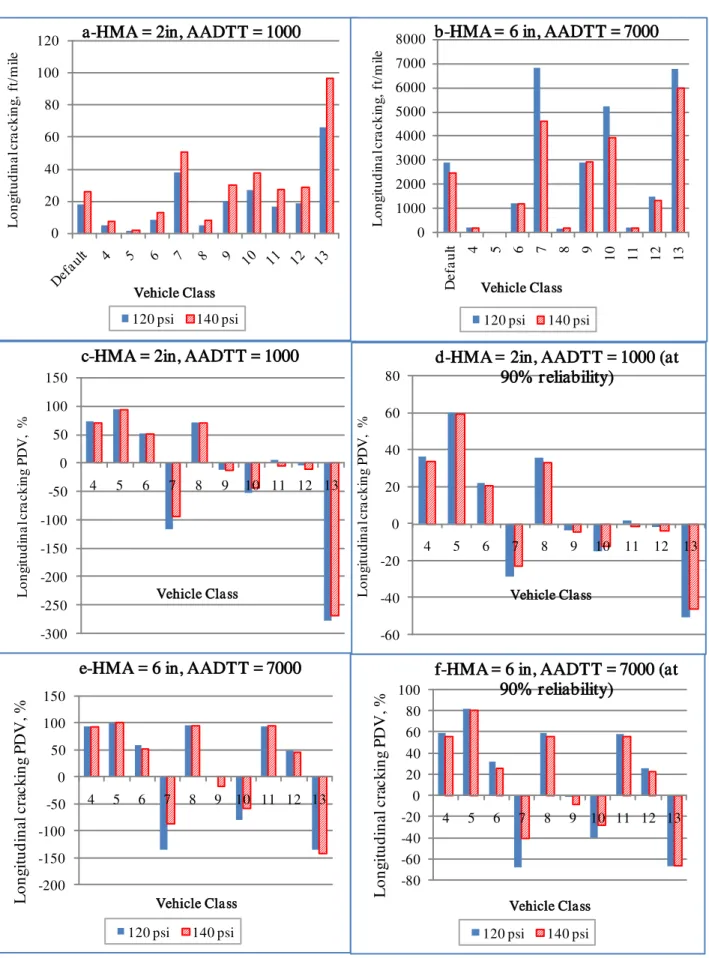
Effect of Vehicle Class and Tire pressure on Longitudinal CrackingFigure (3-a,b ) presents the effect of truck type and tire pressure on longitudinal cracking. In general; Class 5 has the lowest impact on pavement cracking followed by Class 4 then Class 8. The impact of truck type was dependent on the thickness of HMA. For thin HMA sections, Class 13 showed the most critical impact on the longitudinal crack, followed by Class 7, followed by Class 10. Class 11 and 12 were exactly identical for their impact on pavement. For thick HMA sections, Class 7 and 13 had same effect on pavement; Class 12 had much more severe impact compared to Class 11. Using Class 13 instead of the typical MEPDG VCD caused increase in longitudinal cracking as PDV of (-277% and -134%) in cases of thin and thick HMA sections at 50% reliability. Negative PDV indicates that vehicle class had more severe impact on the distress compared to default MEPDG. When evaluating the distress at 90% reliability, using Class 13 instead of the typical MEPDG VCD caused increase in longitudinal cracking of 50 and 68% in cases of thin and thick HMA sections. Summary of the range of PDV for all distresses is presented in Table 2. On the other hand using lighter trucks like Class 5 resulted in PDV of 100 for both thin and thick HMA sections. The range of PDV for longitudinal crack reached (100-(-277) = 377 %) for thin HMA sections. The effect of VCD (presented by the PDV) much lower for the case of thick HMA sections compared to thin HMA sections. Increasing the reliability level from 50% to 90% reduced the effect of changing VCD, clear reduction of PDV was found.
different impacts on pavement structure. This can help in explaining the impact of Classes 13 and 7 compared to other lighter trucks. Table 2 shows that changing vehicle class can cause severe impact on longitudinal cracking compared to traffic level.
When tire pressure increased from 120 to 140 psi, longitudinal cracking PDV varied from 34 to 67% in the case of thin HMA sections. The impact of tire pressure on longitudinal cracking was significantly lower in the case of thick HMA section as PDV varied from 0.50 to 32% for increasing tire pressure from 120 to 140 psi for different truck classes, as presented in Figure 3 and Table 2. The impact of increasing the tire pressure was dependent on the truck class, thickness of HMA, and reliability level. For thin HMA increasing tire pressure increased the longitudinal cracking, this was changed for thick HMA, as increasing tire pressure reduced the longitudinal cracking for most of the heavy truck types (Classes 7, 10 and 13) while it did not show impact on lighter trucks (Classes 4, 5, 8 and 11), as presented in Figure 3(a, b, c and d). Increasing the reliability level from 50% to 90% reduced the effect of changing tire pressure. Summary of PDV due to change in tire pressure for all distresses is presented in Table 3.
Effect of Vehicle Class and Tire pressure on Alligator Cracking
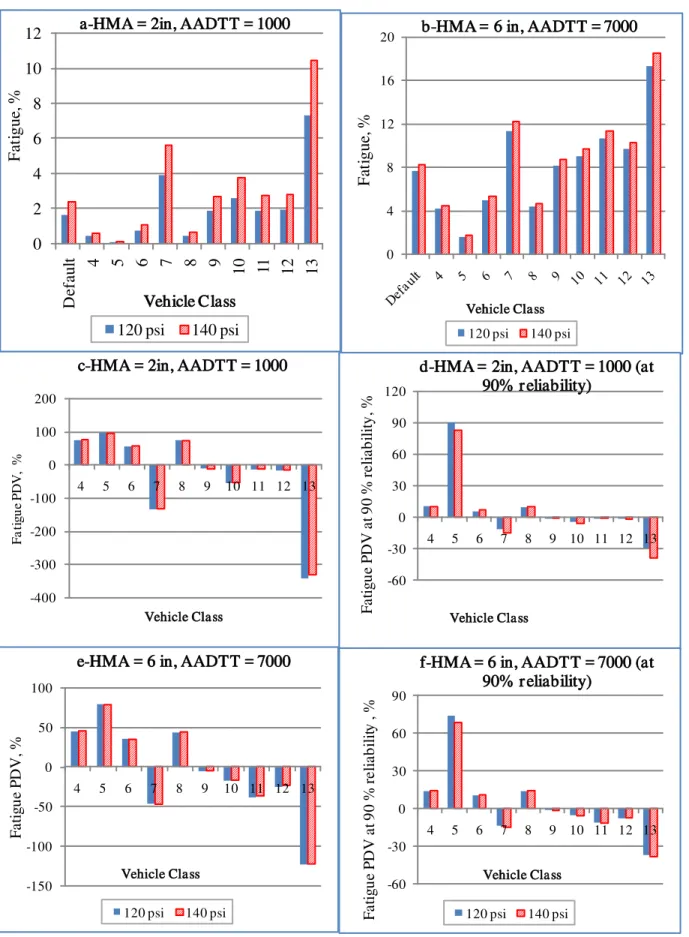
Figure 4 presents the effect of truck type and tire pressure on alligator (fatigue) cracking. Class 5 had the lowest impact on pavement followed by Class 4 then Class 8. The impact of truck type was dependent on the thickness of HMA. For thin HMA sections, Class 13 showed the most critical impact on the alligator cracking, followed by Class 7, then Class 10. Class 11 and 12 had the same impact on thin pavement. However, for thick HMA sections, Class 11 had more severe impact compared to Class 10 and 12, as presented in Figure 4 (a, b).
The percent distress variability (PDV) was used to understand the impact of vehicle class on fatigue cracking. Table 2 and Figure 4 show that PDV would vary from (-343 %to 95%) when different vehicles are used in the case of thin HMA sections at 50% reliability. This effect is significantly reduced to (-28 to 89%) when the analysis was conducted at 90% reliability. For thick HMA sections the effect of VCD was less than what was found for thin HMA sections. Table 2 and Figure 4 show that PDV would vary from (-123 %to 78%) when different vehicles are used in the case of thin HMA sections at 50% reliability. This effect is significantly reduced to (-37 to 74%) when the analysis was conducted at 90% reliability. Table 2 also shows that changing vehicle class can induce more severe impact on fatigue
cracking compared to traffic level for thick HMA sections.
The impact of tire pressure on fatigue cracking was then evaluated. Alligator cracking PDV varied from 43 to 48% when tire pressure increased from 120 to 140 psi, in the case of thin HMA sections. The impact of tire pressure on alligator cracking was significantly lower in the case of thick HMA section as it varied by 6.5% to 8% for increasing tire pressure from 120 to 140 psi for different truck Classes.
The MEPDG alligator cracking model calculates the number of load repetition to failure; then the model calculates the damage as a percentage after a specific number of load repetition, then uses a transfer function to transfer the damage into percentage cracked area [28]. In MEPDG, the number of load repetitions to failure is function of the tensile strain to the power of (-3.9), meaning that 10% variation in the tensile strain at the bottom of the AC layer results in changing the number of load repetition to failure by 50% [29]. This can explain the sensitivity of thin HMA to variation in tire pressure and vehicle class compared to thick HMA sections. With increasing the tire pressure or using heavier axle loads, the tensile strain at bottom of HMA increased which reduced significantly the number of load repetition to failure.
Effect of Vehicle Class and Tire Pressure on Rutting and IRI
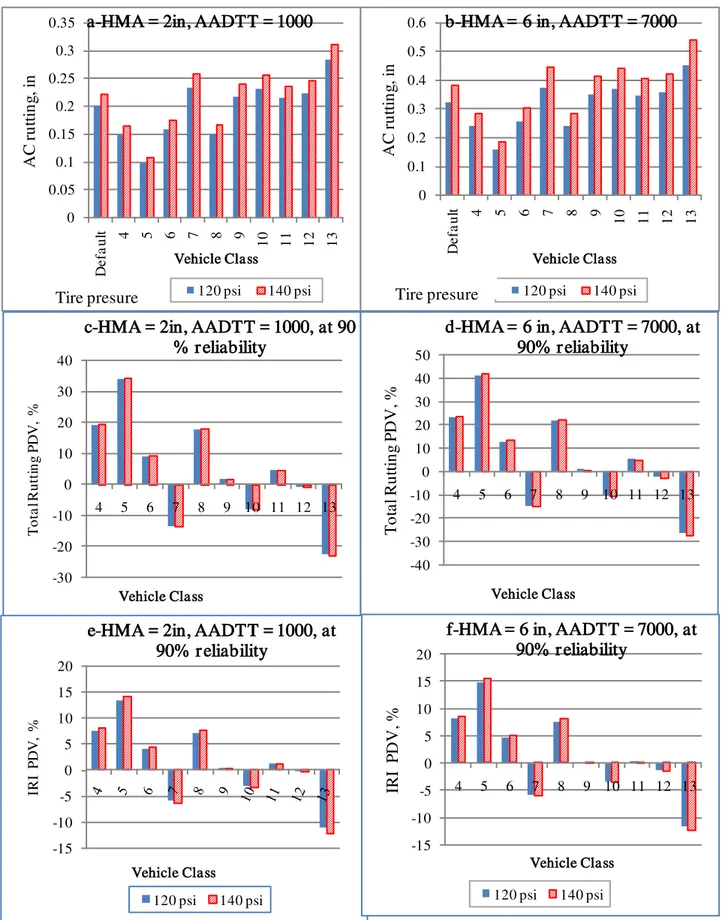
Figure 5 presents the effect of tire pressure and vehicle Class on AC rutting, total rutting and IRI. Class 5 had the lowest impact on pavement followed by Class 4 then Class 8. Class 13 showed the most critical impact on the AC rutting, with 40% increase in AC rutting compared to default MEPDG. Classes 7, 9, 10, 11 and 12 were very close to each other for their impact on AC rutting in both thin and thick pavement (with less than 8% variation between them). Table 2 indicates that the VCD had limited effect on subgrade rutting in both cases of thick and thin HMA section (the PDV varied from -20 to 40%). The VCD had limited effect on base rutting in both cases of thick and thin HMA section (the PDV varied from -15 to 20%). For the total rutting PDV varied from -24 to 36%. For total rutting the PDV was the same for both cases of 50% and 90% reliability. Table 2 shows that changing vehicle class resulted in PDV (of total rutting) comparable to that resulted from increasing AADTT.
from 120 to 140 psi caused a change in AC rutting by 10% in case of thin HMA and 18% in case of thick HMA. This agrees with experimental work published by Akram et al. [23] where tire pressure affected the strain at bottom of HMA and have no impact on strain on top of subgrade. For the overall section rutting, increasing tire pressure from 120 psi to 140 psi caused a maximum increase of 3.5% and 8.8% of total rutting in the case of thin and thick HMA sections respectively.
Table 2 presents the effect of vehicle class on IRI. Results indicate that the impact is relatively small (PDV varied from -12 to 15%) for both thin and thick HMA. This small impact is almost the same as what has resulted from increasing the AADTT. Tire pressure had no impact on IRI, as presented in Table 3.
V.
SUMMARY AND CONCLUSION
This paper investigated the effect of vehicle class distribution (VCD) and tire pressure on predicted pavement distress in flexible pavement in MEPDG. The paper evaluated extreme cases of VCD where the stream consisted of 100% of each vehicle Class compared to typical MEPDG VCD. This gave better understanding of the impact of vehicle Class on pavement performance isolated from any other factor. The tire pressure was varied in the analysis from 120 to 140 psi for cases of thin and thick HMA sections. It can be concluded that:
1. Class 5 had the lowest impact on pavement distress followed by Class 4 then Class 8. Class 13 showed the most critical impact on pavement distresses followed by Class 7. Class 9 gave almost same pavement distress as the typical MEPDG VCD.
2. The impact of some truck type was dependent in many cases on the thickness of HMA and type of distress under consideration. Class 11 and 12 had the same impact on fatigue cracking of thin pavement while for thick HMA sections, Class 11 had more severe impact compared to Class 12. This was the opposite for what was found for longitudinal cracking. Vehicle class would have a significant impact on AC rutting, alligator cracking, fatigue cracking, and would have minimal impact on subgrade rutting, base rutting.
3. The impact of vehicle class is critical and comparable to the effect of level of traffic (AADTT level). The VCD would cause clear impact only if the major traffic is of specific class (very light or very heavy). If this is not the case, the vehicle class distribution will not be a significant factor that affects the final
design because most of trucks had similar impact on flexible pavement distresses. 4. The impact of tire pressure is mainly clear on
fatigue cracking and AC rutting in both cases of thin and thick HMA sections, and have no significant impact on both base and subgrade rutting. Increasing tire pressure caused an increase in longitudinal cracking in case of thin HMA sections and caused reduction in the case of thick HMA sections. Once the reliability level is increased to 90%, increasing tire pressure did not show impact on any pavement distress except for longitudinal cracking.
REFERENCES
[1.] Tran, N. H., and Hall, K. D., (2007). Development and Influence of Statewide Axle Load Spectra on Flexible Pavement Performance. Transportation Research Record: Journal of the Transportation Research Board, No. 2037. Transportation Research Board, Washington, D.C., pp. 106-114.
[2.] Tran, N. H. and Hall, K. (2007). Development and significance of statewide volume adjustment factors in Mechanistic Pavement Design Guide. Transportation Research Record: Journal of the Transportation Research Board, No. 2037. Transportation Research Board, Washington, D.C., pp. 97-105.
[3.] Li, J., Pierce, L. M., Hallenbeck, M. E. and Uhlmeyer, J. (2009). Sensitivity of Axle Load Spectra in Mechanistic-Empirical Pavement Design Guide for Washington State Department of Transportation. Transportation Research Board annual meeting, Paper No. 09-2172 on CD-ROM.
[4.] Von Quintus, H. L., Tam, W. O. and Gharaibeh, N. (2000). Guide for Mechanistic-Empirical Design Of New and Rehabilitated Pavement Structures, Appendix AA: Traffic Loadings. [5.] Schwartz, C. W., and Carvalh, R. L. (2007).
Implementation of the NCHRP 1-37A Design Guide. Final Report Volume 2: Evaluation of Mechanistic-Empirical Design Procedure.
Project No. SP0077B41, Maryland State Highway Administration (MDSHA).
[6.] Smith, B. C., and Diefenderfer, B. K. (2010). Analysis of Virginia-Specific Traffic Data Inputs for Use with the Mechanistic-Empirical Pavement Design Guide. Report No. VTRC 10-R19.
Regional University Transportation Center, Wisconsin Department of Transportation. [8.] Sayyady, F., Stone, J. R., Taylor, K. L., Jadoun,
F. M. and Kim, Y. R. (2010). Using Clustering Analysis to Characterize MEPDG Traffic Data in North Carolina. Transportation Research Record, No. 2160, pp. 118–127
[9.] Oman, M. S. (2010). MnROAD Traffic Characterization for the Mechanistic-Empirical Pavement Design Guide Using Weigh-in-Motion Data. Transportation Research Board
annual meeting, Paper No. 10-2903 on CD-ROM.
[10.]Swan, D. J., Tardif, R., Hajek, J. J., and Hein, D. K. (2008). Development of Regional Traffic Data for the Mechanistic-Empirical Pavement Design Guide. Transportation Research Record, Vol. No. 2049, pp. 54–62.
[11.]Jiang, Y., Li, S., Nantung, T. and Chen, H. (2008). Analysis and Determination of Axle Load Spectra and Traffic Input for the Mechanistic-Empirical Pavement Design Guide.
Report No. FHWA/IN/JTRP-2008/7, Indiana Department of Transportation.
[12.]Schwartz, C. W., Li, R., Kim, S. H., Ceylan, H. and Gopalakrishnan, K. (2011). Sensitivity Evaluation of MEPDG Performance Prediction.
Project 1-47, National Cooperative Highway Research Program, December 2011.
[13.]El-Badawy, S. M., Bayomy, F. M. and Fugit, S. (2012). Traffic Characteristics and Their Impact on Pavement Performance for the Implementation of the Mechanistic Empirical Pavement Design Guide in Idaho. International J. of Pavement Research and Technology, Vol. 5, No. 6.
[14.]Cooper, S., Elseifi, M., Mohamed, L. (2012). Parametric Evaluation of Design Input Parameters on Mechanistic-Empirical Pavement Design Guide Predicted Performance. J. Pavement Research and Technology. Vol. 5, No. 4, pp. 218-224.
[15.]Machemehl, Randy, Wang, Feng, Prozzi, Jorge. (2005). Analytical Study of Effects of Truck Tire Pressure on Pavements with Measured Tire-Pavement Contact Stress Data. Transportation Research Record: Journal of the Transportation Research Board, Vol. no.1919, pp. 111-120.
[16.]Abdel-Motaleb, M. E. (2007). Impact of High-Pressure Truck Tires on Pavement Design in Egypt. Emirates Journal for Engineering Research, Vol. 12, No. 2, pp. 65-73.
[17.]El-Hamrawy, S. (2000). Effect of Wheel Load, Tire Pressure and Subgrade Stiffness on
Flexible Pavements Responses”, Al-Azhar
Engineering 6th International Conference, pp. 489-502.
[18.]Southgate, H.F. and Deen, R.C. (1987). Effects of Load Distributions and Axle Tire Configurations on Pavement Fatigue, Proc., 6th Int. Conf. on Struct. Design of Asphalt Pavements, Michigan, pp. 82-93.
[19.]Mateos, A., and Snyder, M. B. (2002). Validation of Flexible Pavement Structural Response Models with Data from the Minnesota Road Research Project. Transportation Research Record No. 1806, Transportation Research Board, Washington DC, pp.19-29. [20.]Pidwerbesky, B.D. (1995). Strain Response and
Performance of Subgrades and Flexible Pavements under Various Loading Conditions. Transportation Research Record No.1482, Transportation Research Board, Washington DC, pp 87-93.
[21.]Bonaquist, R., Surdahl, R., and Mogawer, W. (1989). Effect of Tire Pressure on Flexible Pavement Response and Performance. Transportation Research Record No. 1227, Transportation Research Board, Washington DC, pp 97-106.
[22.]Sebaaly, P.E., and Tabatabaee, N. (1992). Effect of Tire Parameters on Pavement Damage and Load-Equivalency Factors. ASCE Journal of Transportation Engineering, Vol. 118, No. 6, pp 805-819.
[23.]Akram, T., Scullion, T., and Smith, R. E. (1993). Using the Multidepth Deflectometer to Study Tire Pressure, Tire Type, and Load Effects on Pavements. Research Report 1184-2, Volume 2, Texas Transportation Institute, Texas A&M University, College Station, Texas. [24.]Chatti, K., Kim, H. B., Yun, K. K., Mahoney,
J.P. and Monismith, C. L. (1996). Field Investigation into Effects of Vehicle Speed and Tire Pressure on Asphalt Concrete Pavement Strains. Transportation Research Record No. 1539, Transportation Research Board, Washington DC, pp 66-71.
[25.]Mahoney, J.P., Winters, B.C., Chatti, K., Moran, T.J., Monismith, C.L., and Kramer, S.L. (1995). Vehicle/Pavement Interaction at the PACCAR Test Site. Final Report No. WARD 384.1, Washington State Department of Transportation, Olympia, Washington.
[26.]Huhtala, M., Pihlajamaki, J., and Pienimaki, M. (1989). Effects of Tires and Tire Pressures on Road Pavements. Transportation Research Record No. 1227, Transportation Research Board, Washington DC, pp 107-114.
[28.]Huang, Y. (1993). Pavement Analysis and Design, Prentice-Hall, Inc.
[29.]Attia, M., and Abdelrahman, M. (2010). Variability of RAP Resilient Modulus as a Base Layer and Its Impact on Flexible Pavement Performance. Journal of Transportation Research Record, Vol. 2167, pp 18-29.
[30.]Witczak, M. W., Basyouny, M. M., and El-Badawy, S. (2000). Guide for
Mechanistic-Empirical Design Of New and Rehabilitated Pavement Structures, Appendix GG-2: Sensitivity Analysis for Permanent Deformation for Flexible Pavements.
http://www.trb.org/mepdg/2appendices_GG.pdf . Accessed July 2010.
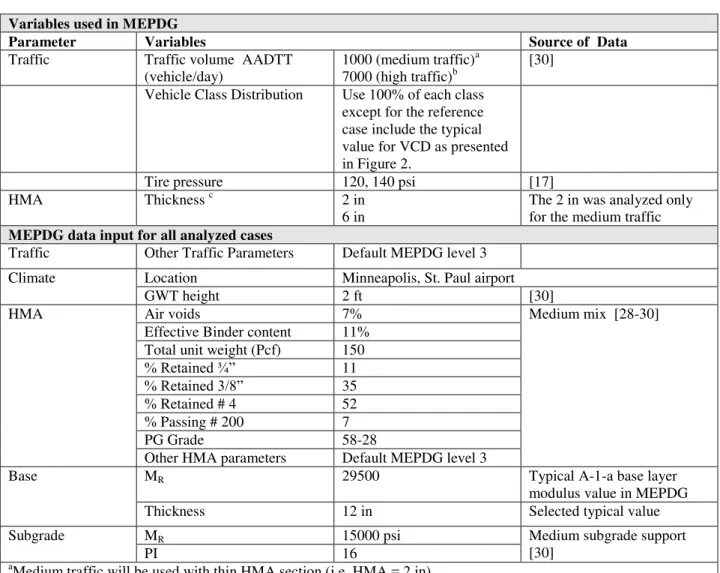
TABLE 1 Variables Used in MEPDG Analysis
Variables used in MEPDG
Parameter Variables Source of Data
Traffic Traffic volume AADTT (vehicle/day)
1000 (medium traffic)a 7000 (high traffic)b
[30]
Vehicle Class Distribution Use 100% of each class except for the reference case include the typical value for VCD as presented in Figure 2.
Tire pressure 120, 140 psi [17]
HMA Thickness c 2 in
6 in
The 2 in was analyzed only for the medium traffic
MEPDG data input for all analyzed cases
Traffic Other Traffic Parameters Default MEPDG level 3
Climate Location Minneapolis, St. Paul airport
GWT height 2 ft [30]
HMA Air voids 7% Medium mix [28-30]
Effective Binder content 11% Total unit weight (Pcf) 150
% Retained ¾” 11
% Retained 3/8” 35
% Retained # 4 52
% Passing # 200 7
PG Grade 58-28
Other HMA parameters Default MEPDG level 3
Base MR 29500 Typical A-1-a base layer
modulus value in MEPDG
Thickness 12 in Selected typical value
Subgrade MR 15000 psi Medium subgrade support
[30]
PI 16
a
Medium traffic will be used with thin HMA section (i.e. HMA = 2 in) b
high traffic will be used with thick HMA section (i.e. HMA =6 in) c
Arbitrary selected thicknesses to present thin and thick AC layer AADTT: average annual daily truck traffic, HMA: hot mix asphalt layer GWT: ground water table height from pavement surface
*: Reference case for each truck distribution is the typical vehicle Class distribution, presented in Figure 2 Extra 2 cases were analyzed to evaluate the effect of ADTT on performance
Thin HMA with ADTT of 4000, with typical VCD
Table 2: Range of PDV (%) due to variation of vehicle class
Distress type Thin HMA (HMA = 2in, AADTT = 1000)
Thin HMA Thick HMA (HMA = 6in, AADTT = 7000)
Thick HMA
Average 90% reliability
Impact of increasing AADTT to 4000 at 90% reliability
Average 90% reliability Impact of increasing AADTT to 14000 at 90% reliability Longitudinal
crack
-277 to 93 -50 to 60 -83 -135 to 99
-68 to 82 -45
Fatigue Crack -343 to 95 -28 to 89 -76 -123 to 78
-37 to 74 -29
Subgrade rutting
-20 to 40 NA NA -20 to 45 NA NA
Base rutting -15 to 20 NA NA -14 to 16 NA NA
HMA Rutting -40 to 50 NA NA -40 to 51 NA NA
Total Rutting -24 to 36 -22 to 34 -38 -28 to 43 -27 to 42 -22 IRI -13 to 14 -12 to 14 -20 -13 to 15 -12 to 15.5 -9.4 Notes:
PDV: Percent Distress Variability, based on Equation 1
Maximum PDV variation presents the highest or lowest PDV as compared to default MEPDG Average: mean that distress is calculated assuming 50% reliability
NA: no output is available in MEPDG Ver. 1.1
+ve PDV indicates that the vehicle class has lower impact on the distress compared to default MEPDG -ve PDV indicates that vehicle class has higher impact on the distress compared to default MEPDG
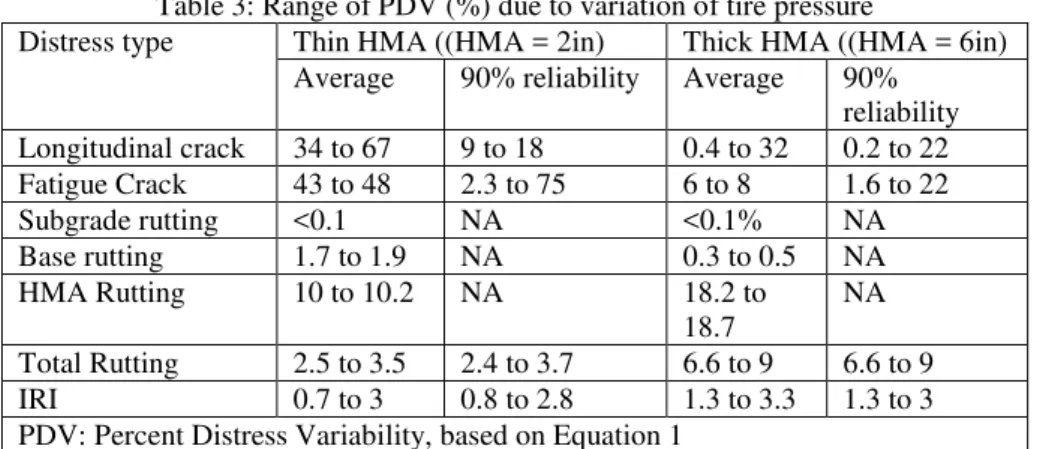
Table 3: Range of PDV (%) due to variation of tire pressure
Distress type Thin HMA ((HMA = 2in) Thick HMA ((HMA = 6in) Average 90% reliability Average 90%
reliability Longitudinal crack 34 to 67 9 to 18 0.4 to 32 0.2 to 22 Fatigue Crack 43 to 48 2.3 to 75 6 to 8 1.6 to 22 Subgrade rutting <0.1 NA <0.1% NA Base rutting 1.7 to 1.9 NA 0.3 to 0.5 NA
HMA Rutting 10 to 10.2 NA 18.2 to
18.7
NA
FIGURE 1 Default axle load distribution in MEPDG.
0
20
40
60
80
100
0
5000
10000
15000
20000
25000
C
u
m
m
u
la
ti
ve
F
re
q
u
en
cy
, %
Axle Load, Lb
Single Axle
0
20
40
60
80
100
120
0
20000
40000
60000
80000
100000
C
u
m
m
u
la
ti
ve
F
re
q
u
en
cy
, %
Axle Load, Lb
Tridem Axle
4
5
6
7
8
9
10
11
12
13
0
20
40
60
80
100
120
0
10000
20000
30000
40000
50000
C
u
m
m
u
la
ti
ve
F
re
q
u
en
cy
, %
FIGURE 2 Truck Classes, typical vehicle Class distribution and number of axles per truck in MEPDG.
FIGURE 1 Effect of tire pressure and vehicle Class on longitudinal cracking -300 -250 -200 -150 -100 -50 0 50 100 150
4 5 6 7 8 9 10 11 12 13
L o n g it u d in a l c ra c k in g P D V , %
Vehicle Cla ss
c-HMA = 2in, AADTT = 1000
-200 -150 -100 -50 0 50 100 150
4 5 6 7 8 9 10 11 12 13
L
o
n
g
it
u
d
in
a
l
c
ra
c
k
in
g
P
D
V
,
%
Vehicle Cla ss
e-HMA = 6 in, AADTT = 7000
120 psi 140 psi
-60 -40 -20 0 20 40 60 80
4 5 6 7 8 9 10 11 12 13
L o n g it u d in a l c ra c k in g P D V , %
Vehicle Cla ss
d-HMA = 2in, AADTT = 1000 (at
90% r eliability)
-80 -60 -40 -20 0 20 40 60 80 100
4 5 6 7 8 9 10 11 12 13
L
o
n
g
it
u
d
in
a
l
c
ra
c
k
in
g
P
D
V
,
%
Vehicle Cla ss
f-HMA = 6 in, AADTT = 7000 (at
90% r eliability)
120 psi 140 psi 0 20 40 60 80 100 120 L o n g it u d in a l c ra c k in g , ft /m il e
Vehicle Cla ss
a-HMA = 2in, AADTT = 1000
120 psi 140 psi
0 1000 2000 3000 4000 5000 6000 7000 8000 D e fa u
lt 4 5 6 7 8 9
10 11 12 13
L o n g it u d in a l c ra c k in g , ft /m il e
Vehicle Cla ss
b-HMA = 6 in, AADTT = 7000
FIGURE 4 Effect of tire pressure and vehicle Class on alligator cracking.
0
2
4
6
8
10
12
D
ef
aul
t
4
5
6
7
8
9
10
11
12
13
F
at
igu
e,
%
Vehicle Class
a-HMA = 2in, AADTT = 1000
120 psi
140 psi
0 4 8 12 16 20
F
at
igue
, %
Vehicle Cla ss
b-HMA = 6 in, AADTT = 7000
120 psi 140 psi
-400 -300 -200 -100 0 100 200
4 5 6 7 8 9 10 11 12 13
F
a
ti
g
u
e
P
D
V
,
%
Vehicle Cla ss
c-HMA = 2in, AADTT = 1000
-150 -100 -50 0 50 100
4 5 6 7 8 9 10 11 12 13
F
a
ti
g
u
e
P
D
V
,
%
Vehicle Cla ss
e-HMA = 6 in, AADTT = 7000
120 psi 140 psi
-60 -30 0 30 60 90 120
4 5 6 7 8 9 10 11 12 13
F
a
ti
g
u
e
P
D
V
a
t
90
%
re
li
a
b
il
it
y
,
%
Vehicle Cla ss
d-HMA = 2in, AADTT = 1000 (at
90% r eliability)
-60 -30 0 30 60 90
4 5 6 7 8 9 10 11 12 13
F
a
ti
g
u
e
P
D
V
a
t
90
%
re
li
a
b
il
it
y
,
%
Vehicle Cla ss
f-HMA = 6 in, AADTT = 7000 (at
90% r eliability)
Figure 5 Effect of Tire pressure and Vehicle Class on Rutting and IRI
0 0.05 0.1 0.15 0.2 0.25 0.3 0.35
D
e
fa
u
lt 4 5 6 7 8 9
10 11 12 13
A
C
ru
tt
in
g
,
in
Vehicle Cla ss
a-HMA = 2in, AADTT = 1000
120 psi 140 psi
Tire presure
0 0.1 0.2 0.3 0.4 0.5 0.6
D
e
fa
u
lt 4 5 6 7 8 9
10 11 12 13
A
C
ru
tt
in
g
,
in
Vehicle Cla ss
b-HMA = 6 in, AADTT = 7000
120 psi 140 psi
Tire presure
-30 -20 -10 0 10 20 30 40
4 5 6 7 8 9 10 11 12 13
To
ta
l R
u
tt
in
g
P
D
V
,
%
Vehicle Cla ss
c-HMA = 2in, AADTT = 1000, at 90
% r eliability
-40 -30 -20 -10 0 10 20 30 40 50
4 5 6 7 8 9 10 11 12 13
T
o
ta
l
Ru
tt
in
g
P
D
V
,
%
Vehicle Cla ss
d-HMA = 6 in, AADTT = 7000, at
90% r eliability
-15 -10 -5 0 5 10 15 20
IR
I
P
D
V
,
%
Vehicle Cla ss
e-HMA = 2in, AADTT = 1000, at
90% r eliability
120 psi 140 psi
-15 -10 -5 0 5 10 15 20
4 5 6 7 8 9 10 11 12 13
IRI
P
D
V
,
%
Vehicle Cla ss