Genotyping-By-Sequencing (GBS) Detects
Genetic Structure and Confirms Behavioral
QTL in Tame and Aggressive Foxes (Vulpes
vulpes)
Jennifer L. Johnson1, Helena Wittgenstein2, Sharon E. Mitchell3, Katie E. Hyma3, Svetlana V. Temnykh2, Anastasiya V. Kharlamova4, Rimma G. Gulevich4, Anastasiya
V. Vladimirova4, Hiu Wa Flora Fong1, Gregory M. Acland2, Lyudmila N. Trut4, Anna V. Kukekova1*
1Department of Animal Sciences, College of ACES, University of Illinois at Urbana-Champaign, Urbana, IL, 61801, United States of America,2Baker Institute for Animal Health, Cornell University, College of Veterinary Medicine, Ithaca, NY, 14853, United States of America,3Institute of Biotechnology, Genomic Diversity Facility, Cornell University, Ithaca, NY, 14853, United States of America,4Institute of Cytology and Genetics of the Russian Academy of Sciences, Novosibirsk, 630090, Russia
Abstract
The silver fox (Vulpes vulpes) offers a novel model for studying the genetics of social behav-ior and animal domestication. Selection of foxes, separately, for tame and for aggressive behavior has yielded two strains with markedly different, genetically determined, behavioral phenotypes. Tame strain foxes are eager to establish human contact while foxes from the aggressive strain are aggressive and difficult to handle. These strains have been main-tained as separate outbred lines for over 40 generations but their genetic structure has not been previously investigated. We applied a genotyping-by-sequencing (GBS) approach to provide insights into the genetic composition of these fox populations. Sequence analysis ofEcoT22I genomic libraries of tame and aggressive foxes identified 48,294 high quality SNPs. Population structure analysis revealed genetic divergence between the two strains and more diversity in the aggressive strain than in the tame one. Significant differences in allele frequency between the strains were identified for 68 SNPs. Three of these SNPs were located on fox chromosome 14 within an interval of a previously identified behavioral QTL, further supporting the importance of this region for behavior. The GBS SNP data confirmed that significant genetic diversity has been preserved in both fox populations despite many years of selective breeding. Analysis of SNP allele frequencies in the two populations identi-fied several regions of genetic divergence between the tame and aggressive foxes, some of which may represent targets of selection for behavior. The GBS protocol used in this study significantly expanded genomic resources for the fox, and can be adapted for SNP discov-ery and genotyping in other canid species.
OPEN ACCESS
Citation:Johnson JL, Wittgenstein H, Mitchell SE, Hyma KE, Temnykh SV, Kharlamova AV, et al. (2015) Genotyping-By-Sequencing (GBS) Detects Genetic Structure and Confirms Behavioral QTL in Tame and Aggressive Foxes (Vulpes vulpes). PLoS ONE 10(6): e0127013. doi:10.1371/journal.pone.0127013
Academic Editor:William J. Murphy, Texas A&M University, UNITED STATES
Received:November 27, 2014
Accepted:April 9, 2015
Published:June 10, 2015
Copyright:© 2015 Johnson et al. This is an open access article distributed under the terms of the
Creative Commons Attribution License, which permits unrestricted use, distribution, and reproduction in any medium, provided the original author and source are credited.
Data Availability Statement:All sequencing files are available from the SRA database, (accession numbers SAMN03165689, SAMN03165690, BioProjectID: PRJNA266505).
Introduction
The red fox (Vulpes vulpes) and the gray wolf (Canis lupus), both members of the Canidae fam-ily, diverged from a common ancestor approximately 10 million years ago [1,2]. The domestic dog (Canis lupus familiaris) is a recent descendant of the modern gray wolf ancestor and the only historically domesticated canid. In 1959, work began at the Institute of Cytology and Ge-netics (ICG, Novosibirsk, Russia) to domesticate the silver fox, a coat color variant of the red fox [3–7]. Here, a tame fox strain was produced from conventionally bred farm foxes by first eliminating fearful and aggressive animals from the breeding population and then selecting for friendly behavior to humans [5,8–10]. The rapid response to selection for behavior during the first ten generations [5,6,9,10] strongly suggests that selection was acting on preexisting ge-netic variation that was present in the founder population. The effort to minimize inbreeding in the fox population during the entire the breeding program [11–14] has allowed continued, and ongoing selection for behavior (for review [5,8–10]). The tame strain foxes are eager to es-tablish human contact and demonstrate friendly, playful behavior towards humans, paralleling the sociability of dog puppies. The tame population was maintained as a closed line and cur-rently comprises approximately 300 breeding animals.
Since commercial farms usually eliminate animals with an excessively aggressive response to humans, a parallel breeding program was begun in 1970 to preserve this behavior for re-search [6,10]. Selection of breeding animals was based on fox awareness (critical distance be-tween the experimenter and the caged animal when the fox demonstrates a hostile behavior) and the intensity of the fox’s aggressive response. Foxes from the aggressive strain avoid inter-action with humans and are aggressive when approached. The aggressive population was large-ly maintained as a closed line but an introgression of farm-bred foxes that had not been systematically selected for behavior was made in the 1990s. The current population of aggres-sive foxes comprises approximately 150 breeding animals [5,8–10].
The genetic basis of tame and aggressive behavioral phenotypes has been clearly demon-strated in multiple experiments [6,8,12]. Using the current genomic resources for the dog (i.e., microsatellite loci) the fox meiotic linkage map has been constructed [11–13] and used for the genetic mapping of fox behavioral phenotypes [12]. Although the dog and fox have very differ-ent karyotypes, the dog having 78 chromosomes and the fox 34 chromosomes and 0–8 B chro-mosomes, the conservation of synteny between the dog and fox genomes is well established [11,13,15–17]. Alignment of the fox meiotic linkage map against the dog genome has been used to identify positions of fox behavioral loci in the dog genome and to predict the locations of the gene orthologs on the fox chromosomes [18].
Genotyping-by-sequencing (GBS), like some other current technologies [19–21], uses re-striction enzymes (REs) to reduce genome complexity and next-generation sequencing for si-multaneous SNP discovery and genotyping [22]. Originally designed for SNP genotyping in plant species with sequenced genomes, the protocol can be adapted to a wide variety of species, including animals [23], either with or without reference sequence information [24]. GBS, how-ever, had not been previously used for genotyping canids. In the current study, we optimized the GBS protocol for the silver fox and genotyped a subset of individuals from the tame and ag-gressive strains. The resulting SNP data were used to analyze the genetic structure of the fox strains and to provide information critically needed for designing genetic mapping studies in these populations.
In a previous study, quantitative trait loci (QTL) analysis of fox experimental pedigrees identified several regions in the fox genome implicated in behavior [12] (Nelson et al., in prepa-ration). Because the fox meiotic linkage map did not cover distal regions of several fox chromo-somes, these regions have not been included in the QTL analysis. In this study, positions of the
#RB14039 (A. V. Kukekova). The funders had no role in study design, data collection and analysis, decision to publish, or preparation of the manuscript.
regions which showed allele frequency differences between the tame and aggressive popula-tions were compared with the posipopula-tions of previously identified behavioral QTLs. The region on the distal part of the fox chromosome 3 which showed significant allele frequency difference but was not included in the previous QTL analysis was evaluated in a greater detail to asses the effect of this region on behavior.
Behavioral differences between tame and aggressive fox strains have been maintained for many decades and generations [5,8–10]. Importantly, the intense selection for behavior in these strains has been combined with a strenuous effort to avoid inbreeding [5,6,8–10]. The fox strains may provide a more robust model for identification of targets of selection for be-havioral traits than the domestic dog where selection was acting on different traits including appearance and morphology. Genetic analysis of these fox populations should facilitate identi-fication of loci and genes involved in regulation of behavioral traits in canids.
Materials and Methods
Samples
Blood samples were collected from foxes maintained at the experimental farm of the Institute of Cytology and Genetics (ICG) in Novosibirsk, Russia. All animal procedures at the ICG com-plied with standards for humane care and use of laboratory animals by foreign institutions. The study was approved by the Institutional Animal Care and Use Committee (IACUC) of the University of Illinois at Urbana-Champaign. DNA was extracted from blood using Qiagen Maxi Blood kits, as per the manufacturer’s instructions (Qiagen, Valencia, CA).
Three sets of DNA samples we used in this study:
1. Genotyping-by-sequencing (GBS) set. We used samples from 40 individuals, 20 each from the tame and aggressive populations, for the genotyping-by-sequencing (GBS) experiment. Each population sample included equal numbers of males and females, and individuals were not closely related (i.e. did not share parents or, in most cases, grandparents).
2. Validation set. The second sample set was selected to validate the differences in allele fre-quency of SNPs from the distal part of fox chromosome 3 (VVU3) which were observed be-tween the tame and aggressive populations using GBS data. The validation set included 45 aggressive, 46 tame, and 92 conventional farm-bred foxes (foxes which were not deliberately selected for behavior). Again, animals were, generally, not closely related and animals from both genders were equally represented.
3. Genetic mapping set. Fox F2 pedigrees including parents, grandparents, and 536 offspring were used for construction of a meiotic linkage map of VVU3 and quantitative trait loci (QTL) analysis. The F2 pedigrees were developed in a previous study [12,25] by crossbreed-ing tame and aggressive foxes and then breedcrossbreed-ing F1 individuals to each other. All F1 pedi-grees were produced in reciprocal manner with respect to parental gender and population of origin. Behavior of F2 individuals was tested, videotaped and scored from video records with a set of 98 traits [7,12,25]. Principal component (PC) analysis was used to define main axes of fox behavior as previously described [12]. Both PC defined phenotypes and scores for individual behavioral traits were used for QTL mapping [12,25] (Nelson et al., in preparation).
Restriction enzyme (RE) selection and GBS optimization
(ApeKI,EcoT22I,PstI, andEcoT22I/PstI double digest) according to the enzyme manufactur-er’s protocol (New England Biolabs, Ipswich, MA). Samples were digested at 37°C for 2 hours and then, incubated at 80°C for 20 minutes to inactivate REs. Digested DNAs were ligated to adapters as previously described [22]. Samples were then purified (QIAquick PCR Purification Kit; Qiagen, Valencia, CA) and 2μl of each library was amplified in a 50μl volume containing 1 xTaqmaster mix (New England Biolabs, Ipswich, MA) and 25 pmol of each of two primers containing complementary sequences to ligated adapters and Illumina solid-phase oligonucle-otides bound to the flowcell lane surface. PCR was performed following the previously de-scribed protocol [22]. Amplified libraries were purified again, as above, and fragments were visualized using the Experion (Bio-Rad, Hercules, CA) (S1 Fig). DNA profiles forApeKI and
EcoT22I enzymes showed enrichment for fragments of desirable sizes (S1 Fig) and did not con-tain repeat-associated peaks, therefore libraries were made with both of these enzymes.
GBS library preparation and DNA sequencing
The first run of sequencing was done with separate libraries made withApeKI orEcoT22I en-zymes [22]. Forty-seven fox DNA samples comprising 20 tame, 20 aggressive, and seven dupli-cated individuals were genotyped. The DNA samples (100 ng) were digested, separately, with
ApeKI orEcoT22I at 37°C for 2 hours, and each sample was ligated to equal amounts of a dif-ferent barcode-containing adapter and the same common adapter. The 48 barcode sequences used forEcoT22I GBS library construction (a negative control was also included) are listed in S1 Table. The barcode sequences used forApeKI GBS library construction were published pre-viously [22]. Individual ligation reactions (5μL each) were pooled and DNA was purified (QIAquick PCR Purification Kit; Qiagen, Valencia, CA). A sample from the pooled library (10μL) was amplified by PCR (50μL total volume) containing 1 xTaqmaster mix (New En-gland Biolabs, Ipswich, MA) and 12.5 pmol of each PCR primer (seeS1 Table; [22]). PCR prod-ucts were purified as above and quantified using the Nanodrop 2000 (Thermo Scientific, Wilmington, DE). First, theApeKI orEcoT22I GBS libraries were sequenced on a HiSeq 2000 (Illumina Inc., San Diego, CA) in the same sequencing flowcell lane (single-end sequencing with 100 bp reads), with approximately half of the sequencing coming from each.
The average number of reads for theApeKI library was 1,482,234, with high variation in read numbers among samples (SD± 902,649; median: 1,569,610). Nine animals received so lit-tle sequence that they were judged as failed. This was likely due to technical errors during the li-brary preparation. Due to uneven results we did not use sequencing data generated for the
ApeKI library in the following analysis.
The average number of reads per sample for theEcoT22I library was 1,181,370 (SD +/-314,990; median: 1,066,520) and no samples failed. Because theEcoT22I library produced good results in the first run we sequenced already createdEcoT22I library on an additional flowcell lane to obtain deeper sequencing data for this library. This strategy produced coverage depths equivalent to 32-plex sequencing.
SNP discovery
(//hgdownload.soe.ucsc.edu/goldenPath /canFam3/bigZips/canFam3.fa.gz accessed on 31 March 2014 with md5sum 07084e3a9843991825a67891d23e3735). Dog chromosomes were renamed for compatibility with the GBS pipeline (leading‘chr’notations were removed, and X and M chromosomes were converted to 39 and 40). The modified dog genome was indexed for use with BWA version 0.7.8-r455 [27] and the fox tags were aligned to it with BWA aln/ samse using the default parameters. TBT files were created using the FastqToTBTPlugin (op-tions:—c 1, -y) and merged using the MergeTagsByTaxaFiles plugin (options:-s 300000000). SNPs were called with the tbt2vcfPlugin (options:-ak 3, -mnLCov 0, -mnMAF 0), where-ak 3 is the maximum number of alleles that are kept for each marker across the population; default: 3;-mnLCov 0 is the minimum locus coverage (proportion of taxa with a genotype; default: 0.0;-mnMAF 0 is the minimum minor allele frequency; default: 0.0 = no filter.
Duplicate SNPs were merged with the MergeDuplicateSNP_vcf_Plugin (options:-ak 3). For VCF files, likelihood scores were calculated according to Etter et al., 2011, formula 3.8 [28]. The most likely genotype was assigned, and a genotype quality (GQ) score was calculated ac-cording to GATK:
“GQ: The Genotype Quality, or Phred-scaled confidence that the true genotype is the one provided in GT. In the diploid case, if GT is 0/1, then GQ is really L(0/1) / (L(0/0) + L(0/1) + L(1/1)), where L is the likelihood that the sample is 0/0, 0/1/, or 1/1 under the model built for the NGS dataset. The GQ is simply the second most likely PL—the most likely PL. Be-cause the most likely PL is always 0, GQ = second highest PL—0. If the second most likely PL is greater than 99, we still assign a GQ of 99, so the highest value of GQ is 99.”
( http://gatkforums.broadinstitute.org/discussion/1268/how-should-i-interpret-vcf-files-produced-by-the-gatkaccessed on 21 November 2014)
TASSEL 4.3.7 was used to merge 7 replicated samples using the plugin MergeIdenticalTaxa-Plugin (options:-hetFreq 0.8, -maxAlleleVCF 3) [26].
SNP filtering
Two sets of SNPs, filtered and stringently filtered sets, were produced using VCFtools [29]. Fil-tering was initially performed using the following parameters: (1) the SNP was called at least 50% of individuals (–max-missing 0.5), (2) minor allele frequency (MAF) was>2.5% (–—maf
0.025), (3) only two alleles were present (–min-alleles 2–max-alleles 2), (4) average read depth<150 (–max-meanDP 150), (5)<60% heterozygous individuals for autosomal SNPs
and the X chromosome pseudoautosomal region (PAR) (0–6.65Mb) [30], or>30%
heterozy-gous individuals for the remainder of the X chromosome. More stringent filtering was per-formed by eliminating loci with quality score<98 (considers sequence depth per locus)
(–minGQ 98) and SNPs with missing data (–max-missing 1)
SNP evaluation
genotyping calls for all samples. The percent of concordant genotypes was calculated for each of the duplicated individuals in both the filtered and stringently filtered sets. The percent of the discordant genotypes due to missing data was also calculated for each duplicated individual but only in the filtered set.
The depth of the read coverage for the concordant and discordant SNPs was determined using the unmerged, filtered set of SNPs. The discordant genotypes due to missing data were not included in this analysis, only those SNPs that have genotypes for both replicates of the du-plicated individuals were used. The mean and standard deviation of the depth was calculated for both concordant and discordant SNPs in this data set. The average heterozygosity of SNPs located on the X chromosome outside of PAR (0–6.65Mb) [30] was calculated. This was com-puted for males and females in each population separately by determining the percent of indi-viduals of the same gender with heterozygous genotypes for each SNP, summing the values and dividing by the number of SNPs with data.
Estimating SNP positions on fox chromosomes
The location of GBS SNPs on the fox chromosomes was estimated by alignment of the fox mei-otic linkage map against the dog genome as previously described [11,13]. Briefly, dog chromo-somes were divided into corresponding“fox segments”based on the location of known mapped SSR markers. When dog chromosomes were split into syntenic regions located on two fox chromosomes, the length of the entire region between known dog markers was included on both of the corresponding fox chromosomes. This was done to prevent markers that might be far apart in the fox genome from appearing to be close together on the estimated fox map. SNPs that mapped to unassigned portions of the dog genome (regions with unknown synteny and“Un”chromosomes) were not mapped to fox positions.
Population structure analysis, estimation of LD and effective population
size
The stringently filtered SNP set (8,437 SNPs) was used for population structure analysis using Principal Component (PC) analysis and the Bayesian inference program STRUCTURE [31]. PC analysis was performed using PLINK2 (https://www.cog-genomics.org/plink2) [32]. Clus-tering analysis was performed using STRUCTURE v.2.3.4 [31,33] at 100,000 iterations of the Gibbs sampler after a burn-in of 100,000 iterations. Each run was repeated eight times at each value of K using correlated allele frequency model with admixture model with default settings. The runs were completed for K from 2 to 5 without the population information.
A subset of stringently filtered SNPs, whose positions were extrapolated on fox chromo-somes (8,405 SNPs), was used to estimate linkage disequilibrium (LD) decay in both tame and aggressive populations. Calculations of the squared correlation of the alleles at two loci (r2) were done in PLINK2 [32]. Distances between SNPs were estimated using the inferred SNP po-sitions on fox chromosomes and were based on the corresponding physical distances in the dog genome. Average r2between adjacent SNPs was computed by grouping SNPs by pairwise estimated physical distances into 14 bins ranging from 1–1000 bp to 100–210 Mb (size of the largest approximated fox chromosome is 210 Mb) (S2 Table). LD was also examined between SNPs located on different chromosomes (i.e., r2was computed for all pairs of SNPs in which both SNPs were located on separate fox chromosomes).
Estimation of population parameters
The filtered SNP set (48,294 SNPs) was used to calculate population parameters. Observed het-erozygosity was computed as the percent of heterozygous individuals (calculated separately for each population) among the total number of individuals that received genotype calls for that SNP. The average observed heterozygosity of the population was calculated as a sum of the SNP heterozygosity in that population divided by the total number of SNPs identified in the population. The mean, median and standard deviation of the minor allele frequency (MAF) were calculated separately for the tame and aggressive populations. Expected heterozygosity was calculated for each SNP by formula 2.16b from Hedrick, 4th Edition, page 93 [36]. The ob-tained value was divided by the number of individuals in the population with data (N) to calcu-late the proportion of individuals that would be expected to be heterozygous given the allele frequencies seen (the formula 2.16b calculates the expected number of individuals expected to be heterozygous). To calculate the mean expected heterozygosity, the expected heterozygosity values for each SNP within each population were summed and the obtained numbers were di-vided by the total number of SNPs.
Scan for SNP allele frequency differences between the fox populations
To identify regions in the fox genome where the two populations differed in allele frequency, 48,042 SNPs from the filtered set that mapped to the fox genome were compared between the tame and aggressive samples using the (–assoc–adjust) option in PLINK2 [32] withBonferroni correction.
In addition to the above analysis, we also computed fixation index (FST) using VCFtools
[29]. The value for“weighted_FST”is reported. The FSTwas calculated in windows of 1 Mb
with the overlap of 500 Kb using the Weir and Cockerham estimator [37] (–weir-fst-pop aggr–
weir-fst-pop tame–fst-window-size 1000000–fst-window-step 500000)
Confirmation of allele frequencies and construction of the fox
chromosome 3 (VVU3) map
To confirm and further characterize a region of genetic divergence between tame and aggres-sive populations on fox chromosome 3 (VVU3) and to extend the existing linkage map for this chromosome, four new fox markers (three SSRs and one indel) were developed. The indel was identified through sequencing fox amplicons produced using dog derived primers; two of the SSR markers corresponded to microsatellites identified in the dog genome, and one SSR was se-lected from the dog meiotic linkage map [38]. Primers were designed with Primer3 [39] using the dog genome sequence. Fluorescent primers (S3 Table) were genotyped following the proto-col described in Kukekova et al., 2007 [11]. Three SSR markers (VV0683, CM6.72b, CM6.75) and the indel marker (26749b) (S3 Table) were genotyped in fox F2 pedigrees which were pre-viously genotyped with 18 SSRs assigned to VVU3. A high confidence map was constructed at a confidence level of 1000:1 (LOD3) with crimap V2.504a [40]. Because GridQTL [41], the program used for QTL mapping, requires all markers to be placed at unique locations, the LOD 3.0 map was then saturated with unmapped SSRs regardless of the actual likelihood (LOD 0.0).
QTL analysis
Behavioral traits and phenotypes defined using PC analysis [12,13,25] were mapped in the F2 pedigrees using the F2inbred algorithm of GridQTL [41]. Permutation (n = 1,000) was used to establish chromosome-wide and experiment-wide significance thresholds.
Results and Discussion
Library sequencing
TheEcoT22I GBS library sequenced using Illumina technology yielded a total of 35.5 Gbp of sequence data. After quality filtering (sequences without a barcode or restriction site remnant or with“Ns”were discarded) 20.8 Gbp of sequence was retained for analysis. On average, this dataset contained 5,202,895 reads of 100 bp length per sample (SD± 2,019,764; median: 4,517,500).
SNP discovery and filtering
The GBS data were analyzed using the TASSEL-GBS pipeline to produce SNP calls [26]. A total of 2,003,563 tags (unique sequences) were identified and 1,530,295 (76.4%) of these aligned to single locations in the dog genome, 23,319 (1.2%) aligned to multiple positions, and 449,950 (22.5%) could not be aligned. The tags aligned to single locations in the dog genome produced a total of 101,940 SNP loci, of which 99,450 had exactly two alleles. Two sets of SNPs, filtered (48,294 SNPs,S4 Table) and stringently filtered (8,437 SNPs) sets were then pro-duced. The amount of information obtained using GBS in foxes demonstrates the value of this approach for simultaneous SNP identification and genotyping in species without well-devel-oped genomic tools.
SNP evaluation
The SNP call reproducibility was evaluated using duplicated samples. In the stringently filtered set, the genotypes of replicates were in perfect concordance (the two replicates received the exact same calls) for 97.9–99.2% of SNPs among the seven duplicated samples.
low level of heterozygosity of SNPs from X chromosome in males in the stringently filtered set are indicative of a low error rate among those SNPs.
Assignment of SNP positions on fox chromosomes
The dog is the fox's closest relative with a sequenced genome. We used the comparative dog/ fox map [13] and the known positions of fox SNPs in the dog genome to infer SNP positions on the fox chromosomes. Positions of 48,042 SNPs from the filtered SNP set (99.5% from the total number of SNPs in this set) and positions of 8,405 SNPs from the stringently filtered set (99.6% from the total number of SNPs in this set) were inferred in the fox.
Comparative analysis of tame and aggressive fox populations using
SNPs
Principal component analysis identified genetic divergence between the two popula-tions. The stringently filtered set of 8,437 SNPs with no missing data for any of the 40 indi-viduals was subjected to Principal Component (PC) analysis. The PC analysis revealed genetic differences between the two strains (Fig 1). PC1 separated the samples into tame and aggressive
Fig 1. Principal component analysis.Principal component analysis of SNP data for 20 tame and 20 aggressive foxes. 8,437 SNPs with genotypes available for all individuals were used in this analysis. Aggressive individuals are represented by red dots, tame individuals are represented by green triangles. PC1 is plotted on the x-axis, PC2 is plotted on the y-axis.
groups, in agreement with the fact that the two populations have been maintained separately for more than 40 generations. PC2 identified more diversity in the aggressive strain than in the tame one, which may be attributable to the differences in history of the two populations. The tame population was maintained as a closed line through the breeding program, while the ag-gressive population experienced an introduction of foxes from conventionally farm-bred stock in the 1990s.
Estimation of the genetic structure using STRUCTURE. The genetic structure analysis at K = 2 clearly separated the tame and aggressive individuals into two clusters (Fig 2). At K = 3 the stratification of the aggressive population became apparent. The further segmentation of the aggressive population was apparent at K = 4 and 5. Very little stratification was observed within the tame population at all K tested. The split of the aggressive population into subpopu-lation at K = 3 and higher Ks is consistent with the results of the PC analysis. In fact, the aggres-sive individuals which showed highest and lowest amount of segmentation based on the assignment into inferred clusters at K = 3, 4, and 5 had highest and lowest PC2 values, respec-tively. Both the PC analysis and the population structure analysis revealed the genetic
Fig 2. Estimation of population structure using STRUCTURE.Cluster analysis of fox genotypes was performed at four values of K (2, 3, 4, and 5) without population information. The numbers of assumed clusters are indicated on the y-axis. The population origin of individuals is indicated on x-axis. On each graph the individuals are listed in the order obtained at K = 3. Each individual is represented by a bar that is segmented into colors based on the assignment into inferred clusters given the assumption of K populations. The length of the colored segment is the estimated proportion of the individual’s genome belonging to that cluster. The analysis was run in 8 replicates for each K, the replicate with the highest likelihood is shown. The genetic structure analysis clearly differentiated the tame population from the aggressive one and did not reveal significant population stratification within the tame population at every K tested. In contrast, the population stratification within the aggressive population became apparent at K = 3.
diversification within the aggressive population which was likely caused by the admixture of the aggressive population with conventional population in 1990s.
Estimation of linkage disequilibrium and effective population size. The relative order of and distances between SNPs in the fox genome were established by extrapolation from the dog genome. An average r20.5 was observed for SNP pairs with inter-marker distance less than 1 Kb in both tame and aggressive populations. An average r20.2 was observed for SNPs located within 100–500 Kb in tame and 50–100 Kb in the aggressive population (Fig 3,S2 Table). In general, the r2values for SNPs in bins ranging from 1–1000 bp to 1Mb-5Mb were lower in the aggressive population than in the tame indicating a faster decay of LD in the ag-gressive population. The number of SNP pairs with r2= 1 was slightly higher in tame than in the aggressive population (S2 Table). Less than 10% of SNP pairs with r2= 1 was observed for
Fig 3. Estimation of linkage disequilibrium (r2) in tame and aggressive fox populations.Distributions of r2values between pairs of SNPs separated by
different distances are compared between tame (green) and aggressive (red) populations. SNP pairs were divided into 14 sets (bins) using the estimated distances between SNPs in the fox genome (S2 Table). Each bin is represented by a doubled bar (green and red) on the graph. The range of distances between SNPs in each bin is indicated on the x-axis. The width of the bar represents the relative number of SNP pairs in that bin for that population after a log transformation (wider bars have more pairs of SNPs). Exact numbers of SNP pairs in each bin are presented inS2 Table. The y-axis indicates r2values for
pairs of SNPs. The yellow diamonds correspond to the mean r2for all SNPs in that bin in the population. The white circles correspond to the median values.
The thin black line within each bar represents r2values in that bin in the population in the interval from the 25th to 75th percentile. The horizontal line
corresponds r2= 0.2.
SNPs located over 10 kb apart in the aggressive population and over 50 kb apart in the tame population (S2 Table).
To test that our data do not show significant spurious associations between unlinked SNPs the r2was calculated for SNPs assigned to different fox chromosomes. In total, 22,184,914 pairs of SNPs in which each SNP in a pair was located on a different fox chromosome were analyzed in the tame and 27,725,667 pairs in the aggressive population. No substantial LD between un-linked SNPs was observed. Average r2between SNPs located on different fox chromosomes was 0.055 (±0.079) in tame and 0.058 (±0.079) in aggressive populations.
Although estimation of the LD in fox strains could be influenced by the small sample size used in this study, the small number of SNPs, and imperfect calculation of intermarker dis-tances based on fox/dog synteny, it still provides a useful indication of the extent of LD in these populations. The length of LD observed in the tame fox population is comparable with average LD length in dog breeds (r20.2 was reported for SNPs located at the distance 500 Kb for sev-eral dog breeds [1]) and pigs (r2= 0.15 and 0.2 were reported in two pig breeds for SNPs locat-ed 1 Mb apart [42]); and it is moderately higher than LD reported for two cow breeds (r2= 0.3 was reported for SNPs located less than 100 kb in Holstein cattle and r2= 0.25 for SNPs less than 20 kb in Fleckvieh breed [43–45]). The LD decay in cows is comparable with the LD pro-file in the aggressive fox strain. The length of LD in both fox strains is shorter than the length of LD in outbred mouse stock (r2= 0.5 was reported for SNPs located 2 Mb apart [46]). The LD estimations calculated using sequence data has been reported to be lower than those calcu-lated using SNP chip generated data, due to ascertainment bias of SNPs on the SNP chip [44]. The different technologies and MAF cut-offs between the studies makes the comparison be-tween studies and species an imperfect estimation. The differences bebe-tween our two popula-tions, which were calculated from the same data, likely reflect the existing differences between the two strains.
Effective population sizes of the aggressive and tame populations, respectively, were 38.0 (95% CI: 37.8–38.2) and 81.5 (95% CI: 80.5–82.5). Although the aggressive population has a smaller number of breeding animals and lower effective population size, more genetic variation has been preserved in this population. These findings may reflect the fact the aggressive popu-lation had an inclusion of outside individuals in the recent past in comparison to the tame pop-ulation, which experienced a longer period of closed breeding.
Comparison of SNP allele frequencies between tame and aggressive
fox populations
Analysis of the allele frequency differences between the two populations. Overall, a rela-tively high level of heterozygosity was observed in both populations (Table 1), clearly demon-strating that efforts to limit inbreeding in these strains has been effective. A slightly lower level of heterozygosity was observed in the tame population than in the aggressive one (mean ex-pected heterozygosity in tame population was 0.22 versus 0.24 in the aggressive population). The average SNP minor allele frequency was slightly lower in the tame strain than in the
Table 1. SNP minor allele frequency and heterozygosity in tame and aggressive populations.
Population Number of SNPs
Mean MAF
Median MAF
SD MAF
Fixed in the population
Mean Expected Heterozygosity
Mean Observed SNP
Heterozygosity
Median Observed SNP
Heterozygosity
SD SNP Heterozygosity
Tame 48,294 0.148 0.088 0.147 8,014 0.22 0.16 0.10 0.16
Aggressive 48,294 0.163 0.115 0.147 5,514 0.24 0.17 0.11 0.16
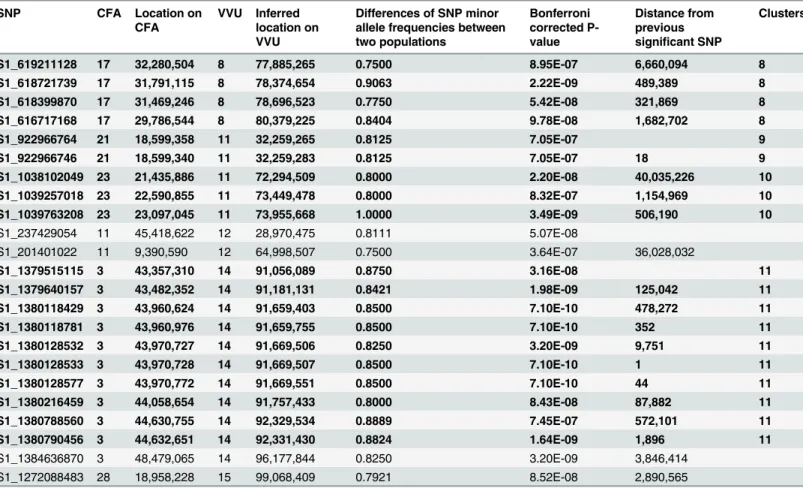
aggressive strain and a higher percent of SNPs was monomorphic in the tame than in the ag-gressive strain (Table 1). Comparison of allele frequencies between the two populations (Fig 4a,Table 2) identified 68 SNPs on 12 fox chromosomes that showed significant differences in allele frequency (Bonferroni correction of association test; p<10-7). These included 19“
isolat-ed”SNPs (>2Mb from another significant SNP), and 49 SNPs located within 11 clusters on
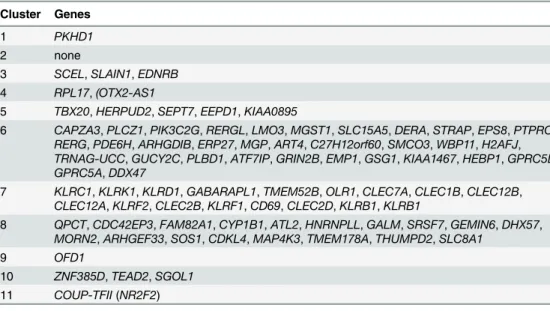
seven fox chromosomes. Clusters comprised at least two SNPs located within a 2 Mb interval (Table 2). To further characterize these genomic intervals, genes located inside or within 50,000 bp from start and end of these regions were identified based on dog genome annotations (Table 3). Several of these intervals were found to include genes involved in neurological func-tioning and behavior (Table 3).
The fixation index analysis. The weighted fixation index analysis (FST) of fox populations
identified 28 windows with FST0.5 (S2 Fig,S6 Table,S3 Fig). The windows with high FST
val-ues clustered into nine regions in the fox genome (Fig 4a;S6 Table). Out of 18 windows with FST0.5 identified on fox chromosome 8 (VVU8) 14 windows overlap with the genomic
re-gions identified in the analysis of allele frequency differences (S3 Fig). Four windows with high FSTvalues (S6 Table) which were identified on VVU6 and VVU14 also overlap with the regions
identified in the analysis of allele frequency differences (Fig 4a).
Analysis of genomic regions on VVU3, VVU8 and VVU14 in fox
crossbred pedigrees
Genomic regions with increased divergence between the tame and aggressive populations could represent regions influenced by either behavioral selection or random fixation (genetic drift). To distinguish between these processes, we hypothesized that regions representing true selection targets would be identified by both selective sweep mapping in fox populations and QTL mapping of behavioral traits in fox experimental pedigrees. Regions influenced by ran-dom fixation, on the other hand, would be identified only by homozygosity mapping, but would not co-segregate with behavioral phenotypes in informative pedigrees. To test this hy-pothesis, three genomic regions on fox chromosomes 3 (VVU3), 8 (VVU8) and 14 (VVU14), which were among the regions which showed the greatest allele frequency differences between the two populations (Table 2;Fig 4;S2 Fig,S6 Table;S3 Fig), were examined in more detail.
Distal region of VVU3. The distal part of VVU3 contains a genomic region that appears to be approaching fixation for different alleles in the tame and aggressive populations. Three SNPs located within a 117 bp interval showed significant differences in allele frequencies in-cluding SNP-S1_1977727423, which showed the most significant differences in the Bonferroni corrected association test among all fox SNPs. The SNP-S1_1977727423 was monomorphic in the aggressive population while the frequency of the only allele observed in the aggressive pop-ulation was 0.03 in the tame poppop-ulation. The allele frequencies for two other SNPs
(SNP-S1_1977727319 and SNP-S1_1977727436) were the same for both SNPs: the minor allele frequency for these SNPs was 0.85 in the aggressive and 0.03 in the tame population. The distal region of VVU3 had been excluded from previous QTL mapping studies because this region has not been represented on the fox meiotic linkage map.
Allele frequency differences on distal VVU3 were validated in an additional sample set com-prising tame (46), aggressive (45), and conventionally farm-bred foxes (92) using an indel marker, 26749b, located about 122 Kb from SNP-S1_1977727423. Details of this analysis are presented inS1 File. The Fisher exact test analysis identified significant differences in indel allele frequencies between tame and aggressive, and between tame and conventionally bred foxes; in both cases a significance level of p<0.0001 was observed. No significant difference was
conventionally bred population is similar to the ancestral population for both tame and aggres-sive populations, these results suggest that the relevant genomic region on VVU3 has been under intense selection or drift in the tame population but not in the aggressive population.
To evaluate the effect of distal region of VVU3 on fox behavior we extended the meiotic linkage map for VVU3 [13] using new dog-derived SSR and indel markers (S3 Table) by 38.4 cM (S4 Fig). However, the QTL analysis using this new VVU3 map did not identify any signifi-cant behavioral QTL in F2 pedigrees in the region of interest. These results suggest that the dis-tal region on VVU3 may represent an example of random allele fixation in a closed population (i.e. genetic drift) rather than a selective sweep associated with selection for behavior. Alterna-tively, we cannot rule out the possibility that the behavioral assay in these populations does not capture some behavioral or even physiological parameters important for expression of tame or aggressive behavior. A more thorough analysis is needed to exclude this candidate region as a region involved in regulation of behavior.
VVU8. VVU8 contains 29 out of the 68 SNPs which showed significant differences in al-lele frequency between the tame and aggressive strains. The region of genomic divergence on VVU8 includes three of the 11 SNP clusters. It is estimated to be about 52 Mb in the fox ge-nome and spans two different dog chromosomes, CFA27 and CFA17. In this extended region there are also many SNPs that do not reach our threshold, but show a high level of allele fre-quency differences between the tame and aggressive populations (Fig 4a;S3 Fig). Comparison of this region with previously identified QTLs for PC defined behavioral phenotypes did not identify any significant overlap. However, suggestive QTLs for several individual behavioral traits were identified in this area of VVU8 including the QTL for the trait“Attack”[25] (Nel-son et al., in preparation), therefore this region requires further evaluation. While it is difficult to draw firm conclusions or find specific genes in such a large area, some genes, notably
GRIN2B(NMDA) with GO terms including (http://amigo.geneontology.org/)“startle
re-sponse”and“behavioral fear response”andGABARAPL1(GEC1), which enhances expression of the kappa opioid receptor [47], both stand out as possible candidate genes.
VVU14. Comparison of allele frequencies between tame and aggressive individuals identi-fied 11 SNPs on fox chromosome 14 (VVU14) which met our significance threshold, 10 of which are grouped tightly within a 1.3 Mb region (Fig 4,Table 2). Previously, we identified sev-eral significant QTLs for PC defined behavioral phenotypes and individual behavioral traits on VVU14 [25] (Nelson et al., in preparation). The behavioral QTL intervals include the 1.3 Mb region identified in this study. This region on VVU14 corresponds to the dog region
CFA3:43,357,310–44,632,651 bp and contains one gene,COUP-TFII (NR2F2). COUP-TFII is an orphan nuclear receptor belonging to the superfamily of steroid/thyroid hormone receptors [48]. COUP-TFII expression during embryonic development is significant for the development of forebrain and several other brain regions including amygdala [48–50]. It has been shown that COUP-TFII can also act as a silencer of the human oxytocin gene promoterin vitro[51].
COUP-TFIIis an interesting candidate gene and its role in regulation of behavior in foxes will
be further evaluated.
Identification of loci under selection in artificially selected populations and natural bottle-necked populations remains to be a challenge [52,53]. Results of the selective sweep analysis in
positions in the fox genome in megabases.4B.Differences in allele frequency of SNPs on VVU14. The horizontal colored bars on the x-axis correspond to syntenic dog chromosomes.4C.Multi SNPs region on VVU14 with significant allele frequency differences between the two populations. CFA3:42,000,000– 46,000,000 corresponding to the cluster on VVU14 with multiple SNPs that are highly significant. The genes in the region are indicated just above the x-axis. The geneNR2F2(COUP-TFII) is the only gene located in the significant region.
Table 2. SNPs with significant allele frequency differences between tame and aggressive populations.
SNP CFA Location on
CFA
VVU Inferred location on VVU
Differences of SNP minor allele frequencies between two populations
Bonferroni corrected P-value
Distance from previous significant SNP
Clusters
S1_285236887 12 18,837,258 1 167,384,431 0.80 1.36E-08 1
S1_285704585 12 19,304,956 1 167,852,129 0.82 9.59E-07 467,698 1
S1_812259209 2 51,452,767 2 138,634,343 0.80 3.76E-08
S1_1648737836 36 1,743,329 3 1,743,329 0.79 1.08E-07
S1_1673084403 36 26,089,896 3 26,089,896 0.77 1.74E-07 24,346,567
S1_1964707411 6 54,892,000 3 127,827,426 0.75 2.05E-07 101,737,530
S1_1977727319 6 67,911,908 3 140,847,334 0.82 1.28E-08 13,019,908 2
S1_1977727423 6 67,912,012 3 140,847,438 0.97 3.58E-13 104 2
S1_1977727436 6 67,912,025 3 140,847,451 0.82 1.28E-08 13 2
S1_1531784156 32 23,626,827 4 42,200,559 0.88 2.20E-07
S1_1794484892 4 61,861,562 4 127,688,948 0.86 1.16E-08 85,488,389
S1_1712828536 38 4,119,843 5 105,433,843 0.82 4.94E-09
S1_986356551 22 31,130,422 6 31,130,422 0.77 6.91E-07 3
S1_987024936 22 31,798,807 6 31,798,807 0.75 8.95E-07 668,385 3
S2_113588644 8 32,614,012 6 94,053,946 0.80 3.76E-08 62,255,139 4
S2_113588820 8 32,614,188 6 94,054,122 0.80 3.76E-08 176 4
S2_148636413 8 67,661,781 6 129,101,715 0.75 8.95E-07 35,047,593
S1_540429371 16 13,131,693 7 13,131,693 0.7750 9.22E-08
S1_449099782 14 46,959,949 7 106,592,795 1.0000 2.05E-07 93,461,102 5
S1_449883141 14 47,743,308 7 107,376,154 0.7500 9.48E-07 783,359 5
S1_1235603545 27 28,350,100 8 28,350,100 0.8417 1.05E-08 6
S1_1235712667 27 28,459,222 8 28,459,222 0.8973 1.52E-07 109,122 6
S1_1236925680 27 29,672,235 8 29,672,235 0.7500 8.95E-07 1,213,013 6
S1_1238406667 27 31,153,222 8 31,153,222 0.7750 5.42E-08 1,480,987 6
S1_1240026884 27 32,773,439 8 32,773,439 0.8000 3.09E-08 1,620,217 6
S1_1240026888 27 32,773,443 8 32,773,443 0.8250 4.94E-09 4 6
S1_1240026889 27 32,773,444 8 32,773,444 0.8250 4.94E-09 1 6
S1_1240026890 27 32,773,445 8 32,773,445 0.8250 4.94E-09 1 6
S1_1240254310 27 33,000,865 8 33,000,865 0.8000 2.20E-08 227,420 6
S1_1240254354 27 33,000,909 8 33,000,909 0.8000 2.20E-08 44 6
S1_1240725455 27 33,472,010 8 33,472,010 0.8184 1.81E-08 471,101 6
S1_1240725498 27 33,472,053 8 33,472,053 0.8184 1.81E-08 43 6
S1_1240736757 27 33,483,312 8 33,483,312 0.8711 6.52E-10 11,259 6
S1_1242777422 27 35,523,977 8 35,523,977 0.8591 1.34E-08 2,040,665 7
S1_1242825122 27 35,571,677 8 35,571,677 0.8000 3.09E-08 47,700 7
S1_1243526396 27 36,272,951 8 36,272,951 0.9118 5.75E-09 701,274 7
S1_1243526433 27 36,272,988 8 36,272,988 0.9118 5.75E-09 37 7
S1_1243639565 27 36,386,120 8 36,386,120 0.8000 4.02E-08 113,132 7
S1_1243639695 27 36,386,250 8 36,386,250 0.7500 7.52E-07 130 7
S1_1246055552 27 38,802,107 8 38,802,107 0.8000 3.76E-08 2,415,857
S1_1252424198 27 45,170,753 8 45,170,753 0.7750 1.97E-07 6,368,646
S1_648198405 17 61,267,781 8 48,897,988 0.8733 8.80E-07 3,727,235
S1_644111987 17 57,181,363 8 52,984,406 0.8000 2.20E-08 4,086,418
S1_641943154 17 55,012,530 8 55,153,239 0.8250 2.08E-08 2,168,833
S1_625871222 17 38,940,598 8 71,225,171 0.8500 7.10E-10 16,071,932
such populations can be influenced by population demographic histories and reduced effective population sizes [54–56]. Application of a combination of methods including selective sweep mapping in populations under selection and QTL analysis of informative pedigrees represents a promising strategy for differentiation between the signals of selection and random fixation and disentangling genetic architecture of phenotypes under selection [57–62].
The pilot analysis of the genetic structure of tame and aggressive fox strains using GBS clearly shows the potential for using these strains for high-resolution genetic mapping of be-havioral phenotypes. The genetic structure and the effective population size of tame and ag-gressive strains indicate that a significant amount of genetic diversity has been preserved in both populations. Simultaneously, intensive selection for behavior in these populations must favor the accumulation of specific alleles in the targeted regions of selection. Understanding ge-netic composition of these populations will facilitate the use of this unique animal model for studying the genetics of social interactive behavior. The current analysis confirmed loci previ-ously determined to be under selection [12] (Nelson et al., in preparation) and pinpointed novel genomic regions to be investigated for their role in regulation of behavior.
Table 2. (Continued)
SNP CFA Location on
CFA
VVU Inferred location on VVU
Differences of SNP minor allele frequencies between two populations
Bonferroni corrected P-value
Distance from previous significant SNP
Clusters
S1_619211128 17 32,280,504 8 77,885,265 0.7500 8.95E-07 6,660,094 8
S1_618721739 17 31,791,115 8 78,374,654 0.9063 2.22E-09 489,389 8
S1_618399870 17 31,469,246 8 78,696,523 0.7750 5.42E-08 321,869 8
S1_616717168 17 29,786,544 8 80,379,225 0.8404 9.78E-08 1,682,702 8
S1_922966764 21 18,599,358 11 32,259,265 0.8125 7.05E-07 9
S1_922966746 21 18,599,340 11 32,259,283 0.8125 7.05E-07 18 9
S1_1038102049 23 21,435,886 11 72,294,509 0.8000 2.20E-08 40,035,226 10
S1_1039257018 23 22,590,855 11 73,449,478 0.8000 8.32E-07 1,154,969 10
S1_1039763208 23 23,097,045 11 73,955,668 1.0000 3.49E-09 506,190 10
S1_237429054 11 45,418,622 12 28,970,475 0.8111 5.07E-08
S1_201401022 11 9,390,590 12 64,998,507 0.7500 3.64E-07 36,028,032
S1_1379515115 3 43,357,310 14 91,056,089 0.8750 3.16E-08 11
S1_1379640157 3 43,482,352 14 91,181,131 0.8421 1.98E-09 125,042 11
S1_1380118429 3 43,960,624 14 91,659,403 0.8500 7.10E-10 478,272 11
S1_1380118781 3 43,960,976 14 91,659,755 0.8500 7.10E-10 352 11
S1_1380128532 3 43,970,727 14 91,669,506 0.8250 3.20E-09 9,751 11
S1_1380128533 3 43,970,728 14 91,669,507 0.8500 7.10E-10 1 11
S1_1380128577 3 43,970,772 14 91,669,551 0.8500 7.10E-10 44 11
S1_1380216459 3 44,058,654 14 91,757,433 0.8000 8.43E-08 87,882 11
S1_1380788560 3 44,630,755 14 92,329,534 0.8889 7.45E-07 572,101 11
S1_1380790456 3 44,632,651 14 92,331,430 0.8824 1.64E-09 1,896 11
S1_1384636870 3 48,479,065 14 96,177,844 0.8250 3.20E-09 3,846,414
S1_1272088483 28 18,958,228 15 99,068,409 0.7921 8.52E-08 2,890,565
SNPs with differences in allele frequency between two populations at p<10-7(Bonferroni correction of PLINK2 [32] association test). The absolute differences of SNP minor allele frequencies between the tame and aggressive populations are listed. These SNPs are presented as dots above the significance line (–log10>6) onFig 4. SNPs are listed in the order of the fox map. Multi SNP clusters are in bold and numbered in the rightmost column. Multi SNP clusters are regions where SNPs that met the threshold are within 2 Mb to the next significant SNP. Genes that are in or near (50,000 bp) the multi SNP clusters are listed inTable 3. Dog chromosome—CFA; Fox chromosome—VVU.
Conclusions
The first analysis of fox populations using genome-wide distributed SNPs (48,294 SNPs) re-vealed the genetic structure of the tame and aggressive strains and identified several genomic regions with significantly different allele frequencies between the two populations. The popula-tion genomic parameters of the fox strains clearly indicated the deep potential of these strains for high resolution mapping of behavior. The growth of sequencing technologies will allow us to search for signals of selection in these fox strains by whole genome sequencing. The VVU14 region with high allele frequency differences between the two strains overlaps with a previously identified QTL for behavior in fox experimental pedigrees emphasizing the importance of this region for behavior. Comparative analysis of selective sweep positions and QTL intervals can be used as a promising approach for differentiation between selective sweeps associated with selection and regions of random fixation [19,60]. Identification of selective sweeps associated with QTLs will be highly advantageous for selection of positional candidate genes. The GBS protocol developed in this study can be easily adapted for genomic studies of other canids.
Supporting Information
S1 Fig. Details about enzyme selection and exclusion. (PDF)
S2 Fig. Fixation index (FST) analysis in fox populations. (PDF)
S3 Fig. Allele frequency differences and significant FSTwindows on VVU8. (PDF)
S4 Fig. Meiotic linkage map of VVU3. (PDF)
Table 3. Genes located inside or within 50,000 bp from start and end of the multi SNP clusters in the dog genome.
Cluster Genes
1 PKHD1
2 none
3 SCEL,SLAIN1,EDNRB
4 RPL17,(OTX2-AS1
5 TBX20,HERPUD2,SEPT7,EEPD1,KIAA0895
6 CAPZA3,PLCZ1,PIK3C2G,RERGL,LMO3,MGST1,SLC15A5,DERA,STRAP,EPS8,PTPRO,
RERG,PDE6H,ARHGDIB,ERP27,MGP,ART4,C27H12orf60,SMCO3,WBP11,H2AFJ,
TRNAG-UCC,GUCY2C,PLBD1,ATF7IP,GRIN2B,EMP1,GSG1,KIAA1467,HEBP1,GPRC5D,
GPRC5A,DDX47
7 KLRC1,KLRK1,KLRD1,GABARAPL1,TMEM52B,OLR1,CLEC7A,CLEC1B,CLEC12B,
CLEC12A,KLRF2,CLEC2B,KLRF1,CD69,CLEC2D,KLRB1,KLRB1
8 QPCT,CDC42EP3,FAM82A1,CYP1B1,ATL2,HNRNPLL,GALM,SRSF7,GEMIN6,DHX57,
MORN2,ARHGEF33,SOS1,CDKL4,MAP4K3,TMEM178A,THUMPD2,SLC8A1
9 OFD1
10 ZNF385D,TEAD2,SGOL1
11 COUP-TFII(NR2F2)
Cluster numbers refer to the numbering fromTable 2.
S1 File. Genotyping of 26749b marker in three fox populations. (PDF)
S1 Table. Adapters used for construction ofEcoT22I library.
(PDF)
S2 Table. Bins used for calculation of average r2between SNPs located on the same chro-mosome.
(PDF)
S3 Table. Florescent primers used for genotyping S1_1977727423 associated indels and SSRs markers on VVU3.
(PDF)
S4 Table. The list of fox SNPs and their locations in the dog genome. (XLSX)
S5 Table. SNP evaluation statistics. (PDF)
S6 Table. Genomic regions highlighted in the fixation index (FST) analysis. (PDF)
Acknowledgments
We are grateful to Irina V. Pivovarova, Tatyana I. Semenova, and all the animal keepers at the ICG experimental farm for research assistance. We want to thank Lisa M. Blanchard and Char-lotte B. Acharya for technical assistance and Robert J. Elshire for insightful discussion on ex-perimental design and data analysis. We thank four reviewers of the manuscript for their helpful comments.
Author Contributions
Conceived and designed the experiments: A. V. Kukekova SEM JLJ GMA LNT. Performed the experiments: SEM JLJ HW HWFF SVT A. V. Kharlamova RGG AVV. Analyzed the data: JLJ KEH SEM A. V. Kukekova HW SVT HWFF. Contributed reagents/materials/analysis tools: LNT A. V. Kharlamova RGG AVV GMA A. V. Kukekova. Wrote the paper: A. V. Kukekova JLJ SEM KEH LNT GMA.
References
1. Lindblad-Toh K, Wade CM, Mikkelsen TS, Karlsson EK, Jaffe DB, Kamal M, et al. Genome sequence, comparative analysis and haplotype structure of the domestic dog. Nature. 2005; 438(7069):803–19. doi:10.1038/nature04338PMID:16341006
2. Wayne RK, Geffen E, Girman DJ, Koepfli KP, Lau LM, Marshall CR. Molecular systematics of the Cani-dae. Syst Biol. 1997; 46(4):622–53. PMID:11975336
3. Belyaev DK. Domestication of Animals. Sci J. 1969; 5(1):47–52.
4. Belyaev DK. Destabilizing Selection as a Factor in Domestication. J Hered. 1979; 70(5):301–8. PMID: 528781
5. Trut LN. Early canid domestication: The farm-fox experiment. Am Sci. 1999; 87(2):160–9. doi:10.1511/ 1999.20.813
7. Kukekova AV, Trut LN, Acland GM. Genetics of Domesticated Behavior in Dogs and Foxes. In: Grandin T, Deesing M, editors. Genetics and the Behavior of Domestic Animals. 2nd Edition ed: Elsevier; 2014. p. 361–96.
8. Trut LN, Oskina IN, Kharlamova AV. Experimental Studies of Early Canid Domestication. In: Ostrander EA, Ruvinsky A, editors. Genetics of the Dog, 2nd Edition. 2nd ed. Oxfordshire: CAB International; 2012. p. 12–37.
9. Trut LN, Plyusnina IZ, Oskina IN. An experiment on fox domestication and debatable issues of evolu-tion of the dog. Russian Journal of Genetics. 2004; 40(6):644–55.
10. Trut L, Oskina I, Kharlamova A. Animal evolution during domestication: the domesticated fox as a model. Bioessays. 2009; 31(3):349–60. doi:10.1002/bies.200800070PMID:19260016
11. Kukekova AV, Trut LN, Oskina IN, Johnson JL, Temnykh SV, Kharlamova AV, et al. A meiotic linkage map of the silver fox, aligned and compared to the canine genome. Genome Res. 2007; 17(3):387–99. doi:10.1101/gr.5893307PMID:17284676
12. Kukekova AV, Trut LN, Chase K, Kharlamova AV, Johnson JL, Temnykh SV, et al. Mapping Loci for fox domestication: deconstruction/reconstruction of a behavioral phenotype. Behav Genet. 2011; 41 (4):593–606. doi:10.1007/s10519-010-9418-1PMID:21153916
13. Kukekova AV, Temnykh SV, Johnson JL, Trut LN, Acland GM. Genetics of behavior in the silver fox. Mamm Genome. 2012; 23(1–2):164–77. doi:10.1007/s00335-011-9373-z
14. Kukekova AV, Trut LN, Oskina IN, Kharlamova AV, Shikhevich SG, Kirkness EF, et al. A marker set for construction of a genetic map of the silver fox (Vulpes vulpes). J Hered. 2004; 95(3):185–94. doi:10. 1093/Jhered/Esh033PMID:15220384
15. Yang F, O'Brien PCM, Milne BS, Graphodatsky AS, Solanky N, Trifonov V, et al. A complete compara-tive chromosome map for the dog, red fox, and human and its integration with canine genetic maps. Ge-nomics. 1999; 62(2):189–202. doi:10.1006/Geno.1999.5989PMID:10610712
16. Yang F, Milne BS, Schelling C, Dolf G, Schlapfer J, Switonski M, et al. Chromosome identification and assignment of DNA clones in the dog using a red fox and dog comparative map. Chromosome Res. 2000; 8(2):93–100. doi:10.1023/A:1009251917072PMID:10780697
17. Becker SE, Thomas R, Trifonov VA, Wayne RK, Graphodatsky AS, Breen M. Anchoring the dog to its relatives reveals new evolutionary breakpoints across 11 species of the Canidae and provides new clues for the role of B chromosomes. Chromosome Res. 2011; 19(6):685–708. doi: 10.1007/s10577-011-9233-4PMID:21947954
18. Kukekova AV, Johnson JL, Teiling C, Li L, Oskina IN, Kharlamova AV, et al. Sequence comparison of prefrontal cortical brain transcriptome from a tame and an aggressive silver fox (Vulpes vulpes). BMC Genomics. 2011; 12:482. doi:10.1186/1471-2164-12-482PMID:21967120
19. Hohenlohe PA, Bassham S, Etter PD, Stiffler N, Johnson EA, Cresko WA. Population genomics of par-allel adaptation in threespine stickleback using sequenced RAD tags. PLoS Genet. 2010; 6(2): e1000862. doi:10.1371/journal.pgen.1000862PMID:20195501
20. Weber JN, Peterson BK, Hoekstra HE. Discrete genetic modules are responsible for complex burrow evolution inPeromyscusmice. Nature. 2013; 493(7432):402–5. doi:10.1038/nature11816PMID: 23325221
21. Baird NA, Etter PD, Atwood TS, Currey MC, Shiver AL, Lewis ZA, et al. Rapid SNP Discovery and Ge-netic Mapping Using Sequenced RAD Markers. PLoS One. 2008; 3(10).
22. Elshire RJ, Glaubitz JC, Sun Q, Poland JA, Kawamoto K, Buckler ES, et al. A Robust, Simple Genotyp-ing-by-Sequencing (GBS) Approach for High Diversity Species. PLoS One. 2011; 6(5).
23. De Donato M, Peters SO, Mitchell SE, Hussain T, Imumorin IG. Genotyping-by-sequencing (GBS): a novel, efficient and cost-effective genotyping method for cattle using next-generation sequencing. PLoS One. 2013; 8(5):e62137. doi:10.1371/journal.pone.0062137PMID:23690931
24. Lu F, Lipka AE, Glaubitz J, Elshire R, Cherney JH, Casler MD, et al. Switchgrass genomic diversity, ploidy, and evolution: novel insights from a network-based SNP discovery protocol. PLoS Genet. 2013; 9(1):e1003215. doi:10.1371/journal.pgen.1003215PMID:23349638
25. Kukekova AV, Temnykh SV, Acland GM, Johnson JL, Kharlamova AV, Vladimirova AV, et al., editors. Genetics of Complex Interactive Behaviors in the Silver Fox. Society for Molecular Biology and Evolu-tion (SMBE); 2013 July 7–11; Chicago, IL.
26. Glaubitz JC, Casstevens TM, Lu F, Harriman J, Elshire RJ, Sun Q, et al. TASSEL-GBS: a high capacity genotyping by sequencing analysis pipeline. PLoS One. 2014; 9(2):e90346. doi:10.1371/journal.pone. 0090346PMID:24587335
28. Etter PD, Bassham S, Hohenlohe PA, Johnson EA, Cresko WA. SNP discovery and genotyping for evolutionary genetics using RAD sequencing. Methods Mol Biol. 2011; 772:157–78. doi: 10.1007/978-1-61779-228-1_9PMID:22065437
29. Danecek P, Auton A, Abecasis G, Albers CA, Banks E, DePristo MA, et al. The variant call format and VCFtools. Bioinformatics. 2011; 27(15):2156–8. doi:10.1093/Bioinformatics/Btr330PMID:21653522 30. Young AC, Kirkness EF, Breen M. Tackling the characterization of canine chromosomal breakpoints
with an integrated in-situ/in-silico approach: The canine PAR and PAB. Chromosome Res. 2008; 16 (8):1193–202. doi:10.1007/S10577-008-1268-9PMID:19005636
31. Pritchard JK, Stephens M, Rosenberg NA, Donnelly P. Association mapping in structured populations. Am J Hum Genet. 2000; 67(1):170–81. doi:10.1086/302959PMID:10827107
32. Purcell S, Neale B, Todd-Brown K, Thomas L, Ferreira MA, Bender D, et al. PLINK: a tool set for whole-genome association and population-based linkage analyses. Am J Hum Genet. 2007; 81(3):559–75. doi:10.1086/519795PMID:17701901
33. Falush D, Stephens M, Pritchard JK. Inference of population structure using multilocus genotype data: linked loci and correlated allele frequencies. Genetics. 2003; 164(4):1567–87. PMID:12930761 34. Waples RS, Do C. LDNE: a program for estimating effective population size from data on linkage
dis-equilibrium. Mol Ecol Resour. 2008; 8(4):753–6. doi:10.1111/J.1755-0998.2007.02061.XPMID: 21585883
35. Do C, Waples RS, Peel D, Macbeth GM, Tillett BJ, Ovenden JR. NeEstimator v2: re-implementation of software for the estimation of contemporary effective population size (Ne) from genetic data. Mol Ecol Resour. 2014; 14(1):209–14. doi:10.1111/1755-0998.12157PMID:23992227
36. Hedrick PW. Genetics of populations. 4th ed. Sudbury, Mass.: Jones and Bartlett Publishers; 2011. 37. Weir BS, Cockerham CC. Estimating F-Statistics for the Analysis of Population-Structure. Evolution.
1984; 38(6):1358–70. doi:10.2307/2408641
38. Wong AK, Ruhe AL, Dumont BL, Robertson KR, Guerrero G, Shull SM, et al. A comprehensive linkage map of the dog genome. Genetics. 2010; 184(2):595–605. doi:10.1534/genetics.109.106831PMID: 19966068
39. Rozen S, Skaletsky H. Primer3 on the WWW for general users and for biologist programmers. Methods Mol Biol. 2000; 132:365–86. PMID:10547847
40. Green P, Falls K, Crooks S. Documentation for CRIMAP, version 2.4. St. Louis, Missouri USA: Wash-ington University School of Medicine; 1990.
41. Seaton G, Hernandez J, Grunchec J, White I, Allen J, De Koning D, et al. GridQTL: a grid portal for QTL mapping of compute intensive datasets. Proceedings of the 8th world congress on genetics applied to livestock production: 13–18 August 2006. Belo Horizonte, Brazil2006.
42. Badke YM, Bates RO, Ernst CW, Schwab C, Steibel JP. Estimation of linkage disequilibrium in four US pig breeds. BMC Genomics. 2012; 13:24. doi:10.1186/1471-2164-13-24PMID:22252454
43. Bohmanova J, Sargolzaei M, Schenkel FS. Characteristics of linkage disequilibrium in North American Holsteins. BMC Genomics. 2010; 11:421. doi:10.1186/1471-2164-11-421PMID:20609259
44. Qanbari S, Pausch H, Jansen S, Somel M, Strom TM, Fries R, et al. Classic selective sweeps revealed by massive sequencing in cattle. PLoS Genet. 2014; 10(2):e1004148. doi:10.1371/journal.pgen. 1004148PMID:24586189
45. Sargolzaei M, Schenkel FS, Jansen GB, Schaeffer LR. Extent of linkage disequilibrium in Holstein cat-tle in North America. J Dairy Sci. 2008; 91(5):2106–17. doi:10.3168/Jds.2007-0553PMID:18420642 46. Valdar W, Solberg LC, Gauguier D, Burnett S, Klenerman P, Cookson WO, et al. Genome-wide genetic
association of complex traits in heterogeneous stock mice. Nat Genet. 2006; 38(8):879–87. doi:10. 1038/ng1840PMID:16832355
47. Chen CG, Li JG, Chen Y, Huang P, Wang YL, Liu-Chen LY.GEC1interacts with the kappa opioid re-ceptor and enhances expression of the rere-ceptor. J Biol Chem. 2006; 281(12):7983–93. doi:10.1074/ Jbc.M509805200PMID:16431922
48. Alfano C, Magrinelli E, Harb K, Studer M. The nuclear receptors COUP-TF: a long-lasting experience in forebrain assembly. Cell Mol Life Sci. 2014; 71(1):43–62. doi:10.1007/s00018-013-1320-6PMID: 23525662
49. Reinchisi G, Ijichi K, Glidden N, Jakovcevski I, Zecevic N. COUP-TFII expressing interneurons in human fetal forebrain. Cereb Cortex. 2012; 22(12):2820–30. doi:10.1093/cercor/bhr359PMID: 22178710
51. Chu K, Zingg HH. The nuclear orphan receptors COUP-TFII and Ear-2 act as silencers of the human oxytocin gene promoter. J Mol Endocrinol. 1997; 19(2):163–72. doi:10.1677/Jme.0.0190163PMID: 9343308
52. Albert FW, Hodges E, Jensen JD, Besnier F, Xuan Z, Rooks M, et al. Targeted resequencing of a geno-mic region influencing tameness and aggression reveals multiple signals of positive selection. Heredity. 2011; 107(3):205–14. doi:10.1038/Hdy.2011.4PMID:21304545
53. Poh YP, Domingues VS, Hoekstra HE, Jensen JD. On the prospect of identifying adaptive loci in re-cently bottlenecked populations. PLoS One. 2014; 9(11):e110579. doi:10.1371/journal.pone.0110579 PMID:25383711
54. Lamichhaney S, Berglund J, Almen MS, Maqbool K, Grabherr M, Martinez-Barrio A, et al. Evolution of Darwin's finches and their beaks revealed by genome sequencing. Nature. 2015; 518(7539):371–5. doi:10.1038/nature14181PMID:25686609
55. Liu S, Lorenzen ED, Fumagalli M, Li B, Harris K, Xiong Z, et al. Population genomics reveal recent spe-ciation and rapid evolutionary adaptation in polar bears. Cell. 2014; 157(4):785–94. doi:10.1016/j.cell. 2014.03.054PMID:24813606
56. Freedman AH, Gronau I, Schweizer RM, Ortega-Del Vecchyo D, Han E, Silva PM, et al. Genome se-quencing highlights the dynamic early history of dogs. PLoS Genet. 2014; 10(1):e1004016. doi:10. 1371/journal.pgen.1004016PMID:24453982
57. Johansson AM, Pettersson ME, Siegel PB, Carlborg O. Genome-wide effects of long-term divergent selection. PLoS Genet. 2010; 6(11):e1001188. doi:10.1371/journal.pgen.1001188PMID:21079680 58. Jones FC, Grabherr MG, Chan YF, Russell P, Mauceli E, Johnson J, et al. The genomic basis of
adap-tive evolution in threespine sticklebacks. Nature. 2012; 484(7392):55–61. doi:10.1038/nature10944 PMID:22481358
59. Moon S, Kim TH, Lee KT, Kwak W, Lee T, Lee SW, et al. A genome-wide scan for signatures of direc-tional selection in domesticated pigs. BMC Genomics. 2015; 16(1):130. doi: 10.1186/s12864-015-1330-xPMID:25928663
60. Rubin CJ, Zody MC, Eriksson J, Meadows JR, Sherwood E, Webster MT, et al. Whole-genome rese-quencing reveals loci under selection during chicken domestication. Nature. 2010; 464(7288):587–91. doi:10.1038/nature08832PMID:20220755
61. Rubin CJ, Megens HJ, Martinez Barrio A, Maqbool K, Sayyab S, Schwochow D. Strong signatures of selection in the domestic pig genome. Proc Natl Acad Sci U S A. 2012; 109(48):19529–36. doi:10. 1073/pnas.1217149109PMID:23151514