European Lampreys: New Insights on
Postglacial Colonization, Gene Flow and
Speciation
Catarina Sofia Mateus1,2*, Pedro Raposo Almeida1,3, Natacha Mesquita2, Bernardo Ruivo Quintella1,4, Maria Judite Alves2
1MARE–Centro de Ciências do Mar e do Ambiente, Universidade de Évora, Évora, Portugal,2Museu Nacional de História Natural e da Ciência & Centro de Ecologia, Evolução e Alterações Ambientais,
Universidade de Lisboa, Lisboa, Portugal,3Departamento de Biologia, Escola de Ciências e Tecnologia,
Universidade Évora, Évora, Portugal,4Departamento de Biologia Animal, Faculdade de Ciências da
Universidade de Lisboa, Lisboa, Portugal
Abstract
Ice ages are known to be the most dominant palaeoclimatic feature occurring on Earth, pro-ducing severe climatic oscillations and consequently shaping the distribution and the popu-lation structure of several species. Lampreys constitute excellent models to study the colonization of freshwater systems, as they commonly appear in pairs of closely related species of anadromousversusfreshwater resident adults, thus having the ability to colonize new habitats, through the anadromous species, and establish freshwater resident deri-vates. We used 10 microsatellite loci to investigate the spatial structure, patterns of gene flow and migration routes ofLampetrapopulations in Europe. We sampled 11 populations including the migratoryL.fluviatilisand four resident species,L.planeri,L.alavariensis,L. auremensisandL.lusitanica, the last three endemic to the Iberian Peninsula. In this south-ern glacial refugium almost all sampled populations represent a distinct genetic cluster, showing high levels of allopatric differentiation, reflecting long periods of isolation. As result of their more recent common ancestor, populations from northern Europe are less divergent among them, they are represented by fewer genetic clusters, and there is evidence of strong recent gene flow among populations. These previously glaciated areas from northern Europe may have been colonized from lampreys expanding out of the Iberian refugia. The pairL.fluviatilis/L.planeriis apparently at different stages of speciation in different locations, showing evidences of high reproductive isolation in the southern refugium, and low differen-tiation in the north.
Introduction
The Quaternary climatic oscillations and geographic restrictions imposed by the impassable glaciated areas are thought to have had major effects on the evolution and dispersal of various OPEN ACCESS
Citation:Mateus CS, Almeida PR, Mesquita N, Quintella BR, Alves MJ (2016) European Lampreys: New Insights on Postglacial Colonization, Gene Flow and Speciation. PLoS ONE 11(2): e0148107. doi:10.1371/journal.pone.0148107
Editor:Sergios-Orestis Kolokotronis, Fordham University, UNITED STATES
Received:February 5, 2015
Accepted:January 13, 2016
Published:February 12, 2016
Copyright:© 2016 Mateus et al. This is an open access article distributed under the terms of the
Creative Commons Attribution License, which permits unrestricted use, distribution, and reproduction in any medium, provided the original author and source are credited.
Data Availability Statement:All relevant data are within the paper and its Supporting Information files.
species (e.g. [1,2]). It is now clear that most fauna and flora presently distributed across Europe were isolated in southern refugia during the glacials, many in the Mediterranean peninsulas of Iberia, Italy and the Balkans [3]. After the glacials, and as the climate warmed rapidly, founder populations at the northern limits of the southern refugia expanded northwards, into the new available habitats, leading to a reduction from southern to northern Europe in the extent of the number of species, subspecific differentiation and allelic variation [3].
Recently deglaciated regions were relatively inaccessible to freshwater fishes, as they do not normally disperse among river basins; they were, however, easily reached by anadromous fishes (migratory species that reproduce in freshwater before migrating to the sea where they grow to the adult stage), which could access isolated basinsviasea. These fish breed in fresh water, hav-ing ample opportunities to colonize these unexploited systems and establish freshwater isolates [4]. In some genera of lampreys, closely related species show divergent life histories: parasitic and anadromous vs. non-parasitic and freshwater resident; these species are called“paired spe-cies”, and the freshwater resident (brook) species have apparently evolved from a form similar to that of an extant anadromous one [5,6]. In some cases, more than one freshwater resident species has derived from a single anadromous species; these are called“satellite species”[7]. For this reason, lampreys constitute excellent systems to study the postglacial colonization pro-cesses and emergence of freshwater derivates from the founder anadromous forms.
The anadromous European river lamprey (Lampetra fluviatilis) and the resident European brook lamprey (Lampetra planeri) are considered paired species. They only occur in European watersheds, extending from southern Norway to the western Mediterranean and the Iberian Peninsula in the south. The three brook lampreysLampetra alavariensis,Lampetra auremensis
andLampetra lusitanica, which are endemic to western Iberian Peninsula (Portugal) [8], are apparently derived from an extinct anadromous form, more ancestral than the solely extant anadromous form occurring in Iberia,L.fluviatilis[9]. In this region, whileL.planeriis found in several river basins,L.alavariensis,L.auremensisandL.lusitanicaare confined to one or two basins, and the anadromousL.fluviatiliscurrently occurs in the Tagus river basin only [8,10]. The current distribution of the extant Iberian lamprey lineages is largely allopatric and the genetic divergence between them is consistent with extended periods of isolation during survival in separate glacial refugia throughout the ice ages [9,11]. The three brook lampreysL.
alavariensis,L.auremensisandL.lusitanicaare well supported monophyletic groups, divergent from the present-dayL.fluviatilis. However,L.planerishare haplotypes with the parasitic form, implying that their emergence was more recent [9,11]. The taxonomy ofL.fluviatilisand
L.planerihas thus been considered problematic, as studies using different markers have revealed lack of differentiation between the species (e.g. [11–13]), leaving open two possible scenarios: 1) a very recent divergence event or 2) a single species with phenotypic plasticity. The recent study of Mateuset al. [14], using genome-wide sequencing in sympatric popula-tions of these species in the Iberian Peninsula, represented an important step forward in this long-standing question, as it successfully identified fixed allelic differences between the two forms in this region. These findings imply that these species are result of a recent divergence event (scenario 1), with populations in different phases of speciation across their ranges.
In this study, we investigate postglacial colonization of European fresh waters by analyzing patterns of genetic differentiation in a group with alternative life histories. We analyzed 10 polymorphic microsatellite loci, coupled with two mitochondrial genes, in the anadromousL.
fluviatilisand in four resident species,L.planeri,L.alavariensis,L.auremensisandL. lusita-nica. We tested the hypotheses that the Iberia is a source for the northward recolonization by the migratory species, the possible existence of a speciation gradient in Europe, and test for contemporary gene flow among and within species.
data collection and analysis, decision to publish, or preparation of the manuscript.
Materials and Methods
Ethics Statement
This study was carried out in strict accordance with the recommendations present in the Guide for the Care and Use of Laboratory Animals of the European Union—in Portugal represented by the Decree-Law n°129/92, Portaria n°1005/92. By the time the experimental work took place, the University’s ethics committee only dealt with research involving humans. Neverthe-less, since two authors have an official license for animal experimentation (Category C from FELASA), issued by the Veterinary National Authority (DGV), Portuguese Ministry of Agri-culture and Sea, the experiments involving living animals were performed in accordance to international rules regarding animal welfare. Collection of samples in Portugal was carried out without euthanizing the specimens, using the collecting permits provided by the Institute for Nature Conservation and Forestry, I.P. (ICNF, IP). In Belgium and Germany sampling autho-rizations are provided by Gouvernement Wallon—Travaux publics,Agriculture,Ruralité,
Nature,Forêt et Patrimoine, and the German Federal Agency for Nature Conservation, respec-tively. In Finland, the samples have been collected from commercial lamprey catches, so those animals were caught for human consumption, and no authorization was needed.
Sampling and DNA extraction
Lampreys were collected by electro fishing, and after being anaesthetized by immersion in 2-phenoxyethanol (0.3 ml L-1), a piece of tissue was removed from the dorsal fin. After recov-ery individuals were released near the capturing sites. Sampled species were the European river lampreyL.fluviatilis, the European brook lampreyL.planeri, and the three recently described Iberian brook lampreysL.alavariensis,L.auremensisandL.lusitanica[8]. Ten sites were sam-pled, with only one species being present in each site, with the exception of the Sorraia River in the Tagus Basin (Iberian Peninsula), whereL.fluviatilisandL.planeriare found in sympatry
(Table 1). In the tables and across the manuscript, acronyms are labelled so that patterns are
more readily understood: acronyms followed bymrefer to the migratory species (L.fluviatilis), and byrto resident species (the brook lampreysL.planeri,L.alavariensis,L.auremensisandL.
lusitanica). When treated together, populations from Belgium, Germany and Finland are
Table 1. Locations listed north to south, acronyms and sample sizes (n) ofLampetrasamples included in the study.
Country Basin River Acronym n Species
Finland Lestijoki Lestijoki LESTm 29 L.fluv
Germany Warnow Beke BEKEr 30 L.plan
Germany Elbe Schaale ELBEm 40 L.fluv
Belgium Meuse Warche WARCr 35 L.plan
Portugal Esmoriz Esmoriz ESMr 33 L.alavar
Portugal Lis Lis LISr 33 L.plan
Portugal Ribeiras do Oeste Ribeira de S. Pedro OESr 31 L.plan
Portugal Tagus Nabão NABr 35 L.aurem
Portugal Tagus Sorraia1 SPLr 52 L.plan
Portugal Tagus Sorraia1 SFL
m 46 L.fluv
Portugal Sado Marateca SADOr 51 L.lusit
Species:L.plan,L.planeri;L.fluv,L.fluviatilis; L.alavar,L.alavariensis; L.aurem,L.auremensis; L.lusit,L.lusitanica
Acronyms followed bymrefer to migratory species (L.fluviatilis), and byrto resident species (L.planeri,L.alavariensis,L.auremensisandL.lusitanica). 1Location where the pairedL.
fluviatilisandL.planerioccur in sympatry.
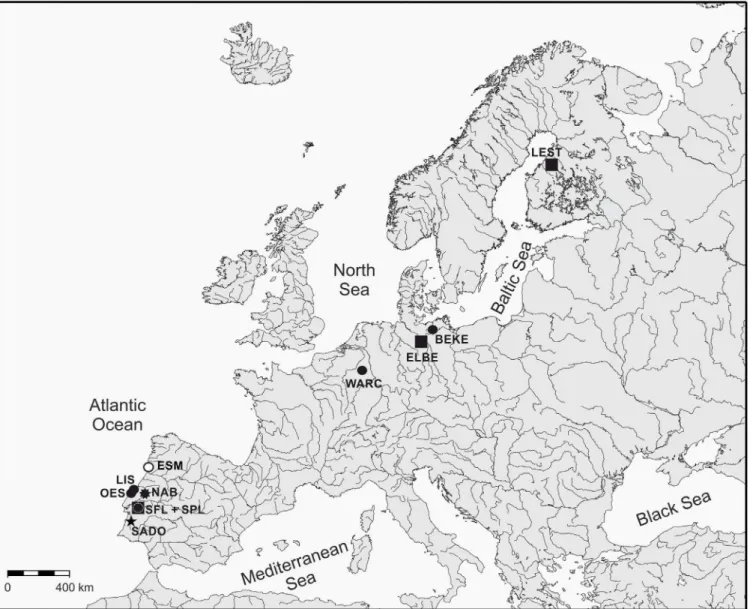
hereinafter referred as“northern populations”and populations from the Iberian Peninsula as “southern populations”. All rivers sampled in the Iberian Peninsula drain to the Atlantic Ocean, rivers Warche (Meuse basin) and Schaale (Elbe basin) drain to the North Sea, whereas rivers Beke (Warnow basin) and Lestijoki drain to the Baltic Sea (Fig 1).
Total genomic DNA was extracted following a standard phenol-chloroform protocol [15] and stored at -20°C. DNA concentration was measured using a Thermo Scientific NanoDrop™
1000 Spectrophotometer and standardized to 50 ngμl-1per sample.
Microsatellite analysis
A total of 415 specimens from 10 sites were used in the analysis, with sample sizes ranging from 29 to 52 (Table 1). Initially, 49 microsatellite primer sets developed for other lamprey species (Petromyzon marinus: [16,17];Lethenteronsp. N: [18];Ichthyomyzon unicuspisand Ichthyomy-zon fossor: [19];Lampetra richardsoni: [20] were screened using the described protocols and
Fig 1. Sampling sites ofLampetrapopulations in Europe.Species:&,L.fluviatilis;●,L.planeri;○,L.alavariensis;$,L.lusitanica;î,L.auremensis. SeeTable 1for details about species and sampling sites.
were further optimized to the target species. Ten primer sets produced unambiguously deter-mined bands and were polymorphic: Iun 2, Iun 5, Iun 7, Iun 10 and Iun 14 [19]; Lspn 010–2, Lspn 019c, Lspn 044 and Lspn 094 [18]; and Pmaμ5 [16]. These 10 loci were used to genotype 415 individuals; all others were rejected. The reverse primers were 5’-labelled with 6-FAM, NED, PET or VIC (Applied Biosystems1) fluorescent dyes. Primer sets were grouped into three multi-plex reactions (S1 Table), and polymerase chain reactions (PCR) were set up in 12μl volumes containing 2μL of 50 ngμl-1genomic DNA, 1.0 to 3.0 mM MgCl2, 0.2 mM dNTP mix, 0.5μM
for each primer, 1 unit of DreamTaq™DNA Polymerase (Fermentas) and 1× DreamTaq™Buffer. PCR conditions were as follows: initial denaturation at 94°C for 1 min, followed by 25 cycles of 30 sec at 94°C, annealing for 30 sec at temperatures ranging from 55 to 60°C and 30 sec at 72°C, and a final extension of 7 min at 72°C. A number of sets of difficult amplification were completed using a Multiplex PCR Kit (Qiagen1) with 5μl Qiagen Multiplex PCR master Mix, 3μl RNase-free water, 1μl Primer Mix (2μM each primer) and 1μl of 50 ngμl-1of genomic DNA, using the following protocol: initial activation step at 95°C for 15 min, followed by 30 cycles of denatur-ation at 94°C for 30 sec, annealing at 57°C for 90 sec and extension at 72°C for 60 sec, and a final extension of 30 min at 60°C. The PCR reactions were conducted on a Bio-Rad1thermal cycler.
Samples were genotyped in an ABI PRISM1310 Genetic Analyzer and fragments were sized with GeneScan™-500 LIZ™Size Standard. Allele sizes were determined using the software GeneMapper13.7 (Applied Biosystems1).
Microsatellite loci were first tested for null alleles, stuttering and large allele dropout using the software MICRO-CHECKER 2.2.3 [21]. Each microsatellite locus was tested for Hardy– Weinberg equilibrium and departures from linkage equilibrium were assessed for all pairs of loci in each population with 104permutations, as implemented in ARLEQUIN 3.11 [22]. Genetic diversity was measured as the mean allelic richness (AR), observed heterozygosity (Ho), unbiased expected heterozygosity (He,sensuNei 1978) and mean number of alleles across loci (MNA), inferred using GENETIX 4.05.2 [23], with the exception of allelic richness, which was calculated and corrected for sample dimension by rarefaction using HP-Rare [24].
The genetic differentiation among samples was accessed through pairwiseFSTusing the
Weir & Cockerham's estimator [25], and significance was assessed with 104permutations, as implemented in GENETIX. The distribution of genetic variation was accessed among and within the 11 samples, the sympatricL.fluviatilisandL.planeri, and the genetic clusters attained with population structure analysis, through analysis of molecular variance (AMOVA) [26]. These analyses were performed in ARLEQUIN, using the allelic frequencies as the genetic distance and 104permutations.
The Bayesian model-based clustering approach implemented in STRUCTURE 2.2 [27] was used to assemble individuals into groups (genetic clusters). Runs were performed under the admixture model, with correlated allelic frequencies, and with a number of groups (K) set between 1 and 12. For each K, 10 simulations were performed with a burn-in period of 105, fol-lowed by 5 million Markov steps. Using the same parameters, two additional structure analyses were performed, one including solely the eight samples ofL.planeriandL.fluviatilis(K between 1 and 9), and the other including the four samples from the North (K between 1 and 5). These allow detection of further structure in these populations, if present, that otherwise would be hidden due to the high differentiation among the five species, and between the north-ern and southnorth-ern samples. The optimal K, and clustering achieved, was inferred using the pro-tocol defined by Evannoet al. [28] as implemented in STRUCTURE HARVESTER 0.6.93 [29], and taking into account the biological meaning of the clusters. The software DISTRUCT 1.1 [30] was used for the graphical display of population clusters.
locality in which the individual’s genotype is most likely to occur. The Bayesian statistical approach of Rannala & Mountain [32] was implemented. GeneClass2 2.0.h was also used to determine whether our samples might contain individuals that were first generation (F0)
immi-grants from unsampled populations (the so-called‘ghost populations’, [33]). We used the Bayesian assignment procedure of Rannala & Mountain [32], and the Paetkauet al. method [34] to compute probabilities from 10,000 simulated genotypes.
Patterns of differentiation were visualized by principal coordinates analysis (PCoA), a multi-variate technique that allows to find and plot the major patterns within a multimulti-variate dataset, like multiple loci and multiple samples. This analysis was computed using GenAlEx 6.5 [35,36].
The software NewHybrids 1.1 [37] was used for the detection and classification of putative hybrids between sympatric populations ofL.fluviatilisandL.planerifrom Portugal. NewHy-brids uses a Bayesian approach to identify different categories of hybrid individuals through the computation of the posterior probability that individuals fall into different hybrid (F1, F2
and backcrosses) or pure parental categories. It uses the allele frequencies of multilocus genotypes and a Markov Chain Monte Carlo procedure. Simulations were performed with a burn-in period of 105, followed by a sampling period of 105Markov steps. A threshold of posterior probability>50% was set up to classify an individual as belonging to a certain category.
Estimates of recent migration rates (m) between migratory populations were inferred using a Bayesian assignment test-based method in the program BAYESASS 3.0.1 [38]. We also per-formed migration rate analysis between all populations, whose results are presented inS2
Table. BAYESASS estimates migration rates over the last two generations using a Markov
chain Monte Carlo procedure and does not assume that populations are in migration-drift or Hardy–Weinberg equilibrium. Because BAYESASS focuses on contemporary migration rates, estimates are unaffected by the colonization processes. A total of 107MCMC iterations (dis-carding the first 106iterations as burn-in) were performed, and samples were collected every 2000 iterations. The convergence and stability of the MCMC algorithm was checked by visual inspection of plotted posterior parameter estimates using the software Tracer 1.6 [39] (S1 Fig). Delta values for migration rate, allele frequencies, and inbreeding values coefficients were set at 0.20, 0.40 and 0.60, respectively.
Demographic signatures of recent bottlenecks were tested using the heterozygosity excess method implemented in BOTTLENECK 1.2.02 [40] under three different mutational models: infinite allele model (IAM), stepwise mutation model (SMM) and two-phase model (TPM). Significant deviations from mutational-drift equilibrium were tested using the Wilcoxon sign rank test with 105simulations, and the distribution of allele frequency classes was examined for a deviation from the normal L-shaped distribution [41]. Past reductions in population size were also evaluated using theMratio (M=k/r) statistic test as implemented in M_P_VAL [42], wherekis the number of alleles present at a given microsatellite locus andris the overall range in allele size. In recently reduced populationsMis expected to be smaller than in popula-tions at equilibrium, since the loss in any allele will contribute to a reduction ink, whereas only a loss of the smallest or largest alleles will contribute to a reduction inr, and thuskis expected to decrease more quickly thanr. Reductions in population size were considered significant if less than 5% of the replicates are below the observedMvalue. Following Garza & Williamson (2001) [42], we used the default settings for the two-phase mutation model (TPM)ps= 0.9,Δg
= 3.5 and three values ofθ(θ= 4,θ= 10 andθ= 20), whereθ= 4Neμ(Ne = effective population size;μ= mutation rate),psis the proportion of one-step mutations, andΔgis the average size of
non one-step mutations.
MtDNA sequence analysis
For a better understanding of the historical processes that may underlie present population structure, we performed a phylogenetic analysis of mtDNA sequences of the populations included in this study, and additional populations from across the species distributional range.
A total of 44 samples from northern Europe (LESTm, BEKEr, ELBEm, WARCr) were ampli-fied and sequenced for both cytochromeband ATPase 6/8 mitochondrial genes, following the protocol in Mateuset al. [9]. For the remaining populations included in the microsatellite anal-ysis, the corresponding haplotypes were obtained from the GenBank nucleotide data base [9,11], as well as additional haplotypes which represent other populations from across the distributional range ofL.planeriandL.fluviatilis. MtDNA sequencing of 44 individuals from LESTm, BEKEr, ELBEmand WARCrrevealed a total of 14 new haplotypes (H83 to H96), which combined with the 52 haplotypes from GenBank [9,11] resulted in a dataset of 66 haplotypes for phylogenetic analyses. New nucleotide sequences are available at the GenBank database under the accession numbers KT275288- KT275301.
DNA sequences were manually aligned and edited using Sequencher V4.8 (Gene Codes Corp., Ann Arbor, MI, USA). One sequence each of the speciesL.alavariensis,L.auremensis
andL.lusitanicawas included and used as outgroup (haplotypes H26, H48 and H53, respec-tively; [9,11]).
The phylogenetic relationships among mtDNA haplotypes were reconstructed using
PAUP
[43] by the neighbour-joining algorithm [44], according to the selected model and using the parameter settings as estimated with MODELTEST software [45]. Bootstrap support values in neighbour-joining analysis were computed with fast stepwise addition using 1000 pseudo-replicates. For maximum parsimony, bootstrap values were computed with full heuris-tic search using 500 replicates, each consisting of 100 TBR searches of random addition sequence.
Results
Genetic diversity and differentiation
For microsatellites, signs of null alleles were detected with MICRO-CHECKER for a few situa-tions across loci and populasitua-tions: Pmaμ5 in SPLrand NABr; Iun 10 in SPLrand BEKEr; Iun 5 in ELBEmand BEKEr; and Iun 14 in SPLrand BEKEr. Significant null alleles’signature is related with heterozygote deficit and therefore with deviations from Hardy–Weinberg equilib-rium, as seen inS2 Table.
The summary statistics of the genetic diversity indices for each locus and sample are pro-vided inS2 Table. The total number of alleles per locus across populations varied from two, at the loci Iun7 and Lspn010-2, to 13 at the locus Iun14. Twelve private alleles were found: NABr, SPLrand SADOrshowed three unique alleles each, BEKE two, and SFL one (S2 Table). The mean number of alleles (MNA) across loci ranged from 1.1 (LISrand OESr) to 3.8 (ELBEm), mean allelic richness (AR) from 1.08 (LISr) to 2.62 (ELBEm), and expected heterozygosity (He) from 0.0239 (LISr) to 0.4417 (NABr) (S2 Table).
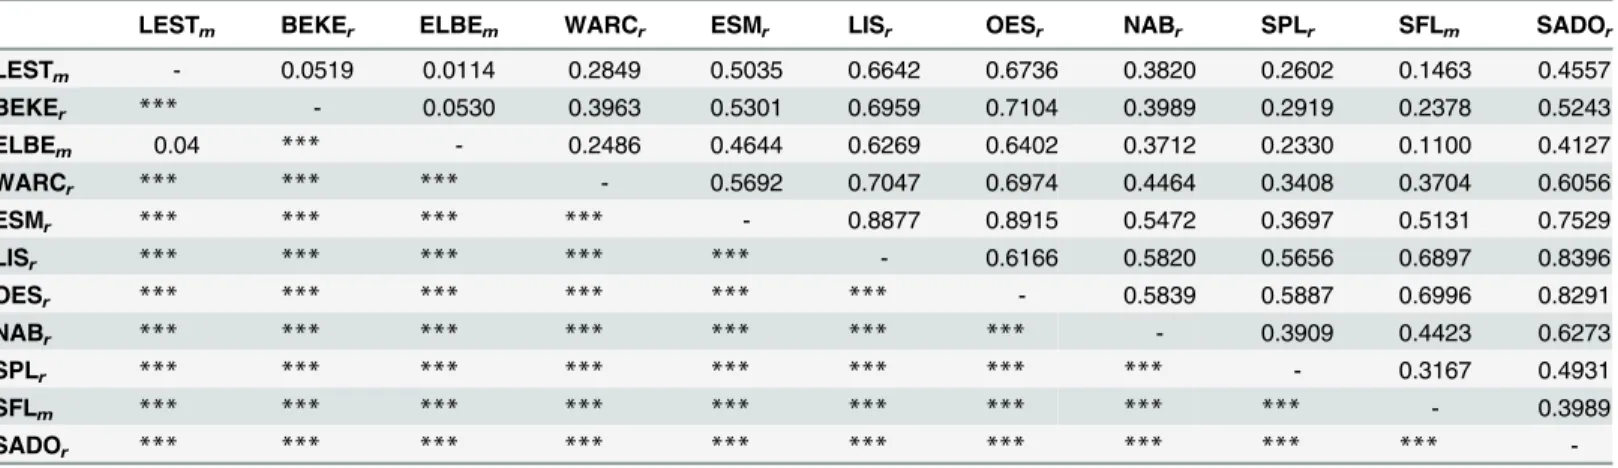
A considerable level of genetic differentiation among samples was observed (averageFST=
0.498,P<0.001) with pairwiseFSTvalues ranging from 0.0114 (ELBEm-LESTm) to 0.8915 (OESr-ESMr), all being significant (P<0.001 for all pairs, with the exception of ELBEm-LESTm whereP<0.05) (Table 2).
explained among species; and AMOVA among the eight genetic groups attained with STRUC-TURE (see below andFig 2A) indicated that the majority of variance occurs among groups (46.79%) and within samples (48.89%), whereas variance among samples within groups is low (4.32%) (P<0.001 for all the three levels).
Population structure and admixture
The STRUCTURE analysis using the microsatellite data revealed that the 11 samples are grouped in eight distinct genetic clusters: 1) LESTm+BEKEr+ELBEm, 2) WARCr, 3) ESMr, 4) LISr+OESr, 5) NABr, 6) SPLr, 7) SFLmand 8) SADOr(Fig 2AandTable 3). The first group exhibits strong evidence of admixture with the residentL.planerifrom Meuse (WARCr, group 2) andL.fluviatilisfrom Tagus (SFLm, group 7), with a greater number of admixed individuals in the anadromous populations (LESTmand ELBEm) (Fig 2). Most individuals of group 2 (WARCr) are distinct and constitute a distinct genetic cluster with high proportion of member-ship (0.949;Table 3). This is also the case in other groups comprised of resident species, namely, ESMr, LISr+OESr, NABrand SADOr(groups 3, 4, 5, and 8, respectively;Fig 2Aand
Table 3). The sympatric pairedL.planeriandL.fluviatilisfrom Tagus (SPLrand SFLm)
consti-tute two distinct genetic clusters (6 and 7, respectively) that present a few admixed individuals between them. SPLralso shows some evidence of admixture with ESMr(Fig 2AandTable 3). When STRUCTURE was run only for the eight samples ofL.planeriandL.fluviatilis(Fig 2B, K = 5), and for the four northern samples (Fig 2C, K = 2), no additional genetic clusters were achieved, indicating that there is no hidden structure caused by the high differentiation of the Iberian endemics, and that the genetic cluster that groups the northern populations (LESTm+-BEKEr+ELBEm) is well supported.
Individual assignment tests were applied to further investigate the genetic distinctiveness of the populations. In four populations of resident species (WARCr, ESMr, NABrand SADOr) 100% of the individuals were assigned to their correct source population (Table 4), which is in agreement with the STRUCTURE analysis. Samples from northern Europe were the ones with more individuals assigned to other populations;L.fluviatilisfrom Lestijoki and Elbe (LESTm and ELBEm, respectively) and the residentL.planerifrom Warnow (BEKEr) had individuals assigned among the three populations, in agreement with STRUCTURE, in which the three populations form a distinct genetic cluster (see above). The sympatricL.fluviatilisandL.
Table 2. Pairwise estimates of genetic differentiation (FST) among sites (above diagonal) and correspondingPvalues (below diagonal).For
popula-tions’acronyms, please checkTable 1.
LESTm BEKEr ELBEm WARCr ESMr LISr OESr NABr SPLr SFLm SADOr
LESTm - 0.0519 0.0114 0.2849 0.5035 0.6642 0.6736 0.3820 0.2602 0.1463 0.4557
BEKEr *** - 0.0530 0.3963 0.5301 0.6959 0.7104 0.3989 0.2919 0.2378 0.5243
ELBEm 0.04 *** - 0.2486 0.4644 0.6269 0.6402 0.3712 0.2330 0.1100 0.4127
WARCr *** *** *** - 0.5692 0.7047 0.6974 0.4464 0.3408 0.3704 0.6056
ESMr *** *** *** *** - 0.8877 0.8915 0.5472 0.3697 0.5131 0.7529
LISr *** *** *** *** *** - 0.6166 0.5820 0.5656 0.6897 0.8396
OESr *** *** *** *** *** *** - 0.5839 0.5887 0.6996 0.8291
NABr *** *** *** *** *** *** *** - 0.3909 0.4423 0.6273
SPLr *** *** *** *** *** *** *** *** - 0.3167 0.4931
SFLm *** *** *** *** *** *** *** *** *** - 0.3989
SADOr *** *** *** *** *** *** *** *** *** ***
-***P<0.001.
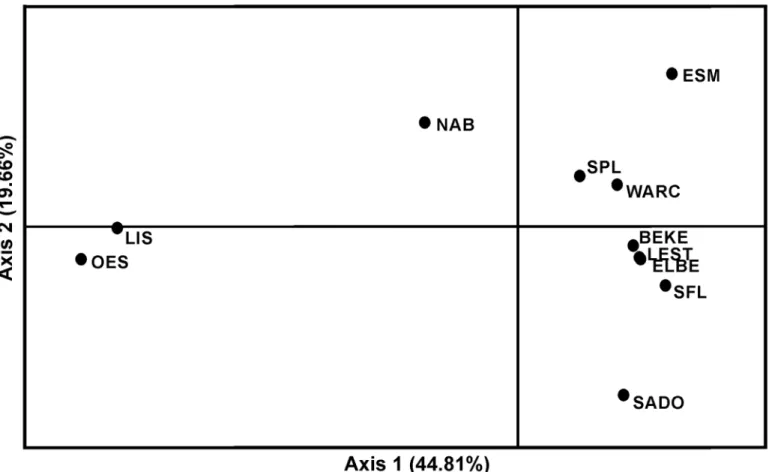
planeri(SFLmand SPLr) had almost all individuals assigned correctly (96% and 98%), and small percentages (4% and 2%) assigned between them. LISrand OESrshowed 73% and 97%, respectively, of correctly assigned individuals, and the remaining were assigned also among each other (Table 4). This last result is consistent with the STRUCTURE and PCoA analyses, which revealed a close genetic relation between these two populations (Figs2and3). Using a criticalPof 0.01 for first-generation (F0) immigrant analysis, a total of seven individuals had a
probability below the threshold value, but all were assigned to a sampled location: one individ-ual of LESTmwas assigned to BEKEr; one of BEKErwas assigned to ELBEm; one individual of
Fig 2. Most likely population structure, computed under the admixture model with correlated allelic frequencies in STRUCTURE, considering: A) all the 11 samples, K = 8; B) the populations ofL.planeriandL.fluviatilis, K = 5; and C) the four northern populations, K = 2.Each individual is represented by a vertical bar. Sampled locations below plot and correspondingLampetraspecies above are in accordance withFig 1andTable 1.
ELBEmwas assigned to BEKErand another to WARCr; one individual of WARCrwas assigned to ELBEm; one individual of SPLrwas assigned to SFLm; and one individual of SFLmwas assigned to LESTm.
The principal coordinates analysis (PCoA), revealed the existence of mainly six distinct clus-ters, NABr, SADOr, ESMr, LISr+OESr, SPLr+WARCr, BEKEr+LESTm+ELBEm+SFLm(Fig 3). These results are congruent with STRUCTURE, with the exception that it groups SPLrwith WARCr, and SFLmwith the northern cluster, while in STRUCTURE SPLr, WARCr, SFLmand the northern populations BEKEr, LESTmand ELBEmconstitute four distinct groups.
Table 3. STRUCTURE analysis for the 11 samples. Proportion of membership of each pre-defined population in each of the eight genetic clusters. For populations’acronyms, please checkTable 1.
Population Inferred clusters
1 2 3 4 5 6 7 8
LESTm 0.734 0.028 0.015 0.013 0.007 0.010 0.189 0.005
BEKEr 0.917 0.008 0.017 0.006 0.008 0.006 0.032 0.007
ELBEm 0.552 0.135 0.016 0.012 0.014 0.017 0.242 0.011
WARCr 0.009 0.949 0.009 0.003 0.006 0.005 0.014 0.004
ESMr 0.003 0.003 0.977 0.003 0.003 0.004 0.005 0.003
LISr 0.003 0.002 0.003 0.981 0.003 0.003 0.003 0.002
OESr 0.002 0.002 0.002 0.983 0.003 0.002 0.002 0.003
NABr 0.008 0.018 0.009 0.007 0.943 0.006 0.005 0.003
SPLr 0.016 0.012 0.052 0.006 0.009 0.860 0.038 0.006
SFLm 0.035 0.009 0.016 0.007 0.004 0.016 0.902 0.012
SADOr 0.007 0.004 0.005 0.006 0.004 0.005 0.013 0.957
Clusters: 1, LESTm+BEKEr+ELBEm; 2, WARCr; 3, ESMr; 4, LISr+OESr; 5, NABr; 6, SPLr; 7, SFLm; 8, SADOr Values in bold represent the proportion of membership in the dominant genetic cluster.
doi:10.1371/journal.pone.0148107.t003
Table 4. Assignment tests performed with GeneClass2.Values represent the percentage of individuals from each studied sample assigned to each of the sampled populations based on the Bayesian method. For populations’acronyms, please checkTable 1.
Assigned population
LESTm BEKEr ELBEm WARCr ESMr LISr OESr NABr SPLr SFLm SADOr
LESTm 80 3 17 0 0 0 0 0 0 0 0
BEKEr 3 94 3 0 0 0 0 0 0 0 0
ELBEm 10 15 68 5 0 0 0 0 0 2 0
WARCr 0 0 0 100 0 0 0 0 0 0 0
ESMr 0 0 0 0 100 0 0 0 0 0 0
LISr 0 0 0 0 0 73 27 0 0 0 0
OESr 0 0 0 0 0 3 97 0 0 0 0
NABr 0 0 0 0 0 0 0 100 0 0 0
SPLr 0 0 0 0 0 0 0 0 98 2 0
SFLm 0 0 0 0 0 0 0 0 4 96 0
SADOr 0 0 0 0 0 0 0 0 0 0 100
Each row contains the samples from one sampled locality and the columns indicate the localities to which the samples were assigned (i.e., in which their genotypes had the highest likelihood of occurring).
Values along the diagonal (in bold) represent the proportion of individuals assigned to the population in which they were sampled.
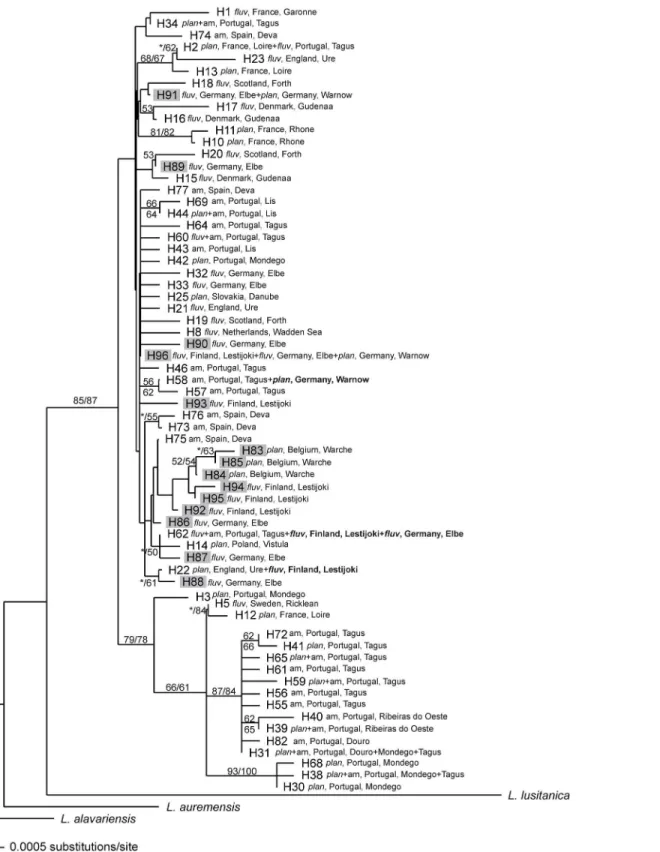
The neighbour-joining phylogenetic tree attained from mtDNA sequences is characterized by low structuring, with many basal polytomies (Fig 4). Only three well supported lineages (>80 bootstrap support) were found: two including exclusively haplotypes from the Iberian refugium and a third containing haplotypes from southern France (H10 and H11). The remaining haplotypes representing samples from the Iberian Peninsula and Europe do not show clear genetic structure.
Putative hybrids between sympatric
L
.
fluviatilis
and
L
.
planeri
The existence of putative hybrids betweenL.planeriandL.fluviatiliswas investigated using sympatric populations, in this caseL.planeriandL.fluviatilisfrom the Tagus basin, Portugal (SPLrand SFLm, respectively), using NewHybrids. In this analysis, each individual was assigned a posterior probability (p) of belonging to one of the six different genotype classes resulting from two generations. From the 52 samples ofL.planeri, 49 (94%) were classified as being pure
L.planeriusing the posterior probability threshold of 0.5, 20 of which showingp>0.99 and 25 showing 0.8<p<0.99 (Fig 5). For this species only one individual was classified as hybrid (F2; second generation hybrid) with posterior probability of 0.664, and one individual was classified as being pureL.fluviatilis(posterior probability = 0.537) (Table 5). All the 46 individuals ofL.
fluviatiliswere identified as such (pureL.fluviatilis), from which 40 exhibitp>0.99, and 5 showing 0.8<p<0.99. No F1or backcross hybrids were found in any of the species (Table 5).
Fig 3. Principal coordinates analysis plot (PCoA) computed by GenAlEx.The percentage of variation explained by each axis is shown. Samples’
acronyms as inFig 1andTable 1.
Fig 4. Neighbour-joining phylogenetic tree of 66 mitochondrial haplotypes ofLampetra(14 from this study (H83 to H96; grey shading) and the remaining 52 from GenBank database).For each haplotype, the species, country and river basin are indicated. Numbers are the bootstrap support values equal to or higher than 50% obtained from maximum parsimony (left or above) and neighbour-joining (right or below). The branches not recovered by one of these analyses are indicated with an asterisk.fluv,L.fluviatilis;plan,L.planeri; am, ammocoete.
Migration rate among populations
Recent migration rates (m) among migratory populations were estimated using BAYESASS. This analysis was performed for the three anadromous populations included in the study, i.e.,
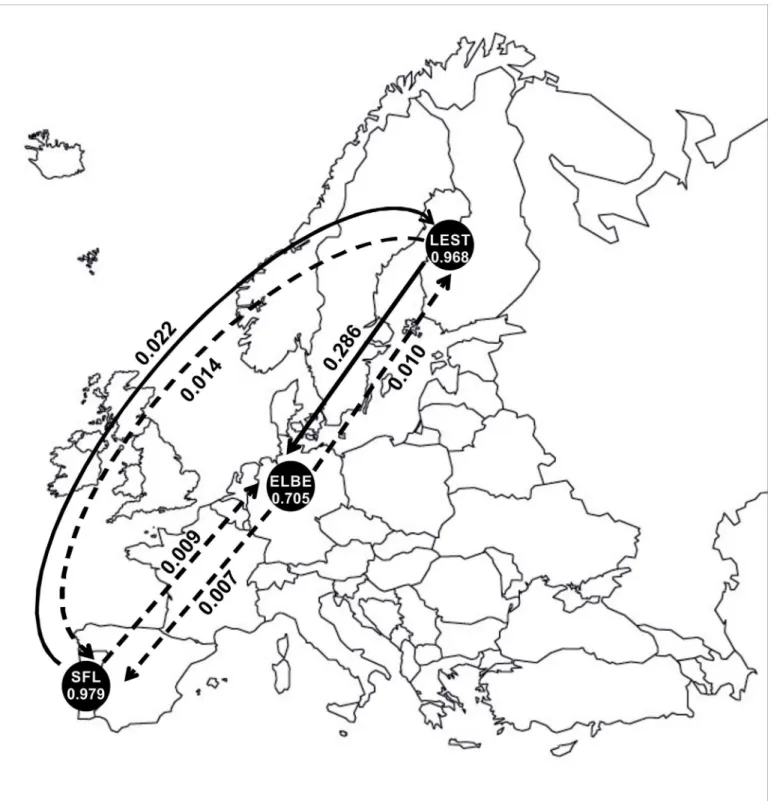
L.fluviatilisfrom Tagus (SFLm), from Elbe (ELBEm) and from Lestijoki (LESTm). The propor-tion of individuals derived from their own locapropor-tion was high in SFLm(m= 0.979) and in LESTm(m= 0.968), and relatively low in ELBEm(m= 0.705) (Fig 6). Accordingly, a relatively high proportion of immigrants (m= 0.286) was detected from LESTminto ELBEm. SFLmis the most isolated population, with the highest proportion of non-immigrants (m= 0.979) and low migration rates (m0.02) in both directions (Fig 6,Table 6).
Fig 5. Estimated posterior probabilities that each individual from the sympatric populations ofL.planeri(SPL;n= 52) andL.fluviatilis(SFL;n= 46) belongs to each of the six different genotype frequency categories that arise from two generations of potential interbreeding (parental species, F1,
F2and backcrosses), computed by NewHybrids.Each individual is represented by a vertical bar. For the individuals identified as belonging to a certain
hybrid category, posterior probability values are detailed inTable 5.
doi:10.1371/journal.pone.0148107.g005
Table 5. Hybridization analysis for the sympatricL.fluviatilis(SFLm) andL.planeri(SPLr) from Tagus basin. Estimated posterior probabilities of
belonging to one of the six genotype frequency classes (pure parental, F1, F2or backcrosses) for the individuals showing some evidence of hybridization. An individual is identified as belonging to a certain class if the posterior probability of falling into that class is above 0.5. Specimens are numbered as inFig 5.
Species Specimen Pure SPLr Pure SFLm F1 F2 SPLrBx SFLmBx
L.planeri(SPLr)n= 52 1 0.452 - - 0.342 0.200
-8 0.577 0.106 - 0.233 0.075
-22 0.733 - - 0.171 0.096
-29 0.587 - - 0.301 0.113
-40 0.625 - - 0.274 0.099
-47* 0.198 0.013 - 0.664 0.120
-52 0.023 0.537 - 0.394 0.023 0.022
L.fluviatilis(SFLm)n= 46 80 - 0.649 - 0.319 0.009 0.018
Genotype classes: Pure SPLr, pureL.planeri; Pure SFLm, pureL.fluviatilis; F1,first generation hybrid; F2, second generation hybrid; SPLrBx,L.planeri
backcross (pureL.planerimating with F1); and SFLmBx,L.fluviatilisbackcross (pureL.fluviatilismating with F1). Bold indicates the class the individuals were classified into.
*Individual identified as hybrid.
Fig 6. Recent migration rates (m) between migratory populations estimated using BAYESASS.Within circles, acronyms represent samples as inFig 1 andTable 1, and numbers denote the proportion of non-immigrants within populations. Arrows indicate direction of gene flow among populations and respectivemvalue. Dashed arrows represent values ofmlower than 0.02.
Demographic history
Bottleneck analysis revealed consistent signs for recent contraction of population size only in the population from Meuse (WARCr), which showed significant (P<0.05) heterozygote excess according to the three mutational models tested, and a shift in the distribution of allele fre-quency classes from the expected L-shaped distribution (Table 7). The population from Nabão (NABr) also presents significant (P<0.01) heterozygote excess according to IAM, but no devia-tion from the expected L-shaped distribudevia-tion (Table 7). Using theMratio statistic test, we found strong evidence of past reduction in population size for the migratoryL.fluviatilisfrom Tagus (SFLm), as theMratio was significantly smaller than the equilibrium expectation (P<0.05) for all the prebottleneckθvalues considered. None of the remaining populations pre-sented signs of reduction in population size (Table 7).
Discussion
Genetic diversity, population structure and postglacial dispersal
The colonization processes that took place after the glacial periods, when populations from the southern Mediterranean peninsulas expanded north across Europe, shaped, together with recent processes, the biodiversity of current taxa. Southern populations isolated in refugia and sub-refugia accumulated variation through the ice ages, and the founders that rapidly moved northward during interglacials only represented a subsample of the southern diversity [46]. This pattern is clearly observed for the genusLampetrain this study. This genus presents a
Table 6. Bayesian estimates of recent migration rates (m) among all populations using the program BAYESASS.Values shown are the mean migra-tion rate into each populamigra-tion and their respective standard deviamigra-tion of the marginal posterior distribumigra-tion in parentheses. Values along the diagonal (in bold) represent the proportion of non-immigrants within populations. Values ofmhigher than 0.02 are presented in italics.
Migration into
LESTm BEKEr ELBEm WARCr ESMr LISr OESr NABr SPLr SFLm SADOr
Migration from
LESTm 0.9019 (0.0274)
0.2554
(0.0216)
0.2428
(0.0205) 0.0074 (0.0071) 0.0079 (0.0075) 0.0071 (0.0070) 0.0073 (0.0071) 0.0071 (0.0068) 0.0067 (0.0063) 0.0141 (0.0112) 0.0053 (0.0053) BEKEr 0.0083
(0.0082) 0.6753 (0.0084) 0.0064 (0.0063) 0.0072 (0.0070) 0.0076 (0.0075) 0.0073 (0.0071) 0.0073 (0.0071) 0.0072 (0.0070) 0.0057 (0.0056) 0.0059 (0.0058) 0.0054 (0.0054) ELBEm 0.0085
(0.0082) 0.0076(0.0074)
0.6995 (0.0136)
0.0071
(0.0070) 0.0075(0.0074) 0.0072(0.0070) 0.0076(0.0073) 0.0073(0.0070) 0.0061(0.0059) 0.0060(0.0058) 0.0053(0.0052) WARCr 0.0082
(0.0079) 0.0077(0.0075) 0.0063(0.0062)
0.9261 (0.0210)
0.0074
(0.0071) 0.0073(0.0069) 0.0076(0.0077) 0.0115(0.0094) 0.0057(0.0057) 0.0060(0.0058) 0.0054(0.0053) ESMr 0.0085
(0.0083) 0.0077(0.0075) 0.0061(0.0060) 0.0076(0.0075)
0.9244 (0.0209)
0.0071
(0.0069) 0.0075(0.0074) 0.0076(0.0074) 0.0187(0.0131) 0.0058(0.0058) 0.0054(0.0052) LISr 0.0084
(0.0082) 0.0077(0.0073) 0.0062(0.0059) 0.0071(0.0070) 0.0074(0.0072)
0.6745 (0.0076)
0.2579
(0.0210) 0.0071(0.0071) 0.0053(0.0052) 0.0058(0.0057) 0.0054(0.0053) OESr 0.0083
(0.0082) 0.0077(0.0075) 0.0065(0.0063) 0.0070(0.0070) 0.0075(0.0077)
0.2609
(0.0196)
0.6747 (0.0078)
0.0074
(0.0075) 0.0052(0.0052) 0.0059(0.0059) 0.0056(0.0055) NABr 0.0085
(0.0082) 0.0078(0.0077) 0.0061(0.0061) 0.0073(0.0070) 0.0075(0.0073) 0.0072(0.0068) 0.0076(0.0075)
0.9228 (0.0208)
0.0055
(0.0055) 0.0059(0.0058) 0.0053(0.0053) SPLr 0.0081
(0.0081) 0.0078(0.0075) 0.0063(0.0059) 0.0076(0.0076) 0.0076(0.0073) 0.0073(0.0070) 0.0073(0.0071) 0.0073(0.0072)
0.9272 (0.0195)
0.0059
(0.0057) 0.0053(0.0053) SFLm 0.0229
(0.0189) 0.0076(0.0075) 0.0076(0.0072) 0.0083(0.0082) (0.0073)0.0075 0.0071(0.0069) 0.0076(0.0074) 0.0074(0.0072) 0.0083(0.0074)
higher number of species and higher genetic diversity in the Iberian Peninsula compared with those of central and northern Europe, with the majority of private alleles being found in south-ern samples. This pattsouth-ern of reduced richness in northsouth-ern regions has already been observed by Brackenet al. [47] for the same species inhabiting the British Isles, and by Boguskiet al. [48] for North AmericanLampetra, where haplotypic richness is greatest in regions south of the Columbia River. Similarly, Goodmanet al. [49] and Spiceet al. [50] found that in the anadro-mous Pacific lamprey (Entosphenus tridentatus), haplotypic richness increases from north to south.
This study is another evidence of the Iberian Peninsula as a glacial refugium, as proposed by Taberletet al. [1], and posteriorly supported by several case-studies, namely in fish. For instance, a number of studies on endemic Iberian cyprinid species support this scenario, like forBarbus sclateri[51],Squalius aradensis[52] andPseudochondrostoma polylepis[53]. Like-wise, the study of Consuegraet al. [54] with Atlantic salmon demonstrates the presence of this species in the Iberian glacial refugium during the last 40 000 years and also points to the Iberian Peninsula as the likely source of the most common haplotype within the Atlantic lineage in Europe.
STRUCTURE analysis for the 11 analyzed samples revealed the existence of eight genetic clusters: whereas the southern populations were grouped in several genetic clusters reflecting their high levels of differentiation, northern populations were grouped in the same genetic clus-ter as result of their more recent common ancestor. The exception was the residentL.planeri
from Warche in Belgium, which constitutes a distinct genetic cluster with high proportion of membership. This population seems to be facing a genetic bottleneck (seeTable 6), which explains the relatively low number of alleles found in each microsatellite locus (maximum of three, seeS2 Table). This may reflect the isolation of this population, which is located very upstream in the river basin, with several important obstacles downstream (M. Ovidio pers. comm.). Glaciations have been considered an important factor in brook lamprey evolution, both in Europe and North America [48,55,56]. These long periods favoured the abandonment of anadromous habits due to blocking of migratory routes. A cryptic Belgian refugium is another hypothesis for this differentiation, as several cryptic northern refugia have been hypothesized, one of which in the Belgian Ardennes. These northern refugia would have been in areas of sheltered topography that provided suitable stable microclimates [57]. We tested,
Table 7. Demographic analysis.Pvalues for one-tailed heterozygote excess (bold indicates significantPvalues), deviation of allele frequency classes from a normal L-shaped distribution andMratio tests. For populations’acronyms, please checkTable 1.
IAM TPM SMM L-shape Mratio value
LESTm 0.326 0.820 0.993 no deviation 0.72
BEKEr 0.578 0.963 0.994 no deviation 0.75
ELBEm 0.248 0.590 0.936 no deviation 0.71
WARCr 0.014 0.020 0.037 deviation 0.79
ESMr 0.156 0.563 0.906 no deviation 0.83
NABr 0.007 0.064 0.082 no deviation 0.75
SPLr 0.097 0.216 0.784 no deviation 0.78
SFLm 0.326 0.674 0.976 no deviation 0.661
SADOr 0.422 0.422 0.578 no deviation 0.82
IAM, infinite allele model; TPM, two-phase model; SMM, stepwise mutation model.
The populations LISrand OESrwere not included in the analysis as they only have one polymorphic locus (Lspn 094) (S2 Table). 1Location withMratio value signi
ficantly smaller than the equilibrium expectation (P<0.05) for all the prebottleneckθvalues considered (4, 10 and 20).
using mtDNA, whether the population from Warche represent an independently evolved pop-ulation that survived during glaciations in the Belgian Ardennes refugium (seeFig 4). The results attained were not conclusive because although the three private haplotypes from Warche (H83 to H85) group in a clade, this branch shows low support.
Demographic analyses revealed consistent signs for recent contraction of population size in the population from Meuse (WARCr). Nabão (NABr) population presented significant hetero-zygote excess according to the infinite allele model (IAM). These results, however, were not corroborated by mtDNA data, where Fu’sFs[58] and Tajima’sD[59] statistics revealed non-significant values (WARCrcalculated in the present study, and NABrfrom Mateuset al. [9]), unlike what would be expected from a recent population bottleneck. This might be explained by the different signals attained from both markers, i.e., the more ancestral signal retrieved from mtDNAversusthe recent history retrieved from microsatellite loci. This would mean that populations historically not showing evidence for contraction in population size (as attained from mtDNA data), may have faced a recent genetic bottleneck, as revealed by microsatellite data. Grouping of Iberian populations by STRUCTURE reflects in general their specific status, with the exception of LISrand OESrthat were grouped together, but not grouped with the other population ofL.planerifrom Portugal (SPLr). Those two populations present very low levels of genetic diversity, having one single polymorphic locus and no private alleles. In gen-eral, the alleles present in those populations are rather common, most of the times having a fre-quency of more than 50% in other populations, namely SPLr. The differentiation of those populations from SPLrseems, therefore, to reflect this lack of diversity, which statistically makes them unique. Those populations may be facing a genetic bottleneck, but this analysis could not be performed due to the existence of a single polymorphic locus.
This study revealed that anadromous populations from central and northern Europe have high proportions of membership from the population ofL.fluviatilisfrom the Iberian Penin-sula (the SFLmgenetic cluster). Because contemporary gene flow from south to north and vice-versa is apparently happening in very small proportions (seeFig 6), this signal is likely due to ancestral polymorphism, as a result of the colonization process from a southernL.fluviatilis -type, rather than ongoing gene flow. The hypothesis of ancestral polymorphism is also sup-ported by the mtDNA analysis, as northern samples ofL.fluviatilis(LESTmand ELBEm) share haplotype 62 withL.fluviatilisfrom the Tagus watershed (Iberian Peninsula) (seeFig 4), and is in tune with the scenario of recent dispersal and founding of the northern populations ([9,11]; discussed above). For a better understanding of the contemporary patterns of gene flow in more recently established northern populations, recent migration routes among and within a wider range of northernL.fluviatilisandL.planeripopulations should be further investigated.
Gene flow among species and populations
The repeated emergence of resident forms from ancestral migratory ones in different locations and times is a phenomenon very well known in lampreys [5–7,60], and should promote vary-ing degrees of reproductive isolation between founder and derived species.
Previous data on mtDNA suggested that the three Iberian brook lampreysL.alavariensis,L.
results are in agreement with the previous work using restriction site-associated DNA (RAD) sequencing [14] that suggests that these populations are two distinct taxa that diverged
recently. Results attained for northern populations ofL.fluviatilisandL.planeri, however, indi-cate that these species are grouped in a single cluster (STRUCTURE analysis) and may be experiencing, or have experienced until recently, gene flow. This scenario is most likely explained by the postglacial colonization of northern habitats by a southernL.fluviatilis-type and, consequently, later emergence of northern populations, as explained below. Differentia-tion between resident and anadromous populaDifferentia-tions may, therefore, be an ongoing process in many locations, where speciation is still underway. This scenario was also found for the same species in France, where variable levels of divergence were found among sympatric population pairs [61]. This may also be the case in other lamprey paired species; for instance, no significant genetic differences were found between sympatric populations of the paired silver ( Ichthyomy-zon unicuspis) and northern brook (Ichthyomyzon fossor) lampreys from the Great Lakes, sug-gesting the existence of ongoing gene flow between them at least in this region [62].
BAYESASS revealed high recent gene flow between the migratory northern populations ELBEmand LESTm, which is corroborated by the assignment tests (seeTable 4). In contrast, the migratoryL.fluviatilisfrom the Iberian Peninsula has a signature similar to a resident species, showing almost absence of ongoing gene flow with northern populations and high degree of iso-lation and differentiation. This is consistent with the findings of [63], who suggested that lam-preys with smaller body size may show limited dispersal and greater genetic differentiation. The genetic isolation ofL.fluviatilisfrom the Iberian Peninsula, together with the relatively small size of individuals may reveal reduced levels of mobility during the parasitic adult phase, proba-bly associated with their permanence in the large Tagus estuary (ca. 300 km2) and adjacent coastal area.Lampetra fluviatilismigrants have been separated on the basis of size into“typical” and“praecox”forms, whose mean lengths are approximately 30 and 24 cm, and mean weights about 53 and 22 g, respectively [64]. The size difference between the typical and praecox forms is thought to be due to differences in the time spent feeding in the sea, the last reducing their marine feeding phase by at least 1 year [64]. The population from the Tagus river basin resem-bles these smaller praecox forms; specimens analysed by the authors had in average 26 cm total length and 33 g weight, and one of the individuals was as small as 20 cm of total length and 19 g weight. These low values contrast, for instance, with those registered by Kempet al. [65] for this species in north-east England, 80.7 g and 36.3 cm. The southern population from Tagus river basin shows strong evidence of past reduction in population size (this study), and the low num-ber of individuals caught in the last years is representative of the rareness of this population [10], which is apparently isolated from the remaining European populations.
Conclusions
The use of microsatellites, coupled with information of mtDNA data, has proved effective in unravelling the patterns of colonization in EuropeanLampetra, placing the Iberian Peninsula as a major source of postglacial colonization for this genus. We suggest the existence of a speci-ation continuum betweenL.fluviatilisandL.planeri, i.e., different populations of this pair likely represent differentiation at different stages, as result of the different timing of coloniza-tion and refugial persistence. This hypothesis should be further investigated with the addicoloniza-tion of more samples, namely of sympatric populations.
Gene flow between migratory populations is high in northern regions, but low between northern populations and the southern Iberian population. We hypothesise that the migratory
Supporting Information
S1 Fig. Analysis of convergence of the MCMC algorithm for the estimates from BAYESASS (Bayesian estimates of recent migration rates) using the software Tracer 1.6.Plots represent the log probability along iterations, where the burn-in iterations are indicated in light grey and sample iterations in black; and the Bayesian posterior density of the parameter estimates for a) the three migratory populations and b) all the 11 populations. As should be expected in a case of convergence, the log probability oscillates around a plateau, and the oscillations are quite regular, i.e., there are no persistent lows or highs (valleys or hills) in the plot.
(DOCX)
S1 Table. List of the 10 polymorphic primer sets used, allelic range (bp), fluorescent label and multiplex panel.
(DOCX)
S2 Table. Measures of genetic diversity assayed at ten microsatellite DNA loci for each sam-pled location.Sample acronyms correspond to locations as inFig 1andTable 1. Number of alleles per locus (Na) with number of private alleles in parentheses, mean allelic richness (AR), unbiased expected heterozygosity (He), observed heterozygosity (Ho), significance of departure from Hardy–Weinberg Equilibrium (HWE), mean number of alleles across loci (MNA) and number of polymorphic loci in each location (P). Grey shading indicates loci where MICRO--CHECKER detected signs of null alleles and relation with deviations from Hardy–Weinberg equilibrium. NS, non-significant;
,P<0.05;,P<0.01;,P<0.001;n, sample size;†, private allele with frequency>50%.
(DOCX)
S3 Table. Data of the ten microsatellite loci assayed for each of the 415 samples.
(PDF)
Acknowledgments
The authors especially thank Alpo Huhmarniemi and Jaakko Erkinaro (Finnish Game and Fisheries Research Institute, Finland), Michael Ovidio (University of Liège, Belgium) and Mar-tin Krappe (Society for Nature Conservation and Landscape Ecology, Kratzeburg, Germany) for the donation of samples. We are also grateful to Hugo Gante and Vítor Sousa for valuable suggestions on data analysis, to Maria Drago for assistance in early phases of the labwork and to Carlos Alexandre and Tadeu Pereira for assistance in the fieldwork. We thank the collecting permits provided by Instituto da Conservação da Natureza e das Florestas (ICNF), and Flu-viário de Mora for logistic support. Financial support was provided by Fundação para a Ciência e a Tecnologia (FCT), FEDER, COMPETE, and QREN through project funding (PTDC/BIA-BDE/71826/2006) and), through the pluriannual funding program to the Center of Oceanogra-phy (PEst-OE/MAR/UI0199/2011).) and by National Funds through FCT - Foundation for Science and Technology under the Project UID/MAR/04292/2013. C.S. Mateus and N. Mes-quita were supported by FCT grants SFRH/BD/44029/2008 and SFRH/BPD/14557/2003, respectively.
Author Contributions
References
1. Taberlet P, Fumagalli L, Wust-Saucy A-G, Cosson J-F. Comparative phylogeography and postglacial colonization routes in Europe. Molecular Ecology 1998; 7: 453–464. PMID:9628000
2. Lorenzini R, Lovari S. Genetic diversity and phylogeography of the European roe deer: the refuge area theory revisited. Biological Journal of the Linnean Society 2006; 88: 85–100. doi:10.1111/j.1095-8312. 2006.00606.x
3. Hewitt GM. Post-glacial re-colonization of European biota. Biological Journal of the Linnean Society 1999; 68: 87–112. doi:10.1006/bijl.1999.0332
4. Bell MA, Andrews CA. Evolutionary consequences of postglacial colonization of fresh water by primi-tively anadromous fishes. In: Streit B, Stadler T, Lively CM, editors. Evolutionary Ecology of Freshwater Animals. Basel: Birkhauser Verlag. pp. 323–363; 1997.
5. Hubbs CL. Speciation of fishes. The American Naturalist 1940; 74: 198–211.
6. Zanandrea G. Speciation among lampreys. Nature 1959; 184: 380.
7. Vladykov VD, Kott E. Satellite species among the holarctic lampreys (Petromyzonidae). Canadian Journal of Zoology 1979; 57: 860–867.
8. Mateus CS, Alves MJ, Quintella BR, Almeida PR. Three new cryptic species of the lamprey genus Lam-petraBonnaterre, 1788 (Petromyzontiformes: Petromyzontidae) from the Iberian Peninsula.
Contribu-tions to Zoology 2013; 82: 37–53.
9. Mateus CS, Almeida PR, Quintella BR, Alves MJ. MtDNA markers reveal the existence of allopatric evolutionary lineages in the threatened lampreysLampetra fluviatilis(L.) andLampetra planeri(Bloch)
in the Iberian glacial refugium. Conservation Genetics 2011; 12: 1061–1074.
10. Mateus CS, Rodríguez-Muñoz R, Quintella BR, Alves MJ, Almeida PR. Lampreys of the Iberian
Penin-sula: distribution, population status and conservation. Endangered Species Research 2012; 16: 183–
198.
11. Espanhol R, Almeida PR, Alves MJ. Evolutionary history of lamprey paired speciesLampetra fluviatilis
(L.) andLampetra planeri(Bloch) as inferred from mitochondrial DNA variation. Molecular Ecology 2007; 16: 1909–1924. PMID:17444901
12. Schreiber A, Engelhorn R. Population genetics of a cyclostome species pair, river lamprey (Lampetra fluviatilisL.) and brook lamprey (Lampetra planeriBloch). Journal of Zoological Systematics and
Evolu-tionary Research 1998; 36: 85–99.
13. Blank M, Jürss K, Bastrop R. A mitochondrial multigene approach contributing to the systematics of the brook and river lampreys and the phylogenetic position ofEudontomyzon mariae. Canadian Journal of Fisheries and Aquatic Sciences 2008; 65: 2780–2790.
14. Mateus CS, Stange M, Berner D, Roesti M, Quintella BR, Alves MJ. Strong genome-wide divergence between sympatric European river and brook lampreys. Current Biology 2013; 23: R649–R650. doi:
10.1016/j.cub.2013.06.026PMID:23928080
15. Sambrook J, Fritsch EF, Maniatis T. Molecular cloning: a laboratory manual. New York: Cold Spring Harbor Laboratory Press; 1989.
16. Bryan MB, Libants S V, Warrillow JA, Li W, Scribner KT. Polymorphic microsatellite markers for the landlocked sea lamprey,Petromyzon marinus. Conservation Genetics 2003; 4: 113–116.
17. Filcek KB, Gilmore SA, Scribner KT, Jones ML. Discriminating Lamprey Species Using Multilocus Microsatellite Genotypes. North American Journal of Fisheries Management 2005; 25: 502–509. 18. Takeshima H, Yokoyama R, Nishida M, Yamazaki Y. Isolation and characterization of microsatellite
loci in the threatened brook lampreyLethenteronsp. N. Molecular Ecology Notes 2005; 5: 812–814. 19. McFarlane CT, Docker MF. Characterization of 14 microsatellite loci in the paired lamprey species
Ichthyomyzon unicuspisandI.fossorand cross amplification in four other Ichthyomyzon species.
Con-servation Genetics Resources 2009; 1: 377–380.
20. Luzier CW, Docker MF, Whitesel TA. Characterization of ten microsatellite loci for western brook lam-preyLampetra richardsoni. Conservation Genetics Resources 2010; 2: 71–74.
21. Van Oosterhout C, Hutchinson WF, Wills DPM, Shipley P. Micro-Checker: software for identifying and correcting genotyping errors in microsatellite data. Molecular Ecology Notes 2004; 4: 535–538.
22. Excoffier L, Laval G, Schneider S. Arlequin (version 3.0): an integrated software package for population genetics data analysis. Evolutionary Bioinformatics Online 2005; 1: 47–50.
24. Kalinowski ST. HP-Rare 1.0: a computer program for performing rarefaction on measures of allelic rich-ness. Molecular Ecology Notes 2005; 5: 187–189.
25. Weir BS, Cockerham CC. Estimating F-statistics for the analysis of population structure. Evolution 1984; 38: 1358–1370.
26. Excoffier L, Smouse PE, Quattro JM. Analysis of molecular variance inferred from metric distances among DNA haplotypes: application to human mitochondrial DNA restriction data. Genetics 1992; 131: 479–491. PMID:1644282
27. Pritchard JK, Stephens M, Donnelly P. Inference of population structure using multilocus genotype data. Genetics 2000; 155: 945–959. PMID:10835412
28. Evanno G, Regnaut S, Goudet J. Detecting the number of clusters of individuals using the software STRUCTURE: a simulation study. Molecular Ecology 2005; 14: 2611–2620. PMID:15969739
29. Earl DA, VonHoldt BM. STRUCTURE HARVESTER: a website and program for visualizing STRUC-TURE output and implementing the Evanno method. Conservation Genetics Resources 2012; 4: 359–
361.
30. Rosenberg NA. Distruct: a program for the graphical display of population structure. Molecular Ecology Notes 2004; 4: 137–138.
31. Cornuet J-M, Piry S, Luikart G, Estoup A, Solignac M. New methods employing multilocus genotypes to select or exclude populations as origins of individuals. Genetics 1999; 153: 1989–2000. PMID: 10581301
32. Rannala B, Mountain JL. Detecting immigration by using multilocus genotypes. Proceedings of the National Academy of Sciences of the United States of America 1997; 94: 9197–9201. PMID:9256459 33. Beerli P. Effect of unsampled populations on the estimation of population sizes and migration rates
between sampled populations. Molecular Ecology 2004; 13: 827–836. PMID:15012758
34. Paetkau D, Slade R, Burden M, Estoup A. Genetic assignment methods for the direct, real-time estima-tion of migraestima-tion rate : a simulaestima-tion-based exploraestima-tion of accuracy and power. Molecular Ecology 2004; 13: 55–65. PMID:14653788
35. Peakall R, Smouse PE. Genalex 6: genetic analysis in Excel. Population genetic software for teaching and research. Molecular Ecology Notes 2006; 6: 288–295.
36. Peakall R, Smouse PE. GenAlEx 6.5: genetic analysis in Excel. Population genetic software for teach-ing and research-an update. Bioinformatics 2012; 28: 2537–2539. PMID:22820204
37. Anderson EC, Thompson EA. A model-based method for identifying species hybrids using multilocus genetic data. Genetics 2002; 160: 1217–1229. PMID:11901135
38. Wilson GA, Rannala B. Bayesian inference of recent migration rates using multilocus genotypes. Genetics 2003; 163: 1177–1191. PMID:12663554
39. Rambaut A, Suchard MA, Xie D, Drummond AJ. Tracer v1.6. 2014. Available:http://beast.bio.ed.ac.uk/ Tracer.
40. Piry S, Luikart G, Cornuet J-M. BOTTLENECK: a computer program for detecting recent reductions in the effective population size using allele frequency data. Journal of Heredity 1999; 90: 502–503. 41. Luikart G, Allendorf FW, Cornuet J-M, Sherwin WB. Distortion of allele frequency distributions provides
a test for recent population bottlenecks. Journal of Heredity 1998; 89: 238–247. PMID:9656466 42. Garza JC, Williamson EG. Detection of reduction in population size using data from microsatellite loci.
Molecular Ecology 2001; 10: 305–318. PMID:11298947
43. Swofford DL. PAUP*. Phylogenetic Analysis Using Parsimony (*and Other Methods). Version 4.0b10. Sinauer Associates, Sunderland; 2002.
44. Saitou N, Nei M. The Neighbor-joining Method: A New Method for Reconstructing Phylogenetic Trees. Molecular biology and evolution 1987; 4: 406–425. PMID:3447015
45. Posada D, Crandall KA. MODELTEST: testing the model of DNA substitution. Bioinformatics 1998; 14: 817–818. PMID:9918953
46. Hewitt GM. Some genetic consequences of ice ages, and their role in divergence and speciation. Bio-logical Journal of the Linnean Society 1996; 58: 247–276.
47. Bracken FSA, Hoelzel AR, Hume JB, Lucas MC. Contrasting population genetic structure among fresh-water-resident and anadromous lampreys: the role of demographic history, differential dispersal and anthropogenic barriers to movement. Molecular Ecology 2015; 24: 1188–1204. doi:10.1111/mec. 13112PMID:25689694
49. Goodman DH, Reid SB, Docker MF, Haas GR, Kinziger AP. Mitochondrial DNA evidence for high levels of gene flow among populations of a widely distributed anadromous lampreyEntosphenus tridentatus
(Petromyzontidae). Journal of Fish Biology 2008; 72: 400–417.
50. Spice EK, Goodman DH, Reid SB, Docker MF. Neither philopatric nor panmictic: microsatellite and mtDNA evidence suggests lack of natal homing but limits to dispersal in Pacific lamprey. Molecular Ecology 2012; 21: 2916–2930. doi:10.1111/j.1365-294X.2012.05585.xPMID:22564149
51. Gante HF, Micael J, Oliva-Paterna FJ, Doadrio I, Dowling TE, Alves MJ. Diversification within glacial refugia: tempo and mode of evolution of the polytypic fishBarbus sclateri. Molecular ecology 2009; 18: 3240–3255. doi:10.1111/j.1365-294X.2009.04264.xPMID:19573028
52. Mesquita N, Hänfling B, Carvalho GR, Coelho MM. Phylogeography of the cyprinidSqualius aradensis
and implications for conservation of the endemic freshwater fauna of southern Portugal. Molecular Ecology 2005; 14: 1939–1954. PMID:15910317
53. Aboim MA, Mesquita N, Drago M, Coelho MM, Alves MJ. Assessing inter-drainage connections: pat-terns of genetic diversity in an Iberian cyprinid fish. Biological Journal of the Linnean Society 2013; 109: 656–669.
54. Consuegra S, García de Leániz C, Serdio A, González Morales M, Straus LG, Knox D, et al. Mitochon-drial DNA variation in Pleistocene and modern Atlantic salmon from the Iberian glacial refugium. Molec-ular ecology 2002; 11: 2037–2048. PMID:12296947
55. Hardisty MW, Potter IC. The behaviour, ecology and growth of larval lampreys. In: Hardisty MW, Potter IC, editors. The biology of lampreys, Vol 1. London: Academic Press. pp. 85–125; 1971.
56. Hardisty MW. General introduction to lampreys. In: Holčík J, editor. The freshwater fishes of Europe,
Vol 1, Part I—Petromyzontiformes. Wiesbaden: Aula-Verlag. pp. 19–83; 1986.
57. Stewart JR, Lister AM. Cryptic northern refugia and the origins of the modern biota. Trends in Ecology & Evolution 2001; 16: 608–613. doi:10.1016/S0169-5347(01)02338-2
58. Fu Y-X. Statistical tests of neutrality of mutations against population growth, hitchhiking and back-ground selection. Genetics 1997; 147: 915–925. PMID:9335623
59. Tajima F. Statistical Method for Testing the Neutral Mutation Hypothesis by DNA Polymorphism. Genetics 1989; 123: 585–595. PMID:2513255
60. Hubbs CL. The life cycle and growth of lampreys. Papers of the Michigan Academy of Science 1925; 4: 587–603.
61. Rougemont Q, Gaigher A, Lasne E, Côte J, Coke M, Besnard A-L, et al. Low reproductive isolation and highly variable levels of gene flow reveal limited progress towards speciation between European river and brook lampreys. Journal of evolutionary biology 2015; 28: 2248–2263. doi:10.1111/jeb.12750 PMID:26348652
62. Docker MF, Mandrak NE, Heath DD. Contemporary gene flow between“paired”silver (Ichthyomyzon unicuspis) and northern brook (I.fossor) lampreys: implications for conservation. Conservation Genet-ics 2012; 13: 823–835.
63. Spice EK, Goodman DH, Reid SB, Docker MF. Neither philopatric nor panmictic: microsatellite and mtDNA evidence suggests lack of natal homing but limits to dispersal in Pacific lamprey. Molecular Ecology 2012; 21: 2916–2930. doi:10.1111/j.1365-294X.2012.05585.xPMID:22564149
64. Abou-Seedo FS, Potter IC. The estuarine phase in the spawning run of the River lampreyLampetra flu-viatilis. Journal of Zoology 1979; 188: 5–25.