Detection in Complex Dynamic Networks
Rodica Ioana Lung1*, Camelia Chira2, Anca Andreica2
1Department of Statistics, Forecasting and Mathematics, Babes¸-Bolyai University, Cluj Napoca, Romania,2Department of Computer Science, Babes¸-Bolyai University, Cluj Napoca, Romania
Abstract
The detection of evolving communities in dynamic complex networks is a challenging problem that recently received attention from the research community. Dynamics clearly add another complexity dimension to the difficult task of community detection. Methods should be able to detect changes in the network structure and produce a set of community structures corresponding to different timestamps and reflecting the evolution in time of network data. We propose a novel approach based on game theory elements and extremal optimization to address dynamic communities detection. Thus, the problem is formulated as a mathematical game in which nodes take the role of players that seek to choose a community that maximizes their profit viewed as a fitness function. Numerical results obtained for both synthetic and real-world networks illustrate the competitive performance of this game theoretical approach.
Citation:Lung RI, Chira C, Andreica A (2014) Game Theory and Extremal Optimization for Community Detection in Complex Dynamic Networks. PLoS ONE 9(2): e86891. doi:10.1371/journal.pone.0086891
Editor:Marco Tomassini, Universite´ de Lausanne, Switzerland
ReceivedJuly 3, 2013;AcceptedDecember 17, 2013;PublishedFebruary 26, 2014
Copyright:ß2014 Lung et al. This is an open-access article distributed under the terms of the Creative Commons Attribution License, which permits unrestricted use, distribution, and reproduction in any medium, provided the original author and source are credited.
Funding:This research is supported by Grant PN II TE 320, ‘‘Emergence, auto-organization and evolution: New computational models in the study of complex systems,’’ funded by CNCS Romania (http://uefiscdi.gov.ro/articole/1966/Proiecte-de-cercetare-pentru-stimularea-constituirii-de-tinere-echipe-de-cercetareindependente-ti.html). The first author would like to acknowledge the support received within the PN-II-PT-PCCA-2011-3.1-0682 OPEN-RES Academic Writing project. The funders had no role in study design, data collection and analysis, decision to publish, or preparation of the manuscript.
Competing Interests:The authors have declared that no competing interests exist.
* E-mail: [email protected]
Introduction
Networks represent a central model for the description of complex phenomena and they have been studied independently in many different fields such as mathematics, neuroscience, biology, epidemiology, sociology, social-psychology and economy. Recent research trends suggest the emergence of the new science of networks as a field by itself, pioneered by the work of Barabasi [1] and Watts [2]. Typical examples of complex networks in nature and society include metabolic networks, the immune system, the brain, human social networks, communication and transport networks, the Internet and the World Wide Web (WWW). The basic unit of the system is reduced to simple nodes (or vertices) connected by edges (or links) depicting their pairwise relationships. The complexity of real networks is given by non-trivial topological features such as skewed degree distribution, high clustering coefficient and hierarchical structure. Furthermore, local interac-tions between simple components bring forth a complex global behavior in a non-trivial manner [3]. The most studied features of real-world complex networks include degree distribution, average distance between vertices, network transitivity and community structure [1,4-7]. The focus of the current study is the community structure problem in dynamic complex networks.
In a graph representation of a complex system as a network, nodes with similar properties (or function) have a higher chance to be linked to each other compared to random pairs of nodes. Such nodes tend to form a consistent subgraph (called community) highlighted by the dense interconnections. A community in a network can be defined as a group of nodes densely connected with each other but sparsely connected with nodes belonging to
other communities [5,8]. An efficient detection of the community structure can facilitate the identification of functional subunits of the system providing at the same time a powerful tool for the visualization and representation of the network structure. For example, communities may reveal groups of mutual acquaintances in social networks, web pages grouped on the same subject and functional modules in protein interaction networks [7]. Important applications include identifying locations for dedicated mirror servers in order to increase the performance of the WWW, creation of recommendation systems by identifying groups of customers with similar interests, preventing crime by identifying hidden communities on the WWW, vaccination of hubs in the case of developing epidemics and limited vaccinating resources and identifying groups of similar items in social, biochemical and neural networks that can simplify the functional analysis of the networks.
of nodes in random graphs (with the same expected degree sequence).
An important issue in community detection, less studied however, is the case ofdynamiccommunities. This situation is of great significance since most real-world networks change in time and this dynamic behavior should be reflected in the evolution of communities. For example, ad-hoc networks formed by commu-nication nodes constantly change and need to be grouped in order to be able to choose the most efficient communication path. Clearly, the study of dynamic networks can facilitate predictions about the evolution in time of networks from various different areas. Dynamics add another dimension of complexity to the NP-hard problem of detecting communities. An extra mechanism is needed to deal with the network at different timesteps and to include as necessary in the detection of the current community structure, the community structure that existed at the previous timestep.
It should be emphasized that the focus of the current research is on the community detection problem for dynamic networks using online algorithms, i.e. the method must provide a clustering for the network at timestep t before seeing the data at timestep tz1. Furthermore, simply using an algorithm to detect communities at different timesteps without considering the evolution of the network is not viewed a good solution as this would be a simple task of community detection repeatedly applied. For instance, methods of information compression proposed in [18,19] detect communities at different timestamps, without taking into account the structure at a previous timestamp. In contrast, online algorithms should be able to capture the dynamic aspect of network data and adjust online the communities as the network evolves. These features are well described by the concept of evolutionary clusteringintroduced in [20] and engaged in some of the existing methods for the detection of evolving communities [21– 28]. The strategy is to look for a trade-off betweensnapshot quality(a measure of how good the current community structure is) and history cost (a measure of how different the current community structure is compared to the previous one).
The novel approach presented in this paper is based on a game theoretical approach that uses the concept of Nash equilibrium in the following manner: each network node is a player; players have to choose a community; each player has to maximize its payoff computed based on a community score. The Nash equilibrium of this game is a situation in which no node can improve its payoff by unilaterally changing community. When formulating the commu-nity detection problem as a game, the existence and uniqueness of the equilibrium depends on the choice of payoff function. Our approach is experimental: an extremal optimization algorithm is used to approximate the Nash equilibrium of the proposed game and its convergence is evaluated by use of numerical experiments performed on synthetic dynamic networks as well as on several real-world complex networks where the dynamic character is captured in the datasets.
Methods
Game theory - Prerequisites
Mathematical games model conflicting situations among two or more participants called players. A mathematical game is defined by the triplet formed by the set of players, the strategies available to them and the set of payoff/utility functions for each player. Naturally, all players try to maximize their payoffs. The game is considered non-cooperative if players are not allowed to commu-nicate or interact with each other (i.e. form alliances). Formally a game is defined by ~(N,S,U)where:
N
Nrepresents the set of players,N~f1,::::,ng,nis the number of players;N
for each playeri[N,Sirepresents the set of actions available tohim and S~S1|S2|:::|SN is the set of all possible situations of the game; an element s[S is called a strategy
profile,s~(s1,s2,:::,sn), wheresirepresents the strategy chosen by playeriin the profiles;
N
for each playeri[N,ui:S?Rrepresents the payoff function;U~fu1,:::,ung.
The ideal situation in which all players can achieve their maximum possible payoff usually does not exist. The most popular solution concept for a non-cooperative game is the Nash equilibrium [29,30]. A collective strategy s[S for the game represents a Nash equilibrium if no player has anything to gain by changing only his own strategy.
In [31] theNash ascendancy relationis defined as follows: consider two strategy profilesx andyfromS. An operatork:S|S?N that associates the cardinality of the set composed by the playersi that would benefit if they would change individually their strategy fromxitoyi.
Letx,y[S:We say the strategy profilexNash ascendsthe strategy profileyin and we writex[yif the inequality
k(x,y)vk(y,x)
holds.
Thus a strategy profilex ascends strategy profileyif there are less players that can increase their payoffs by switching their strategy fromxitoyithan vice-versa. It can be said that strategy profilexis more stable (closer to equilibrium) then strategyy.
The strategy profiles[Sis called non-ascended in Nash sense (NAS) if
A
=s[S,s=ssuch thats[s:
In [31] it is shown that all non-ascended strategies are NE and also all NE are non-ascended strategies. Thus the Nash ascendancy relation can be used to characterize the equilibria of a game. Moreover, this relation can also be used for fitness assignment within heuristic methods such as evolutionary algo-rithms in order to direct their search towards the Nash equilibrium of a game.
The Community Detection Game
The community detection problem is considered from a game theoretic point of view by defining the following game:
N
Players:Consider eachnodeof the network as a player; thenumber of network nodes determines the number of players involved in the game. LetN be the number of nodes. The players will be denoted byi,i~1,:::,N;
N
Strategies: The strategies available to each player are theentire set of communities out of which every node has to choose one (the most suitable for it). A situation of the game is defined as a network cover (community structure) in which each node belongs to a community:
Γ
P~(Ci1,:::,Cin),
whereCik represents the community chosen by playerk;
N
PayoffsThe considered payoff of each player will be the score of the community the player has chosen as defined by Lancichinetti in [32]. This score is computed as the difference between the ’quality’ of the community containing that player and the ’quality’ of that community without him. The ’quality’ of a community is defined asfC~ k
C in (kC
inzkCout)
a, ð1Þ
where
– kCin is the internal degree of a community and equals the double of the number of internal links of that community.
–kCoutis the external degree and is computed as the number of links joining each member of the module with the rest of the graph.
–ais a positive real-valued parameter, controlling the size of the communities.
The payoff of playeriis thus computed:
ui(P)~fCi{fCi{i ð2Þ
where Ci represents the community chosen by player i and Ci{idenotes the communityCiwithout nodei.m
In this game each player (node) seeks to maximize its payoff by choosing the community that has the most to gain by including it, or has more to loose by not having it as a member.
The Nash equilibrium of this game may be such a situation in which no player (no node) can improve its payoff by unilateral deviation (by changing its community only by himself).
The Nash ascendancy relation. can be rephrased as: having two situations Pand Q of the game,P is better thanQ in Nash sense if there are less nodes i that can improve their payoffs by individually switching fromPitoQithan the playersj that improve their payoffs from switching fromQjtoPj.
Thus we compute
k(P,Q)~cardfiji[f1,. . .,Ng,ui(P)vui(Qi,P{i)g,
where (Qi,P{i) denotes the community structure constructed fromPbut with nodeibelonging to the community to which it belongs in coverQ.
We say thePNash AscendsQif we havek(P,Q)vk(Q,P):Two strategies (community structures) are indifferent to each other if k(P,Q)~k(Q,P):
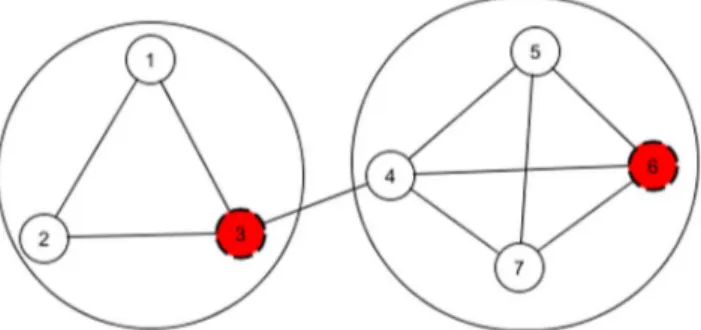
A community structure P is considered non-ascended (non-dominated) in Nash sense if there does not exists another cover such thatPis Nash ascended by it. According to [31] the set of non-ascended strategies coincides with the set of Nash equilibria of the game. A game may have several Nash equilibria which are indifferent to each other from the Nash ascendancy point of view. The main difference between the game theoretic approach presented here that uses the score from [32] is in the solution concept that is searched for. In [32] the average fitness of the communities is used to evaluate the stability of a cover. The intuition behind our approach is that instead of averaging the fitnesses of all the communities, when simultaneously maximizing all the nodes fitnesses the Nash equilibrium searched for ensures stability against unilateral deviations. Moreover, one of the major challenges in designing optimization approaches for this problem Figure 1. A small network with 7 nodes and 2 communities.
doi:10.1371/journal.pone.0086891.g001
Table 1.4 individuals encoding covers withC(A)~2,3,4,5.
A1 A2 A3 A4
C(A) 2 3 4 5
C1 0010010 0001000 1010101 0010011
C2 1101101 1100110 0001000 0000100
C3 0010001 0000010 1000000
C4 0100000 0100000
C5 0001000
doi:10.1371/journal.pone.0086891.t001
Table 2.Nash Extremal Optimization procedure.
1: repeat
2: For the ’current’ configurationDievaluateuj(Di)for each playerj;
3: ifU(0,1)1§p
EOthen
4: find the playerjwith the "worst payoff";
5: else
6: randomly generatej;
7: end if
8: changeDijrandomly;
9: if(DiNash ascendsPi)then
10: setPi:~D;
11: end if
12:
13:untilTerminationCondiyion;
14: (ReturnPiwith the best Community Score);
is to propose appropriate fitness functions that highlight ’’right’’ communities and do not lead to degenerate solutions such as finding a single community containing all nodes. In our approach, by considering that each node has to choose the community that is best suited for him - actually the community to which he contributes the most and by searching for an equilibrium -optimal/extremal values are avoided and good covers can be found.
Nash Extremal Optimization for the Dynamic Community Detection Problem (NEO-CDD)
Extremal Optimization (EO) [33,34] is a general-purpose heuristic for finding high-quality solutions for many hard optimization problems. In this method the value of undesirable variables in a sub-optimal solution are replaced with new, random ones. Within EO a fitness value is assigned to each component of a search vector, the undesired variables are those having the worst fitness.
In the context of games there is a natural fitness assignment between each players strategy and its payoff value as a function of
a strategy profile. EO has been successfully applied to Nash equilibria detection for large Cournot games in this manner [35]. For the community detection problem, viewed as the game described above, the NEO-CDD based on Extremal Optimization is proposed. Consider a network ofnnodes. The main features of NEO-CDD are described in the following.
Encoding. Each individualAin the population represents a cover over the network represented as an array ofncolumns and a number of lines corresponding to the maximum expected number of communities denoted byCmax. An elementcij of the matrix is:
cij~ 1, if nodejbelongs to communityi
0, otherwise
A maximum number of communities that individualAsearches for, denoted byC(A), is also assigned, whereC(A)ƒCmax.
Fitness Assignment. For each nodejinAthe payoffuj(A)is computed based on equations (1) and (2). A global fitness P(A)
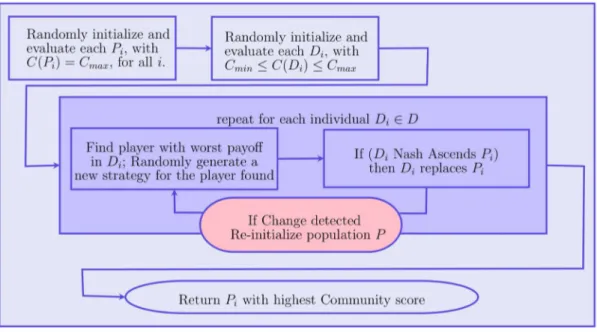
based on the community score is also computed for each coverA. Figure 2. Outline of NEO-CDD.
doi:10.1371/journal.pone.0086891.g002
Table 3.Outline of NEO-CDD.
1: Randomly initializeP0andD0. Set maximum number of communities for all individuals inD0;
2: EvaluateP0andD0;
3: Randomly initializeq; Evaluateq;
4: repeat
5: iffitness ofqunchangedthen
6: Run NEO withTerminationCondition=` fitness ofqchanged` or`maximum number of generations reached’;
7: else
8: ReinitializeDrandomly;
9: end if
10: untilsearch complete;
Example. Consider a network with 7 nodes and 2 commu-nities (Figure 1). Table 1 illustrates the encoding of 4 individuals (A1,A2,A3 and A4) with different number of communities. Columns represent nodes of the network and lines represent communities. The first cover has nodes 3 and 6 (red in Figure 1) in the first community and the rest in the second community. The payoff of the second node from A1 is u2(A1)~ 4
7{12~0:071428571.
Populations. NEO-CDD evolves a two-leveled population of covers, a parent populationPthat preserves the most promising solutions and a dummy population D of individuals performing the search following the rules of EO. Both populations have the same size Psize. Each individual Pi represents the best solution found so far by corresponding individualDifromD.
Initialization. At the beginning of the search process all individuals from P and D are randomly initialized. For all individuals inPthe maximum number of communities searched is set to Cmax. For individuals in D the number of communities searched is set between a minimum number Cmin and the maximumCmax. This number is assigned in order fromD1with Cmin(C(D1)~Cmin), forD2the number is increased with a stepw (C(D2)~C(D1)zw) and so on for each iw2 we set C(Di)~C(Di{1)zw until Cmax is reached. This process is repeated until all individuals in D are assigned a community number.
Extremal Optimization. Within standard Extremal Opti-mization two individuals are maintained: one that preserves the best solution found so far and another one that performs the search. NEO-CDD evolves in parallel pairs of individuals from the two populations following the rules of EO: individuals Pi in population P encode the best strategies found by their corre-spondingDifromD.
For each pair of covers(Pi,Di),i~1,:::,Psize, Pi[P andDi[D the EO algorithm is applied as described in Table 2 for a number of generations. At each iteration the EO algorithm finds the player (node) fromDi with the worst payoff and randomly generates a new strategy (community) for him. If the new cover Nash ascends Pi it will replace it and if not - nothing happens. Because this standard EO presents the risk of premature convergence if the player with the worst payoff cannot actually increase it by switching to any other strategy, a parameterpEOis introduced as the probability to chose a random player to be modified within the EO procedure.
At any momentPi is the best community cover found so far with maximum allowed community number ofC(Di).
For a predefined number of communities, the Nash extremal optimization procedure generates correct community structures that are indifferent to each other from the Nash ascendancy point of view. For example, for a network presenting4 communities, individuals from D can search for covers containing 2 to 10
communities, that isC(D1)~2, C(D2)~3, and so on. At some point during the search all individuals will represent valid community structures, with some communities united or divided depending on the maximum number permitted. At the end of a EO procedure an extra-criterion is needed to determine the best community structure detected so the community score [12] (see Appendix S1 for more information) is used.
Dealing with Dynamic Aspects. When dealing with dynamic landscapes two major aspects have to be considered: (a) how to determine if a change has occured and then, (b) how to deal with that change.
(a) A change in the network can be easily identified by re-evaluating a sentinel individual at the beginning of each iteration. If its fitness value differs from the previous one, a change has occurred.
(b) When a change is detected NEO-CDD reinitializes all individuals in thePpopulation, keeping populationDunchanged. In this way the information regarding the previous community structure is available within D while diversity is induced by individuals inP.
Table 4.Parameter settings for NEO-CDD.
Parameter
Synthetic
datasets Football Vast 2008
Population size 20 30 30
pEO 0 0.02 0.02
Cmin 2 8 50
Cmax 8 16 100
w 1 1 linearly decreasing from 10 to
1
In order to estimate the value of the optimum number of communities the
value ofwis initially set to10than decreased to 1 linearly while the values of CminandCmaxare adjusted based on the community score obtained in the first
iterations of the algorithm.
doi:10.1371/journal.pone.0086891.t004
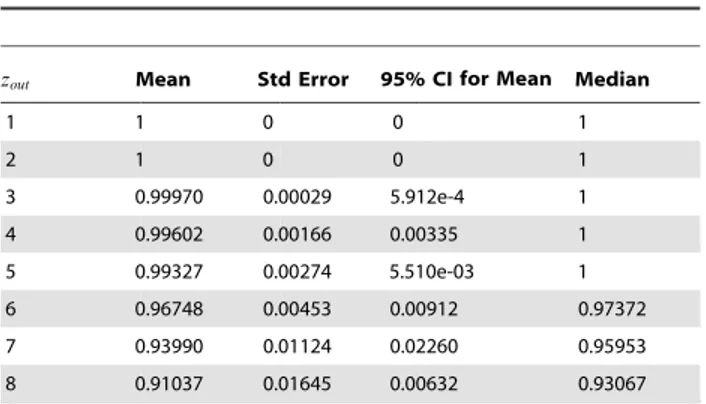
Table 5.Descriptive statistics of obtained NMI values for the 10% sets.
zout Mean Std Error 95% CIfor Mean Median
1 1 0 0 1
2 1 0 0 1
3 0.99970 0.00029 5.912e-4 1
4 0.99602 0.00166 0.00335 1
5 0.99327 0.00274 5.510e-03 1
6 0.96748 0.00453 0.00912 0.97372
7 0.93990 0.01124 0.02260 0.95953
8 0.91037 0.01645 0.00632 0.93067
doi:10.1371/journal.pone.0086891.t005
Table 6.Descriptive statistics of obtained NMI values for the 20% sets.
zout Mean Std Error 95% CIfor Mean Median
1 1 0 0 1
2 1 0 0 1
3 0.99772 0.00117 2.351e-0 1
4 0.99874 0.00064 1.289e-03 1
5 0.99878 0.00319 6.416e-03 1
6 0.97741 0.00388 7.804e-03 0.98543
7 0.93435 0.01272 0.02557 0.95883
8 0.90078 0.01799 0.03615 0.92606
Outline of NEO-CDD. NEO-CDD evolves the two popula-tions of individuals representing covers for the current network. The first one,P, acts as the memory of each individual found by population D that explores the search space by using a Nash Extremal Optimization procedure. Each time a change is detected in the search space, P is reinitialized while individuals in D continue their search. Each iteration the individual with the best community score is reported. NEO-CDD is outlined in Table 3. A schematic representation of the method is presented in Figure 2.
Parameters. NEO-CDD uses the following parameters:
N
Population size;N
maximum number of generations between changes or number of epochs (necessary to end the search only after the last network change);N
pEOprobability to choose a different node than the one with the worst payoff during EO;N
Initial minimum and maximum number of communities searchedCmin andCmax and stepw;Results and Discussion
Computational experiments are performed for both synthetic datasets and real-world complex dynamic networks. This section describes first the network datasets used and then presents the results obtained with their analysis.
Networks
Synthetic Datasets. The synthetic datasets reflect dynamic networks in which edges suffer changes in time and nodes can change their community. The benchmarks are based on the method proposed by Newman [5] for generating network data. The number of nodes in the network is 128 grouped in 4 communities of 32 nodes each. The average degree of each node is set to 16. A number of 50 networks are generated corresponding to 50 timesteps. Dynamics are introduced at each timestep as follows: d% nodes are randomly selected from each community and assigned to the other three communities in a random way. The number of communities stays the same from one timestep to the next. The values considered for dare 10% (3 nodes from each community move to the other communities, 1 to each),20%(6 nodes from each community move to the other communities, 2 to each at random), and30%(9 nodes from each community move to the other communities, 3 to each at random).
Edges between nodes of the same community are randomly placed with a higher probability while edges between nodes of different communities are placed with a lower probability. A parameter calledzoutcontrols the number of links from a node to nodes from other communities. The noise level in the network increases with zout. The values used for zout in the current experiments range from 1 to 8 (that is, half of the average degree of a node).
It should be noted that these synthetic datasets are similar to the SYN-FIX benchmark engaged in studies such as [23–25]. The network size and community structure is the same, but the number of timesteps considered is only 10 and the number of nodes switching communities every timestep is set to 3 (this corresponds to advalue of 10% in our dataset).
To evaluate the clustering result DCS~ffC11,. . .,Ck11g,
. . .,fCT
1,. . .,CTkTgg, whereT~50, a direct comparison with the
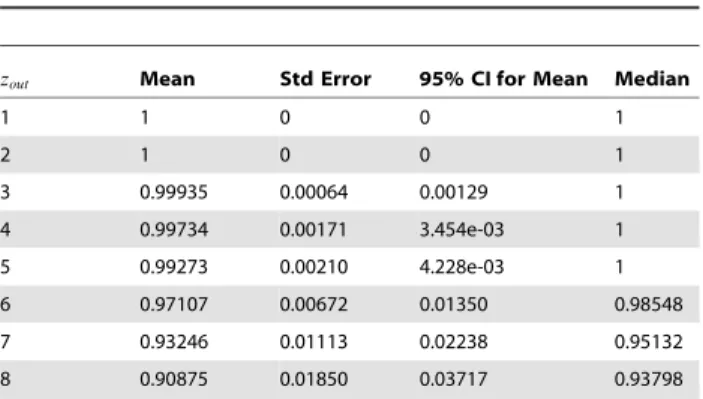
Table 7.Descriptive statistics of obtained NMI values for the 30% sets.
zout Mean Std Error 95% CIfor Mean Median
1 1 0 0 1
2 1 0 0 1
3 0.99935 0.00064 0.00129 1
4 0.99734 0.00171 3.454e-03 1
5 0.99273 0.00210 4.228e-03 1
6 0.97107 0.00672 0.01350 0.98548
7 0.93246 0.01113 0.02238 0.95132
8 0.90875 0.01850 0.03717 0.93798
doi:10.1371/journal.pone.0086891.t007
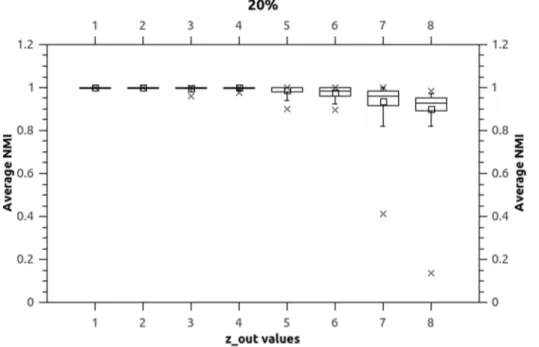
Figure 3. Boxplots (d~10%).Boxplots indicate that NEO-CDD is capable to detect and maintain the community structures throughout the 50 timestamps with very good NMI values even forzout~8.
known community structure for the network at each timestep t~1. . .T is performed. For this purpose, theNMI - Normalized
Mutual Information(see Appendix S1 for more information about NMI) is computed to compare the real partition with the detected one. NMI represents a similarity measure between two partitions and is expressed as a real number between0and1(higher values reflect more accurate partitions). For computing the NMI in our experiments we have used the source code made available by Lancichinetti et al [36] which can be freely downloaded from [37].
Football Network. The football data is represented by the games of the National Collegiate Athletic Association (NCAA) Football Division 1-A, collected by James Howell [38]. We selected the years 2005–2009 for the experiments performed in this paper. There are 119 football teams in 2005–2006 and 120 teams starting with 2007. The nodes of the network are represented by the teams, while the edges between nodes represent regular season games between teams. The teams are classified in conferences, each conference containing teams that are playing Figure 4. Boxplots (d~20%).Boxplots indicate that NEO-CDD is capable to detect and maintain the community structures throughout the 50 timestamps with very good NMI values even forzout~8.
doi:10.1371/journal.pone.0086891.g004
Figure 5. Boxplots (d~30%).Boxplots indicate that NEO-CDD is capable to detect and maintain the community structures throughout the 50 timestamps with very good NMI values even forzout~8.
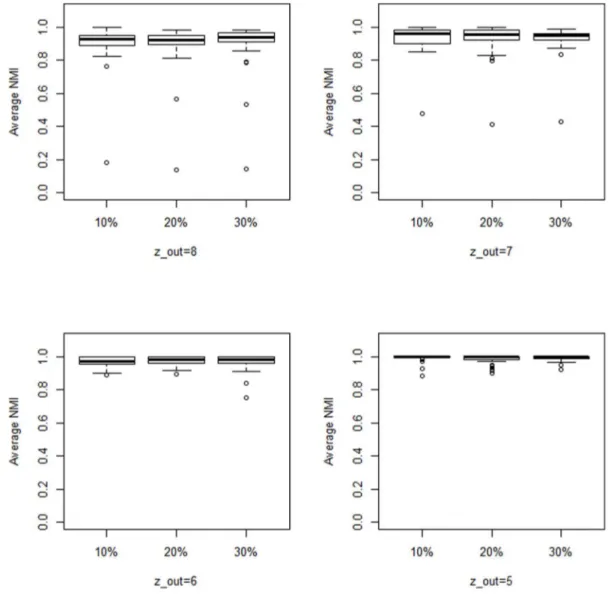
Figure 6. Comparison.Average NMI values obtained forzout~5,6,7,8. Boxplots indicate that there is no statistical difference between results
obtained ford~10%,20%or30%. doi:10.1371/journal.pone.0086891.g006
football games more often with each other than with teams from other conferences. Each conference can therefore be seen as a community, with more intensively connected nodes inside the community and fewer connections between nodes belonging to different communities. There are 12 conferences for the 2005– 2009 teams, conferences whose structure slightly changes from one year to another. The dynamism of the communities can therefore be understood as the change that appears in the conferences structure, taking one year as a time step. Because the community structure is known, we use NMI in order to evaluate the algorithm performance.
VAST Network. The VAST dataset was part of the 2008 VAST Challenge [39]. It represents the cell phone calls on Isla del Sueno between a selection of 400 persons, over a ten-day period in June 2006. The dataset includes information about the calling phone, receiving phone, date/time, duration and location of the call origination cell tower. We will only use information about the initiator and the recipient of the call, together with the date of the call. We therefore obtain a network where the nodes are represented by the 400 persons, while the edges between nodes represent the cell phone calls between the 400 persons. The dynamism of the communities is given by the changes that occur in the network from one day to another. As the real communities within this network are not actually known the community score and modularity are used in the literature to report the results obtained for this network.
Results
For all experiments performed numerical results are reported by averaging results obtained over 10 independent runs of NEO-CDD. Whenever possible, if the actual community structure of the network is known, the NMI is used to evaluate and report the results. For the VAST 2008 dataset the community score is reported.
Parameter settings. The parameters used by NEO-CDD for each dataset used during numerical experiments are presented in Table 4.
Synthetic Datasets. Both numerical values and box-plots for the average NMI values over the 10 independent runs for the synthetic datasets are presented in Tables 5, 6 and 7 (values 1 and 0 represent the exact results 1 and 0 with no rounding, unnecessary0decimal points are omitted) and Figures 3, 4, and 5. Boxplots represent minimum, median, average, maximum and inter-quartile range for average NMI values over the 50 time-stamps for each dataset.
Discussion. Figure 6 illustrates the fact that there are no actual differences in behavior when considering different
magnitudes of changes within datasets. Wilcoxon sum rank tests performed for all the pairs indicate also that differences between results obtained for different values ofdare not significant.
Results obtained for the synthetic datasets for the cased~10% can be compared to the results reported for the SYN-FIX benchmark in [23–25]. Indeed, SYN-FIX is created based on the same number of nodes and 3 nodes changing communities each timestep which correspond to thedvalue of10%for our synthetic dataset. The difference is that the number of timesteps considered in SYN-FIX is only 10 whereas our dataset contains 50 networks. For zout~3, the FacetNet algorithm [23] obtains NMI values ranging from about 0.77 to 0.9 for the 10 timesteps as reported in [24]. Forzout~5, as the number of connecting nodes from other communities is increasing, FacetNet [23] obtains an average NMI value of around 0.2, failing therefore to uncover the community structure. The particle-and-density based evolutionary clustering method presented in [24] obtains similar results with FacetNet for bothzoutvalues of 3 and 5. Compared to these two methods, the proposed approach is clearly superior obtaining the maximum NMI value of 1 forzout~3and a very high average NMI of0:99
forzout~5(see Table 5). The DYN-MOGA algorithm [25] is able to trigger better results compared to the methods in [23,24] reporting an average NMI of almost 1 forzout~3and a NMI above0:8for zout~5. While for smallzoutvalues, DYN-MOGA has a competitive performance, for zout~5 the average NMI reported is considerably lower than that of the proposed model. The DYN-NNIA and DYN-LSNNIA methods [40] report better results compared to DYN-MOGA. Forzout~5the average NMI is above 0.85 while forzout~6the average NMI ranges between 0.7 and 0.91 for 10 timesteps. Nevertheless, the proposed method reports a higher average NMI (0.97 forzout~6) not only for 10% of nodes changing communities each timestep but also for higherd values. The game theoretic approach proposed in this paper clearly outperforms the DYN-MOGA [25] and DYN-NNIA [40] methods as it is able to lead to high NMI values above 0.9 even for highzoutvalues of 5, 6, 7 and 8, which induce more noise in the dynamic networks.
Results for Real-World Networks. Numerical results ob-tained by NEO-CDD for the real-world networks are presented in Tables 8 and 9 and illustrated in Figure 7.
Discussion. In [25], the results of DYN-MOGA are given for the Football network in which only the years 2005, 2006 and 2007 Table 8.Descriptive statistics of obtained NMI values for the
five football datasets.
Year Mean NMI St. error Median 95% CI for Mean
2005 0.87661 0.01053 0.86501 0.02382
2006 0.89450 0.00813 0.90986 0.01840
2007 0.90684 0.00780 0.91927 0.01765
2008 0.92098 0.00724 0.93185 0.01638
2009 0.92475 0.00612 0.93127 0.01385
doi:10.1371/journal.pone.0086891.t008
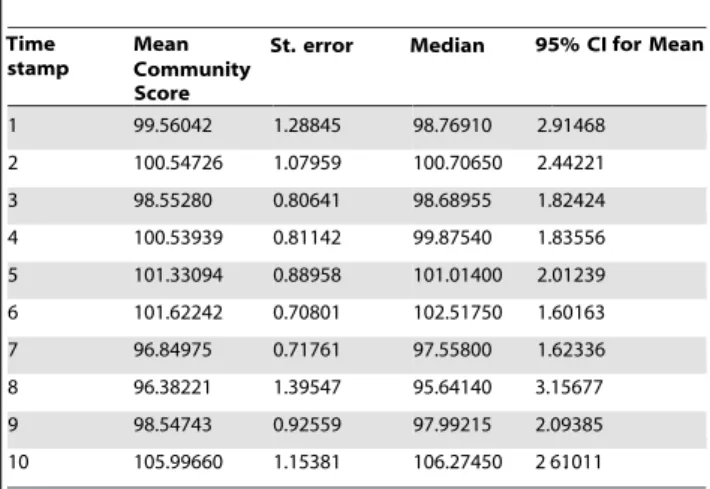
Table 9.Numerical results for the VAST2008 challenge dataset (community scores).
Time Mean
Community
St. error Median 95% CI stamp
Score
for Mean
1 99.56042 1.28845 98.76910 2.91468
2 100.54726 1.07959 100.70650 2.44221
3 98.55280 0.80641 98.68955 1.82424
4 100.53939 0.81142 99.87540 1.83556
5 101.33094 0.88958 101.01400 2.01239
6 101.62242 0.70801 102.51750 1.60163
7 96.84975 0.71761 97.55800 1.62336
8 96.38221 1.39547 95.64140 3.15677
9 98.54743 0.92559 97.99215 2.09385
10 105.99660 1.15381 106.27450 2 .61011
are considered to generate the dynamic networks. The average NMI reported by DYN-MOGA [25] is between 0.6 and 0.7 for the three years considered. The corresponding modularity value is around 0.58. As shown in Table 8, the NMI results obtained by NEO-CDD range between 0.876 (for the year 2005) and 0.906 (for the year 2007), which are clearly superior values to MOGA results reported in [25]. The NNIA and DYN-LSNNIA methods from [40] improve the DYN-MOGA results for the Football data reporting an average NMI higher than 0.9 for the last four of the five years considered. The approach proposed in the current paper is competitive with the DYN-LSNNIA method as we obtain an average NMI of 0.904 over all five years in the Football network.
For the VAST network, the methods from [25,40] report an average community score between 92 and 110 [40]. The corresponding modularity values for the covers obtained range between 0.62 and 0.66 [40]. In contrast, the lowest community score obtained by our proposed method is 96.382 at timestamp 8 (see Table 9) while the highest mean community score is around 105. It is known that the structure of the cellphone network changed drastically on the 8th day, which leads to a considerable variation between the community structures from timesteps 7 and 8. As shown in Table 9, our algorithm is able to handle this significant change efficiently as the community score drops from 96.849 at timstep 7 to 96.382 at timestep 8, which is clearly not a major loss of accuracy. On the other hand, the drop in performance reported by DYN-MOGA and DYN-NNIA methods [40] in terms of community score is from around 110 at timestep 7 to just below 100 at timestep 8. This indicates a good reliable behavior of NEO-CDD in handling the changes in network data.
Final remarks
The proposed game theoretic approach which assigns individual payoffs to each network node provides the framework to efficiently
apply the extremal optimization method. By searching for the Nash equilibrium of the game instead of looking for optimal solutions (e.g. Pareto optimal) convergence towards extreme covers (unique community that contains all the nodes /all communities with just one node/etc.) is avoided.
The results obtained by NEO-CDD have been shown to be competitive for both synthetic and real-world dynamic networks. Communities obtained for synthetic networks have a high similarity (shown by NMI) with the known community structure even when the percentage of nodes that change community is as high as 30% and the average internal degree equals the external degree (which creates the most difficult community detection task in a network). For the real-world networks, the ability of NEO-CDD to detect changes in the network data led to good competitive results with clear examples of improved efficiency generated by the proposed approach over existing ones being emphasized in the analysis of the results.
The experimental results confirm the potential of the NEO-CDD approach integrating game theory with extremal optimiza-tion in order to address the dynamic complex problem of finding network communities.
Supporting Information
Appendix S1 (PDF)
Author Contributions
Conceived and designed the experiments: RIL. Performed the experi-ments: RIL. Analyzed the data: RIL. Contributed reagents/materials/ analysis tools: RIL CC AA. Wrote the paper: RIL CC AA.
References
1. Barabasi AL (2002) Linked: The New Science of Networks. Perseus, New York. 2. Watts DJ, Strogatz SH (1998) Collective dynamics of ’small-world’ networks.
Nature 393: 440–442.
3. Mitchell M (2009) Complexity: A Guided Tour. Oxford University Press, USA. 4. Watts D (2003) Six degrees: The Science of a Connected Age. Gardners Books,
New York.
5. Newman MEJ, GirvanM (2004) Finding and evaluating community structure in networks. Physical Review E 69: 026113+.
6. Girvan M, Newman MEJ (2002) Community structure in social and biological networks. Proceedings of the National Academy of Sciences of the USA 99: 7821–7826.
7. Lancichinetti A, Radicchi F, Ramasco JJ, Fortunato S (2011) Finding statistically significant communities in networks. PLoS ONE 6: e18961.
8. Newman MEJ (2006) Modularity and community structure in networks. Proceedings of the National Academy of Sciences 103: 8577–8582. 9. Fortunato S (2010) Community detection in graphs. arXiv.
10. Scott J (2000) Social Network Analysis, A Handbook. Sage Publication, London. 11. Radicchi F, Castellano C, Cecconi F, Loreto V, Parisi D (2004) Defining and identifying communities in networks. Proceedings of the National Academy of Sciences of the United States of America 101: 2658–2663.
12. Pizzuti C (2008) Ga-net: A genetic algorithm for community detection in social networks. In: PPSN. Springer, volume 5199 ofLecture Notes in Computer Science, pp. 1081–1090.
13. Chira C, Gog A (2011) Collaborative community detection in complex networks. In: Corchado E, Kurzynski M, Wozniak M, editors, Hybrid Artificial Intelligent Systems, Springer Berlin / Heidelberg, volume 6678 ofLecture Notes in Computer Science. pp. 380–387.
14. Guimera AL R (2005) Functional cartography of complex metabolic networks. Nature 433: 895–900.
15. Duch J, Arenas A (2005) Community detection in complex networks using extremal optimization. Phys Rev E 72: 027104.
16. Danon L, Daz-Guilera A, Duch J, Arenas A (2005) Comparing community structure identification. Journal of Statistical Mechanics: Theory and Experi-ment 2005: P09008.
17. Tasgin M, Bingol H (2006) Community detection in complex networks using genetic algorithm. arXiv.
18. Sun J, Faloutsos C, Papadimitriou S, Yu PS (2007) Graphscope: parameter-free mining of large timeevolving graphs. In: Proceedings of the 13th ACMSIGKDD international conference on Knowledge discovery and data mining. New York, NY, USA: ACM, KDD ’07, pp. 687–696. doi:10.1145/1281192.1281266. Available: http://doi.acm.org/10.1145/1281192.1281266.
19. Rosvall M, Bergstrom CT (2007) An information-theoretic framework for resolving community structure in complex networks. Proceedings of the National Academy of Sciences 104: 7327–7331.
20. Chakrabarti D, Kumar R, Tomkins A (2006) Evolutionary clustering. In: Proceedings of the 12th ACM SIGKDD international conference on Knowledge discovery and data mining. New York, NY, USA: ACM, KDD ’06, pp. 554– 560. doi:10.1145/1150402.1150467. Available: http://doi.acm.org/10.1145/ 1150402.1150467.
21. Chi Y, Song X, Zhou D, Hino K, Tseng BL (2007) Evolutionary spectral clustering by incorporating temporal smoothness. In: Proceedings of the 13th ACM SIGKDD international conference on Knowledge discovery and data mining. New York, NY, USA: ACM, KDD ’07, pp. 153–162. doi:10.1145/ 1281192.1281212. Available: http://doi.acm.org/10.1145/1281192.1281212. 22. Tang L, Liu H, Zhang J, Nazeri Z (2008) Community evolution in dynamic
multi-mode networks. In: KDD. pp. 677–685.
23. Lin YR, Chi Y, Zhu S, Sundaram H, Tseng BL (2008) Facetnet: a framework for analyzing communities and their evolutions in dynamic networks. In: Proceedings of the 17th international conference on World Wide Web. New York, NY, USA: ACM, WWW ’08, pp. 685–694. doi:10.1145/ 1367497.1367590. Available: http://doi.acm.org/10.1145/1367497.1367590. 24. Kim MS, Han J (2009) A particle-and-density based evolutionary clustering
method for dynamic networks. Proc VLDB Endow 2: 622–633.
535–536. doi:10.1145/1830483.1830580. Available: http://doi.acm.org/10. 1145/1830483.1830580.
27. Asur S, Parthasarathy S, Ucar D (2007) An event-based framework for characterizing the evolutionary behavior of interaction graphs. In: Proceedings of the 13th ACM SIGKDD international conference on Knowledge discovery and data mining. New York, NY, USA: ACM, KDD ’07, pp. 913–921. doi: 10.1145/1281192.1281290. Available: http://doi.acm.org/10.1145/1281192. 1281290.
28. Palla G, Barabasi AL, Vicsek T (2007) Quantifying social group evolution. Nature : 664–667.
29. McKelvey RD, McLennan A (1996) Computation of equilibria in finite games. In: Amman HM, Kendrick DA, Rust J, editors, Handbook of Computational Economics, Elsevier, volume 1 of Handbook of Computational Economics, chapter 2. pp. 87–142.
30. Nash JF (1951) Non-cooperative games. Annals of Mathematics 54: 286–295. 31. Lung RI, Dumitrescu D (2008) Computing nash equilibria by means of
evolutionary computation. Int J of Computers, Communications & Control III: 364–368.
32. Lancichinetti A, Fortunato S, Kertesz J (2009) Detecting the overlapping and hierarchical community structure in complex networks. New Journal of Physics 11: 033015+.
33. Boettcher S, Percus AG (2002) Extremal optimization: an evolutionary local-search algorithm. CoRR cs.NE/0209030.
34. Boettcher S, Percus AG (2001) Optimization with Extremal Dynamics. Physical Review Letters 86: 5211–5214.
35. Lung RI, Mihoc TD, Dumitrescu D (2011) Nash extremal optimization and large cournot games. In: NICSO. pp. 195–203.
36. Lancichinetti A, Fortunato S (2009) Community detection algorithms: A comparative analysis. Phys Rev E 80: 056117.
37. Lancichinetti A (nd) Andrea Lancichinetti’s homepage. Available: http://sites. google.com/site/andrealancichinetti/ mutual. Accessed 2012 June 15. 38. Howell J (2014) Division I-A Historical Scores. Available: http://www.jhowell.
net/cf/scores/ScoresIndex.htm. Accessed 2012 June 15.
39. IEEE Symposium on Visual Analytics Science and Technology (2008) IEEE VAST 2008 Challenge. Available: http://www.cs.umd.edu/hcil/ VASTchallenge08/download/Download.htm. Accessed 2012 June 15. 40. Gong MG, Zhang LJ, Ma JJ, Jiao LC (2012) Community detection in dynamic