Community Detection in Networks using Node
Attributes and Modularity
Yousra Asim
Department of Computer Science COMSATS Institute of Information Technology
Islamabad, Pakistan
Rubina Ghazal
Department of Computer Science COMSATS Institute of Information Technology
Islamabad, Pakistan
Wajeeha Naeem
Department of Computer Science COMSATS Institute of Information TechnologyIslamabad, Pakistan
Abdul Majeed
Ovex Technologies Islamabad, PakistanBasit Raza
Department of Computer Science COMSATS Institute of Information Technology
Islamabad, Pakistan
Ahmad Kamran Malik
Department of Computer Science COMSATS Institute of Information TechnologyIslamabad, Pakistan
Abstract—Community detection in network is of vital importance to find cohesive subgroups. Node attributes can improve the accuracy of community detection when combined with link information in a graph. Community detection using node attributes has not been investigated in detail. To explore the aforementioned idea, we have adopted an approach by modifying the Louvain algorithm. We have proposed Louvain-AND-Attribute (LAA) and Louvain-OR-Louvain-AND-Attribute (LOA) methods to analyze the effect of using node attributes with modularity. We compared this approach with existing community detection approaches using different datasets. We found the performance of both algorithms better than Newman’s Eigenvector method in achieving modularity and relatively good results of gain in modularity in LAA than LOA. We used density, internal and external edge density for the evaluation of quality of detected communities. LOA provided highly dense partitions in the network as compared to Louvain and Eigenvector algorithms and close values to Clauset. Moreover, LOA achieved few numbers of edges between communities.
Keywords—Community Detection; Louvain algorithm; Node attributes; and Modularity
I. INTRODUCTION
Community in a network is the collection of nodes having similar properties or interests or having more connections between them. Detection of a bunch of nodes in a graph aim to identify strongly connected components by separating sparse connections. Several methods and algorithms have been proposed by researchers in this perspective [1], [2]. Some of the proposed core methods for graph clustering in literature can be roughly categorized as follows: A few among them just focus on the configuration (physical arrangement of nodes and their relationships) of graph, for example modularity maximization [3], divisive algorithms; minimum cut method [4] and spectral methods [5]. Some proposed algorithms use properties associated with nodes only i.e. K-SNAP [6], and
others [8-14], [16-21] are a hybrid approach of both node attributes and structural information of graph for detecting dense communities in the graph. Attributes and attribute-based communities can be used in many applications like access control as described in our survey [25].
Modularity has often been used as a quality metric for resulting partitions produced by these methods by comparing the number of links within and between communities. The range of value of modularity is from -1 to 1. The modularity value near 1 shows good quality of partitions and vice-versa. Though optimization of modularity is considered hard w.r.t. computation [7], yet researchers have been trying to achieve reasonable approximate for modularity.
Louvain method [3] provides an efficient and fast way of finding high modularity partitions in a large network. This paper aims at exploring the changes in modularity, the density of communities, internal and external edge density within and between communities when node attributes are combined with Louvain modularity. In this paper, we have applied some modification in Louvain method to find answers of following research questions:
Whether dense communities be detected by using attributes of the nodes?
What is the effect on the density of communities if attributes and modularity both are used to form communities?
What is the difference between the density of communities either using node attributes or modularity?
What is the effect of average internal and external edge density within and between communities?
After providing the related work in Section II, proposed approach is discussed in Section III. Implementation and Results are shown in Section IV and Section V concludes the paper.
II. RELATED WORK
For community detection, both structural information of network and attributes of the nodes are considered in this research. Some relevant families of methods in this context are discussed here. Partitions carried out on the augmented graph in [8,9]. Here, original graph was extended by adding new vertices and new edges for linking original nodes with similar attributes. SA-Cluster approach used random walk distance measure and K-Medoids approach for the measurement of a node‟s closeness and to make communities respectively. Further, entropy and density are used to measure the quality of obtained communities [8]. Ins-Cluster algorithm was suggested to improve the efficiency of SA-Cluster and to make it scalable [9] but these methods are not applicable in the case of the continuous value of attributes. Both of these approaches are related to categorical attributes only. Yang et al. introduced CESNA for the detection of overlapping communities based on edge structure and node attributes [10]. Method proposed for the detection of a subset of nodes that are highly connected and have similar attributes [11]. Louvain method was combined with entropy to make communities of a graph but both types of information were not exploited at the same time [12]. Dang modified modularity of communities based on node attributes and the links between node pairs concurrently [13]. This study is providing modification in Louvain method by proposing two community detection algorithms but non-linked vertices are part of communities. New modularity formula based on inertia named I-Louvain is provided in [14] which try to join most similar elements (relational data and node attributes) rather than focusing on link strengths [15]. Instead of selecting initial nodes randomly, Local Outlier Factor technique is used to select core nodes for making communities [16]. Further, structural similarity and attribute similarity are recognized by K-neighborhood and similarity score. Node similarity by examining common neighbors between two nodes is calculated and Louvain modularity is combined with similarity score for community detection which results in high complexity of proposed method [17].
Node actions, attributes and structural properties of the network are considered collectively [18]. Key nodes in the network are identified by considering similar actions of key nodes with its neighbors and communities are formed around them to divide customers for social marketing. Statistical measures and concepts such as Bayesian approach [19] and Bayesian nonparametric theory [20] has also been used for attribute-based community detection and considering structural properties as well. Graph structure ambiguity is used
by Selection method which is used for switching between structure method and attribute methods for community detection [21]. It is highly dependent on the selected method for structure analysis and also on the depth of a graph. The TABLE I as shown in paper represents a brief overview of available related work of attribute-based community detection. III. THE PROPOSED METHOD FOR COMMUNITY DETECTION
In this work, two methods are provided to find partitions based on node attributes and graph structural properties. For this purpose, we have followed Louvain algorithm‟s strategy of community detection with two modifications. LAA and LOA have combined the gain in the modularity with multiple common user‟s attributes to detect communities in the network. Louvain algorithm considers each node as a community. By comparing each node with its neighbors, it decides to merge communities with a maximum possible gain in modularity. Once it iterates through all the nodes, it will have merged few nodes together and formed some communities. These resultant communities become the new input of the same procedure. It terminates when there is no more possibility of gain in modularity. Our contribution is that we have considered node attributes with the same strategy by ANDing and ORing attributes of nodes with the modularity formula.
The formula of modularity gain ∆Q is [3]:
[ ( ) ] [ ( ) ( ) ] Where is the sum of weights of links inside community C, is the sum of weights of links incident to nodes in community C, is the sum of the weights of the links incident to node i, is the sum of the weights of the links from i to nodes in C and w denotes the sum of the weights of all the links in the network.
For finding the common attributes of resultant community, we are taking the intersection of the attributes of both communities to be merged. For example, if a community Ci with number of attributes is to be merged with a community Cjwith number of attributes then a resultant community Ck will be formed with commonnumber of attributes which can be formulated as follows:
( )
In this paper, nodes are selected to form communities basically on two criteria‟s:
In LAA if nodes satisfy both conditions of having some common attributes i.e. (2) with the community and also maximizing modularity by being the part of the community.
TABLE I. SUMMARY OF AVAILABLE ATTRIBUTE BASED COMMUNITY DETECTION ALGORITHMS
Our idea behind adopting this strategy is that if you want to detect communities of dense connections of nodes having common attributes and also want to consider the effect of neighbor nodes as mentioned in [17] then go for LAA.
Further, if you want to add nodes in communities with common attributes then those nodes can‟t be rejected to be the part of communities which can increase the quality of community by maximizing its modularity and this argument provides a base to adopt LOA.
Paper Ref. Year Contribution for Attribute-based
community detection Technique used Validation methods used
[8] 2009
SA-Cluster algorithm
(Used both node attributes and structural similarities.)
Augmented graph
Neighborhood random walk distance
K-Medoids
Entropy
Density for the quality of clusters.
[9] 2010 Inc-Cluster algorithm
Augmented graph
An incremental algorithm for Random walk distance.
Same as above.
[10] 2013 CESNA algorithm (edge structure and node attributes)
Probabilistic approach
Takes linear time F1 score
[11] 2010 GAMER algorithm
Two fold clusters (used sub-space p and quasi-cliques properties)
F1 value
[12] 2011
Entropy Optimization Algorithm
Augmented Graph Clustering Algorithm
Entropy minimization
Louvain for modularity optimization
Rand Index
Simple Matching Coefficient
Cosine Distance
[13] 2012 SAC1 Algorithm
SAC2 Algorithm
User attributes and Louvain (Composite modularity)
KNN graph with Louvain
Result Comparison with Louvain and attribute based clustering
[14] 2015 I-Louvain algorithm
Inertia-based modularity
Fusion Matric Inertia
Used Modularity, relationship information and attributes.
Normalized Mutual Information (NMI)
[16] 2016 kNAS algorithm
Local Outlier Function
k-neighborhood
Similarity score
Density
Tanimoto Coefficient
[17] 2016 SHC Algorithm Cosine similarity
Louvain algorithm
NMI
Best Q
[18] 2016 aLBCD algorithm Action similarity
Euclidean distance
Accuracy
Adjusted Rand Index
[19] 2016 EM algorithm. Belief propagation Accuracy
Modularity
[20] 2016
NMMA model
Bayesian nonparametric attribute (BNPA) model
Multinomial distribution
MNI
[21] 2013 Selection method
Introduced CNMI to manage noise
Introduced mixing parameter
Modularity
LAA Algorithm:
Input: Graph G (V, E, A) where V is the set of vertices of a graph, E is the set of edges between them. A is the set of attributes that are associated with V.
Output: Niaij clusters where Ni are the number of communities and aij are attributes in each community i. 1: repeat
2: Assign every vertex v of G a unique community number, calculate initial modularity of each v and assign each v attributes to its community
3: while vertices are moving to new communities do 4: for all vertices v of G do
5: Find all neighbor of v
6: Assign v a neighbor community that maximizes modularity function AND having at least one common attribute 7: Update newly detected community attributes 8: end for
9: end while
10: if new modularity > initial modularity then 11: G = the network of found communities of G 12: else
13: break 14: end if 15: until
LOA Algorithm:
Input: Graph G (V, E, A) where V is the set of vertices of a graph, E is the set of edges between them. A is the set of attributes that are associated with V.
Output: Niaij clusters where Ni are the number of communities and aij are attributes in each community i. 1: repeat
2: Assign every vertex v of G a unique community number, calculate initial modularity of each v and assign each v attributes to its community
3: while vertices are moving to new communities do 4: for all vertices v of G do
5: Find all neighbor of v
6: Assign v a neighbor community that maximizes modularity function OR having at least one common attribute 7: Update newly detected community attributes 8: end for
9: end while
10: if new modularity > initial modularity then 11: G = the network of found communities of G 12: else
13: break 14: end if 15: until
We shall use both modified Louvain algorithms to find the answers to our research questions which have been discussed earlier.
IV. IMPLEMENTATION AND RESULTS
We have performed extensive experimentations to compare the performance of our proposed methods LAA and LOA with the state-of-art algorithms Clauset, Newman‟s eigenvector and Louvain on real graph datasets.
A. Experimental Datasets:
Five real world datasets with node attributes and relationships are selected for experimental evaluation in this paper. We used London_gang1, Italy_gang2, Polbooks3 , Adjnoun [22], and Football [23].
London_gang dataset (DS1) represents an un-directed and valued graph about the 54 members of an inner-city street gang of London. Each person‟s information is provided by following attributes: Age, his birthplace where West Africa is represented by 1, Caribbean by 2, the UK by value 3, and East Africa by 4. Other information is available about his Residence, Arrests, Convictions, Prison, and Music.
Italy_gang dataset (DS2) describes 67 Italian gang members, their nationalities, and their connections. Attribute data is gang member‟s country of origin which is coded numerically.
Polbooks dataset (DS3) is the graph provided by V. Krebs which tells details about the US politics books purchased by people on Amazon.com. Books are vertices and edges depict frequent co-purchasing of books by the same customers. Attributes of books consist of values "l", "n", or "c" for specifying them in three categories: "liberal", "neutral", or "conservative". Adjnoun dataset (DS4) contains the network of
common adjective and noun adjacencies for the novel "David Copperfield" by Charles Dickens. Here, vertices show the most regularly used adjectives and nouns in the book. The 0 value of nodes represents adjectives and 1 is used for nouns. Edges are used to denote the pair of words that occur together in the text of the book.
Football dataset (DS5) is the network of American football games between Division IA colleges during regular season Fall 2000. The values are given to nodes from 0 to 11 representing their conference belongings i.e. Atlantic Coast, Big East, Big Ten, Big Twelve, Conference USA, Independents, Mid-American, Mountain West, Pacific Ten, Southeastern, Sun Belt and Western Athletic respectively.B. Comparison Methods for Evaluation
In this paper, three algorithms are selected for comparing results with LAA and LOA methods which consider only structural similarities.
1
https://sites.google.com/site/ucinetsoftware/datasets/covert-networks/londongang
2
https://sites.google.com/site/ucinetsoftware/datasets/covert-networks/italiangangs
Clauset Method [1]: For modularity optimization, Clauset method uses fast greedy approach. In start each node is in its own community and further two communities are merged in order to increase gain in modularity.
Newman’s Eigenvector method[2]: This method uses a divisive approach where each split occurs by maximizing the modularity concerning original network.
Blondel’s method [3]: Third method is a Louvain algorithm which has been previously discussed and modified in Section III.
C. Evaluation Metrics
For the evaluation of the quality of clusters, Density proposed by Cheng is used as described in [16]. The formula of density is as follows:
∑
|{ ( )| ( ) }|
| |
Where is „t‟ number of communities found using several algorithms, are both vertices belonging to same community and E is the total number of edges in a graph. The higher value of density indicates the higher number of connection found in resultant clusters.
Two other measures are also used here, to find the internal and external connectedness of communities as described in [24].
Firstly, Internal Edge Density which is obtained by dividing the number of internal edges of community C by the number of possible internal edges in that cluster. It is very effective to find cohesiveness of a subgraph. It can be formulated as:
⁄
Where represents sum of internal degrees of vertices of C and is the number of vertices in community C.
Secondly, External Edge Density is used which can be calculated by dividing the number of external edges of community C by number of all possible external edges. This measure tells us how the community is embedded in network. It can be calculated by following formula:
⁄
Where is the sum of external edges of community C vertices and is the number of vertices in community C.
In this paper, both proposed algorithms LAA and LOA are compared with the baseline algorithms which use structural information of a graph only for community detection. Comparison of algorithms for all selected datasets for this experimental evaluation on the basis of modularity as explained by modularity gain formula (1) can be seen in Table III. The performance of both of our methods out-performs Eigen-vector [2] in modularity calculations. As far as LAA is concerned, its modularity value remains less than Louvain and
Clauset in three cases (out of 5) and remains better in most of the cases as compared to LOA. LOA performed average as compared to Louvain and Clauset. One point to mention here is that LOA is very close to Louvain when compared to LAA.
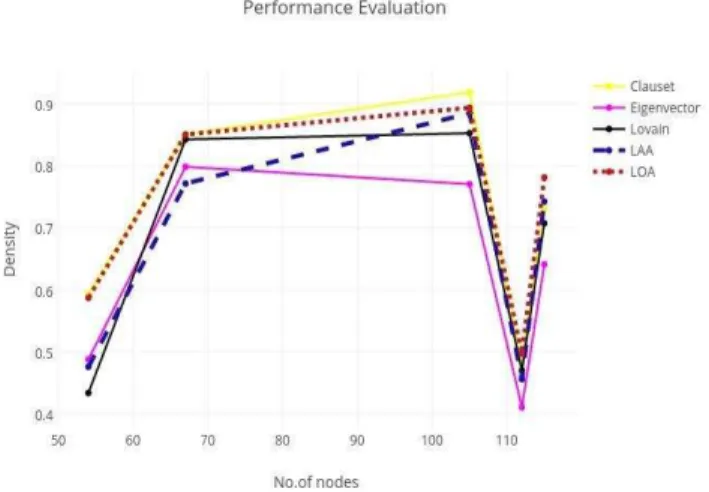
The comparison of communities found by different algorithms in terms of evaluation measure of density explained by (3) is shown in Table II. LOA algorithm has detected dense communities as compared to Louvain and Eigenvector and its performance has been very close to Clauset in detecting dense clusters. Whereas LAA shows average performance in this context. Fig. 1 to Fig. 4 all of them explain our results diagrammatically.
Fig. 1. Performance of algorithms based on Density
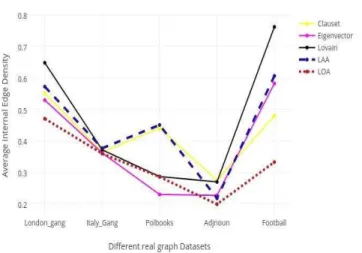
The evaluation measures for the connectedness of subgraph whether it is internal or external as mentioned in (4) and (5) has been shown in Table IV. We have taken average values of internal edge density and external edge density of all communities detected by different algorithms. LAA results for average internal edge density are comparatively better than eigenvector and Clauset methods. LOA results for external edge density are having small values than other methods which are the sign of its good quality of partitions; less number of connection between clusters.
Fig. 3. Comparison based on Internal edge density of clusters
Fig. 4. Comparison based on External edge density of clusters
TABLE II. DENSITY COMPARISON OF ALGORITHMS
Algorithms Density
DS1 DS2 DS3 DS4 DS5
Clauset [1] 0.593 0.85 0.918 0.482 0.730
Eigenvector [2] 0.488 0.798 0.77 0.411 0.641
Louvain [3] 0.434 0.842 0.852 0.47 0.707
LAA 0.476 0.771 0.884 0.456 0.742
LOA 0.587 0.85 0.893 0.498 0.781
As mentioned earlier, we have selected some research questions to answer as a purpose of this experimental study. LAA suggests that detection of dense communities by using attributes is possible, but the density of community cannot always provide us guarantee that density of found clusters will always be high as compared to structure only methods.
If we use either modularity or attributes to form communities then it is likely to have more dense communities than using combined approach. As compared to modularity only approach, combined and split approach can give modularity with minor differences but can give fairly better results than Eigenvector.
By using both node attributes and links information of graph, it is likely to have better results of internal edge density of communities than [1] and [3]. By using any one information (whether node information or link information) it seems to have less number of edges between clusters.
D. Limitation
We have found that results of these methods can be dependent on the order in which nodes are considered for selection relying on their attributes. Further, LAA and LOA approaches are compared with structure-based methods only.
V. CONCLUSION
TABLE III. MODULARITY AND NUMBER OF CLUSTERS COMPARISON
TABLE IV. COMPARISON OF CONNECTEDNESS OF CLUSTERS
Algorithms
London_gang Dataset Italy_gang Dataset Polbooks Dataset Adjnoun Dataset Football Dataset Average
Average Average Average Average Average Average Average Average Average
Clauset algo.[1] 0.552 0.781 0.365 0.038 0.441 0.497 0.275 0.317 0.48 0.198
Eigenvector algo
[2] 0.53 0.615 0.362 0.046 0.23 0.138 0.227 0.713 0.583 0.389
Louvain [3] 0.649 0.977 0.372 0.056 0.287 0.089 0.27 0.387 0.763 0.321
LAA 0.573 0.870 0.377 0.075 0.451 0.21 0.218 0.373 0.607 0.227
LOA 0.471 0.490 0.36 0.039 0.286 0.091 0.199 0.245 0.333 0.114
REFERENCES
[1] A. Clauset, M.E.J. Newman, and C. Moore, “Finding community
structure in very large networks”, Phys. Rev. E- Stat. Nonlinear, Soft Matter Phys. Vol. 70, no.62, Dec 2004.
[2] M.E.J. Newman,” Finding community structure in networks using the
eigenvectors of matrices,” Phys. Rev. E- Stat. Nonlinear, Soft Matter Phys. Vol. 74, no.3, 2006.
[3] V.D. Blondel, J-L. Guillaume, R. Lambiotte, and E. Lefebvre,” Fast
unfolding of communities in large networks,” pp. 1-12, J. Stat Mech, 2008.
[4] G. Flake, R. Tarjan, and K. Tsioutsiouliklis, “Graph clustering and
minimum cut trees,” Internet Math., vol. 1, no. 4, pp. 385-408, 2004.
[5] U. von Luxburg, “A tutorial on spectral clustering,” Stat. Comput., vol.
17, no. 4, pp. 395–416, Dec. 2007.
[6] Y. Tian, R. A. Hankins, and J. M. Patel, “Efficient aggregation for graph
summarization,” in Proc. ACM SIGMOD intl. conf. on Management of data - SIGMOD '08, pp. 567-580, 2008.
[7] U. Brandes, D. Delling, M. Gaertler, R. Gorke, M. Hoefer, Z. Nikoloski,
and D. Wagner, “On Modularity Clustering,” IEEE Trans. Knowl. Data
Eng., vol. 20, no. 2, pp. 172–188, Feb. 2008.
[8] J. X. Yu, “Graph Clustering Based on Structural / Attribute
Similarities”, PVLDB, vol.2,no. 1, pp. 718–729, 2009.
[9] Y. Zhou, H. Cheng, and J. X. Yu, “Clustering Large Attributed Graphs:
An Efficient Incremental Approach,” IEEE Intl. Conf. on Data Mining, Sydney, Australia, pp. 689–698, 2010.
[10] J. Yang, J. McAuley, and J. Leskovec, “Community detection in
networks with node attributes,” Proc. - IEEE Int. Conf. Data Mining, ICDM, Dallas, Texas, pp. 1151–1156, 2013.
[11] S. Gunnemann, I. Farber, B. Boden, and T. Seidl, “Subspace Clustering
Meets Dense Subgraph Mining: A Synthesis of Two Paradigms,” in
2010 IEEE Intl. Conf. on Data Mining, Sydney, Australia, pp. 845–850, 2010.
[12] J. D. Cruz, C. Bothorel, and F. Poulet, “Entropy-based community
detection in augmented social networks,” in 2011 Intl. Conf. on
Computational Aspects of Social Networks (CASoN),Salamanca, Spain, pp. 163–168, 2011.
[13] T. A. Dang and E. Viennet, “Community Detection based on Structural
and Attribute Similarities,” Int. Conf. Digit. Soc., Valancia, Spain, pp. 7–14, 2012.
[14] D. Combe, C. Largeron, M. Géry, and E. Egyed-Zsigmond, “I-Louvain:
An Attributed Graph Clustering Method,” Intelligent Data
Analysis,Saint-Etienne, France, pp. 181–192, 2015.
[15] M. E. J. Newman, “Modularity and community structure in networks.,”
Proc. Natl. Acad. Sci. U. S. A., vol. 103, no. 23, pp. 8577–82, Jun. 2006. [16] M. P. Boobalan, D. Lopez, and X. Z. Gao, "Graph clustering using k-
neighborhood Attribute Structural similarity," Appl. Soft Comput. J., vol. 47, pp. 216-223, 2016.
[17] Xe J., Zhan W., Wang Z. “Hierarchical Community Detection
Algorithm based on node similarity.” Intl. J. of Database Theory and
Application, Vol 9, No. 6, pp. 209-218, 2016.
[18] N. A. Helal, R. M. Ismail, N. L. Badr, and M. G. M. Mostafa, “An Efficient Algorithm for Community Detection in Attributed Social
Networks,” Proc. 10th Intl. Conf.Informatics and Systems - INFOS
’16,Cairo, Egypt, pp. 180–184, 2016.
[19] S. Kataoka, T. Kobayashi, M. Yasuda, and K. Tanaka, “Community
Detection Algorithm Combining Stochastic Block Model and Attribute Data Clustering,”, Proc. Intl. Conf. on Informatics and Systems, Cairo, Egypt, pp. 180-184, 2016.
[20] Y. Chen, X. Wang, J. Bu, B. Tang, and X. Xiang, “Network structure
exploration in networks with node attributes,” Phys. A Stat. Mech. its Appl., vol. 449, pp. 240–253, 2016.
[21] H. Elhadi, G. Agam.,“Structure and Attributes Community Detection:
Comparative Analysis of Composite, Ensemble and Selection Methods.”
(SNA-KDD‟13) Proc. 7th Workshop on Social Network Mining and Analysis, August 11, 2013.
[22] M. E. J. Newman, Finding community structure in networks using the eigenvectors of matrices, Phys.Rev., vol. 73,no. 3,2006.
[23] M. Girvan and M. E. J. Newman, “Community structure in social and
biological networks.,” Proc. Natl. Acad. Sci. U. S. A., vol. 99, no. 12, pp. 7821–6, Jun. 2002.
[24] S. Fortunato and D. Hric, “Community detection in networks: A user
guide,” Phys. Rep., vol. 659, pp. 1–44, 2016.
[25] Y. Asim, A. K. Malik, “A Survey on Access Control Techniques for
Social Networks,” in Innovative Solutions for Access Control
Management, IGI Global, USA, pp. 1–32, 2016.
Algorithms
London_gang Dataset Italy_gang Dataset Polbooks Dataset Adjnoun Dataset Football Dataset
Modularity
Number of clusters
Modularity
Number of clusters
Modularity
Number of clusters
Modularity
Number of clusters
Modularity
Number of clusters
Clauset algo.[1] 0.255 4 0.556 5 0.501 4 0.294 7 0.549 6
Eigenvector algo
[2] 0.225 4 0.535 5 0.467 4 0.242 10 0.492 8
Louvain [3] 0.330 6 0.556 5 0.520 4 0.285 7 0.604 10
LAA 0.324 5 0.556 6 0.482 4 0.279 6 0.457 19