www.biogeosciences.net/8/2507/2011/ doi:10.5194/bg-8-2507-2011
© Author(s) 2011. CC Attribution 3.0 License.
Biogeosciences
Fate of mercury in tree litter during decomposition
A. K. Pokharel and D. Obrist
Desert Research Institute, Division of Atmospheric Sciences, Reno, Nevada, USA Received: 16 February 2011 – Published in Biogeosciences Discuss.: 15 March 2011 Revised: 25 August 2011 – Accepted: 1 September 2011 – Published: 9 September 2011
Abstract. We performed a controlled laboratory litter in-cubation study to assess changes in dry mass, carbon (C) mass and concentration, mercury (Hg) mass and concentra-tion, and stoichiometric relations between elements during decomposition. Twenty-five surface litter samples each, col-lected from four forest stands, were placed in incubation jars open to the atmosphere, and were harvested sequentially at 0, 3, 6, 12, and 18 months. Using a mass balance approach, we observed significant mass losses of Hg during decompo-sition (5 to 23 % of initial mass after 18 months), which we attribute to gaseous losses of Hg to the atmosphere through a gas-permeable filter covering incubation jars. Percentage mass losses of Hg generally were less than observed dry mass and C mass losses (48 to 63 % Hg loss per unit dry mass loss), although one litter type showed similar losses. A field con-trol study using the same litter types exposed at the original collection locations for one year showed that field litter sam-ples were enriched in Hg concentrations by 8 to 64 % com-pared to samples incubated for the same time period in the laboratory, indicating strong additional sorption of Hg in the field likely from atmospheric deposition. Solubility of Hg, assessed by exposure of litter to water upon harvest, was very low (<0.22 ng Hg g−1dry mass) and decreased with increas-ing stage of decomposition for all litter types. Our results in-dicate potentially large gaseous emissions, or re-emissions, of Hg originally associated with plant litter upon decompo-sition. Results also suggest that Hg accumulation in litter and surface layers in the field is driven mainly by additional sorption of Hg, with minor contributions from “internal” ac-cumulation due to preferential loss of C over Hg. Litter types showed highly species-specific differences in Hg levels dur-ing decomposition suggestdur-ing that emissions, retention, and sorption of Hg are dependent on litter type.
Correspondence to:D. Obrist (dobrist@dri.edu)
1 Introduction
There are many open questions about the fate and dynam-ics of Hg bound to leaves and other plant tissues once tissues are exposed in the environment as litter and in the form of soil organic carbon (C), particularly in regards to potential emission or re-emission fluxes to the atmosphere. Since Hg in litter and soils is strongly bound to organic matter (Aastrup et al., 1991; Meili, 1991; Grigal, 2003; Obrist et al., 2009), its behavior and mobility is also associated with the dynam-ics of C (Mierle and Ingram, 1991; Johansson and Iverfeldt, 1994; Joslin, 1994; Driscoll et al., 1995; Lee et al., 1998; Kolka et al., 1999; Grigal, 2002). Organic C also is subject to mineralization, however, and a hypothesized fate of Hg contained in organic C includes release from the matrix as C decomposes (Grigal, 2003; Obrist, 2007). A few recent studies indicate correlations between CO2and Hg0emission
fluxes from soils, indicative of some gaseous losses of Hg in volatile form upon C mineralization (Wickland et al., 2006; Fritsche et al., 2008a; Obrist et al., 2010), and it has been proposed that Hg losses from soils may be in the range of a few percent of total Hg originally bound to organic C frac-tions (Obrist et al., 2010).
Exposed surface litter and organic C pools in the field strongly bind atmospheric Hg deposition, thereby reducing input and transfer of atmospheric Hg deposition to water bodies (Harris et al., 2007; Graydon et al., 2009). As a result, field observations generally show strong Hg enhancement in surface litter and soil organic C fractions, greatly exceed-ing Hg concentrations of the original plant detritus inputs (Lindberg and Harris, 1974; Nater and Grigal, 1992; Hall and St. Louis, 2004; Demers et al., 2007; Tsui et al., 2008; Obrist et al., 2011). Continued sorption of atmospheric Hg to litter and soil organic C pools in the field, however, com-plicates the study of fate of Hg associated with litter and soil organic C, as newly sorbed Hg is difficult to separate from Hg originally associated with plant tissues.
Our goal was to address the fate of Hg originally bound to forest litter during decomposition under tightly controlled environmental conditions in which we minimized additional Hg sorption from the atmosphere and from other sources. A set of 25 litter samples each of four different forest litter types were incubated for time periods of 0, 3, 6, 12, and 18 months. After each period, litter was harvested and analyzed for total Hg, soluble Hg, C, N, and dry mass to assess concentration changes and respective mass losses through time. In a field control component, the same litter samples were exposed in surface litter horizons at respective collection sites using lit-ter bags for a period of 12 months. The hypotheses of this study were that (1) during laboratory decomposition, Hg as-sociated with forest floor litter is subject to gaseous losses as evident by a mass loss of Hg through time; (2) dry mass and C mass of litter are preferentially lost compared to Hg mass, resulting in an increase in Hg concentrations and Hg/C ratio through time; (3) Hg concentration and Hg/C ratio of field control samples will be higher after one year of decom-position compared to samples exposed in the laboratory,
re-flecting additional sorption of Hg in the field (e.g., from at-mospheric deposition) ; and (4) Hg bound to litter also may be subject to mobilization in soluble form during decompo-sition.
2 Materials and methods 2.1 Litter collection
We collected fresh surface litter from Oi litter horizons from four different US forest sites: a mixed deciduous forest near Bartlett, New Hampshire; an aspen stand near Reno, Nevada; a pine forest in the Sierra Nevada Mountains near Georgetown, California; and a blue oak forest in the Sierra Nevada foothills near Marysville, California. We will re-fer to these four difre-ferent litter types as species through-out the text. The deciduous forest in Bartlett is located at 44◦03′N, and 71◦17′W, at an elevation of 94 m, with
an-nual precipitation of 1270 mm and mean anan-nual temperature of 4.5◦C. Dominant tree species comprising surface litter at the Bartlett site are American beech(Fagus grandifolia), yellow birch(Betula alleghaniensis), sugar maple(Acer sac-charum), and eastern hemlock(Tsuga Canadensis). The as-pen stand near Reno, located at a latitude of 39◦23′N,
lon-gitude of 119◦50′W, and at an elevation of 1821 m, shows
241 mm of annual precipitation and a mean annual temper-ature of 10.5◦C. The dominant aspen species here is Pop-ulus tremuloides. The pine forest near Georgetown, Cali-fornia, is located at 38◦54′N and 120◦39′W, at an elevation
of 1302 m, and experiences annual precipitation averaging 1660 mm and a mean annual temperature of 13.7◦C.
Domi-nant tree species include ponderosa pine(Pinus ponderosa)
and sugar pine(Pinus lambertiana), with lesser contributions of white fir (Abies concolor), incense cedar (Calocedrus de-currens), Douglas fir(Pseudotsuga menziesii), and Califor-nia black oak(Quercus kelloggii). The oak forest in Cali-fornia, dominated by blue oak(Quercus douglasii), is situ-ated at 39◦15′N, and 121◦17′W, is at an elevation of 193 m and shows annual precipitation of 775 mm and a mean annual temperature of 16.9◦C. Other species on the site include
in-terior live oak, (Q. wislizenii) and foothill pine (Pinus sabini-ana).
2.2 Controlled laboratory incubation study
For the controlled laboratory incubation study, we prepared 100 glass jars of 960 ml volume (wide-mouth, clear USP Type III soda-lime glass with PTFE-lined lids). All glass jars were cleaned with chelating soap and dilute nitric acid (5 %), dried, and weighed. A 2.7 cm diameter hole was drilled in the lids of the jars and covered with a Teflon® filter membrane (pore size 0.2 µm). This allowed air exchange between the jars and the atmosphere, and, at the same time, avoided de-position of dust (including particulate-bound Hg) and likely minimized any transfer and deposition of reactive gaseous Hg to jars. Each of 25 glass jars was filled with homoge-nized litter samples from the four sites, with an initial start-ing weight (fresh mass) of 30 g of litter (15 g for blue oak litter). Immediately after sample preparation, litter from the first five of the 25 replicate jars was harvested for determi-nation of dry mass and initial C, N, and Hg concentrations (i.e., time: t=0 month). The 20 remaining jars of each species were placed in an environmentally-controlled cham-ber at the Desert Research Institute (EcoPODS) at a constant temperature of 25◦C throughout the experiment. Walls and the ceiling of the chamber were covered by black cloth to allow decomposition under dark conditions. Five replicate glass jars from each species were harvested after 3, 6, 12, and 18 months of incubation (i.e., 4 species×5 harvest times×5 replications=100 incubation samples total), and analyzed for dry mass, C, N, and Hg concentration as described below. Litter samples were kept moist by additions of ultra-purified Millipore water (15 ml each) every three weeks. We assured that during harvest, all material from the jars were carefully removed, including small litter fractions that were washed to the bottom of the incubation jars.
We calculated total mass of the respective elements through time. Harvested litter samples also were used for determination of Hg solubility: ultra-purified Millipore wa-ter (500 g) was added to half of the harvested litwa-ter samples, and after one hour of exposure in water, 26.5 ml aliquots of solution were extracted for measurement of soluble Hg. Aliquots were filtered with 0.45 µm pore size filters (PTFE membrane; PP housing), preserved by adding 1 % concen-trated hydrochloric acid, and stored at 5◦C until analysis.
2.3 Field study
We conducted a field component using the same litter species to assess changes of Hg, C, and N concentrations plus their stoichiometric relationships after one year of decomposition. Samples for field decomposition were packed in mash bags made from nylon screen. All bags were washed prior to use with a chelating soap bath for 48 h and were tested for Hg concentrations, which averaged 15.0±7.0 µg Hg kg−1. Hence, mash Hg concentrations were lower than all litter concentrations observed (see results), and hence litter bags were unlikely a significant source of Hg to litter in the field.
We measured litter concentrations of C, N, and Hg prior to field exposure. Litter bags were exposed in the field for one full year through placement in the surface Oi litter horizons of the respective collection sites. Hg, C, and N tions were re-measured after collection to assess concentra-tion changes. Mass balances of litter bags were not quanti-fied in the field study due to potential losses of small litter fractions from bags during field exposure and transport. It is important to note that environmental conditions at the field sites differed from those of the controlled laboratory incuba-tion study, including temperatures, rainfall patterns, relative humidities, and solar radiation exposures.
2.4 Sample analyses for C, N, total Hg, and soluble Hg
Upon harvests, litter samples were freeze dried using a freeze dryer (Model Micro Modulyo-115, Thermo Scien-tific, Waltham, MA, USA) for 48 h. After freeze drying, dry weights of each litter sample contained in glass jars were determined. Half of the well-homogenized litter sam-ples were then milled using stainless steel coffee mills and kept frozen until analysis, while the other portions were used for determination of soluble Hg. Milled samples were an-alyzed for total Hg using a Model MA-2000 Total Mer-cury Analyzer (Nippon Inc., Takatsuki, Japan) according to US EPA Method 7473. The analyzer was calibrated us-ing 0.1 ppm and 0.01 ppm Hg stock solutions made from 1000 ppm HgCl2standard in 0.001 % L-cysteine solution
ac-cording to the manufacturer guidelines. National Institute of Standards and Technology (NIST) solid standard refer-ence materials (# 1575: Pine leaves: 39.9 µg Hg kg−1; and # 1515: Apple Leaves: 44.4 µg Hg kg−1)were measured at the beginning of each analytical run and repeated after ev-ery six samples. When analysis of NIST standards deviated more than 5 % from their values, the analyzer was recali-brated and all samples were re-run. Across all sample analy-ses, NIST standard samples averaged 39.7±1.2 µg Hg kg−1
(mean±standard deviation;n=27; 99 % recovery) for pine leaves, and 44.8±0.9 µg Hg kg−1 (mean±standard
devia-tion; n=41; 101 % recovery) for apple leaves. All sam-ples were analyzed in duplicates, and analyses were repeated when the coefficient of variability of samples exceeded 10 %. Total C and N in litter samples were analyzed using a Leco Turspec carbon/nitrogen analyzer (LECO, St. Joseph, Michi-gan, USA) at the Soil Forage and Water Analysis Labora-tory at Oklahoma State University (http://www.soiltesting. okstate.edu/), which guarantees accuracy and precision of test results through daily analysis of quality control samples. All instruments used for analysis were calibrated with certi-fied standards and maintained in accordance with specifica-tion. Using standards every 10 samples, specific quality con-trol for C/N analysis included frequent blank test and sample checks.
Table 1.Dry mass, C mass, C concentration, Hg concentration, Hg mass, Hg/C ratio, N mass, N concentration, C/N ratio, and Hg/N ratio of laboratory samples.
Time in Dry mass (g) C mass (g) C concentration (%)
months
Mixed Aspen Pine Oak Mixed Aspen Pine Oak Mixed Aspen Pine Oak
deciduous deciduous deciduous
0 24.1±0.4 23.9±0.3 21.3±0.6 11.1±1.2 11.7±0.3 11.3±1.0 10.8±0.3 5.3±0.6 48.6±0.7 47.3±0.5 50.8±0.5 47.9±0.1 3 22.2±0.5 22.5±0.9 20.9±0.4 10.6±1.1 11.0±0.1 10.2±0.4 10.6±0.3 5.1±0.6 49.7±0.5 45.5±0.8 50.7±0.4 48.2±0.6 6 21.8±0.5 21.3±0.4 20.6±0.4 10.4±1.2 10.9±0.2 10.2±0.2 9.3±0.2 4.4±0.5 50.3±0.4 47.7±0.2 45.0±0.5 42.5±0.6 12 19.9±0.5 16.8±1.0 19.9±0.5 9.5±0.6 9.5±0.2 7.7±0.5 9.7±0.2 4.4±0.3 47.7±0.4 45.7±0.3 48.9±0.3 46.2±0.4 18 19.4±0.3 16.4±0.9 19.7±0.6 8.6±0.7 9.6±0.2 7.5±0.5 10.1±0.3 4.1±0.3 49.6±0.4 45.9±0.6 51.3±0.5 47.4±0.8
Hg concentration (µg kg−1) Hg mass (ng) Hg/C ratio (µg kg−1C)
Mixed Aspen Pine Oak Mixed Aspen Pine Oak Mixed Aspen Pine Oak
deciduous deciduous deciduous
0 32.4±4.2 50.2±1.6 39.3±2.5 40.7±1.5 782±97 1198±30 834±57 452±48 66.8±8.9 106.1±3.3 77.4±5.6 84.9±3.3 3 35.5±1.7 54.6±1.5 37.9±3.0 40.8±1.2 788±53 1228±52 792±61 430±37 71.5±4.0 119.9±5.0 74.8±6.3 84.8±2.6 6 35.0±3.4 55.1±2.9 38.4±2.3 36.1±1.8 764±71 1174±44 790±46 378±55 69.7±7.3 115.6±6.3 85.3±5.0 84.9±3.9 12 34.9±2.1 61.8±3.1 37.9±1.8 39.0±2.7 700±62 1036±52 754±42 372±24 73.2±5.0 135.3±7.4 77.5±3.7 84.4±5.2 18 35.5±1.6 62.1±5.0 40.3±3.8 40.3±3.8 690±26 1016±31 792±84 348±36 71.7±3.5 135.6±12.2 78.6±7.5 84.9±9.0
N mass (g) N concentration (%) C/N ratio
Mixed Aspen Pine Oak Mixed Aspen Pine Oak Mixed Aspen Pine Oak
deciduous deciduous deciduous
0 0.13±0.01 0.16±0.013 0.09±0.01 0.09±0.01 0.56±0.05 0.67±0.06 0.45±0.03 0.81±0.05 87.8±8.7 70.6±5.7 113.3±6.7 59.2±3.4 3 0.14±0.01 0.17±0.013 0.08±0.01 0.09±0.01 0.64±0.03 0.74±0.04 0.39±0.03 0.83±0.09 77.6±4.4 62.1±4.5 130.8±8.8 58.7±6.9 6 0.12±0.01 0.16±0.012 0.08±0.01 0.08±0.01 0.56±0.04 0.77±0.07 0.41±0.05 0.80±0.05 89.4±7.7 62.4±5.2 111.2±13.8 53.0±4.1 12 0.13±0.02 0.17±0.012 0.09±0.00 0.08±0.01 0.65±0.06 1.00±0.09 0.43±0.02 0.86±0.06 73.8±6.5 45.9±3.9 114.4±5.3 54.1±3.5 18 0.21±0.01 0.23±0.01 0.16±0.01 0.12±0.02 1.07±0.03 1.40±0.12 0.83±0.05 1.35±0.19 46.2±1.4 33.2±3.0 61.8±3.3 35.9±5.8
Hg/N ratio (µg kg−1N)
Mixed Aspen Pine Oak
deciduous
0 5809±378 7481±592 8754±701 5027±335 3 5542±340 7434±364 9749±582 4963±464 6 6195±383 7188±168 9434±632 4498±348 12 5386±337 6193±215 8850±375 4552±307 18 3313±185 4475±187 4836±220 3019±334
in Water using dual stage gold pre-concentration. We used a Tekran 2600 Mercury Analyzer (Tekran Inc., Toronto, Canada). Bromine monochloride (0.5 % BrCl) was added to each sample 12 h prior to analysis for sample digestion. Immediately prior to sample analysis, we added 0.25 % hy-droxylamine hydrochloride (HH) to samples to ensure full destruction of the free halogens. We used a 3 % solution of freshly prepared stannous chloride, purged with a slow flow of ultra-high purity (UHP) argon at 20 ml min−1, to
re-duce Hg in samples to gaseous Hg, which was separated by a liquid-gas separator and loaded on gold traps of the an-alyzer. After thermal desorption, Hg was analyzed using atomic fluorescence spectroscopy. The analyzer was cali-brated with standards of 0.5, 5, 10, 25, and 50 ppt of Hg in solution of 0.5 % BrCl, and 0.25 % HH. Quality control included three calibration blanks (consisting of 0.5 % BrCl and 0.25 % HH reagent), Ongoing Precision and Recovery (OPR) of 5 ppt Hg after every six samples (average recovery 97±9 %; n=21), and matrix spikes of at least two sam-ples per analytical run. Detection limit of the system was estimated at<0.5 ppt, based on 3×standard deviation of the reagent blanks.
2.5 Statistical analyses
All numbers in text, figures, and tables (Table 1) are shown as mean±1 standard deviation of five replicate samples for the laboratory study, and mean±1 standard deviation of 15 replicate samples for the field study. Statistical analyses of laboratory samples (Table 2) were performed using anal-ysis of variance (ANOVA) and Bonferroni post-hoc compar-ison tests to analyze for statistical effects of variables:Time,
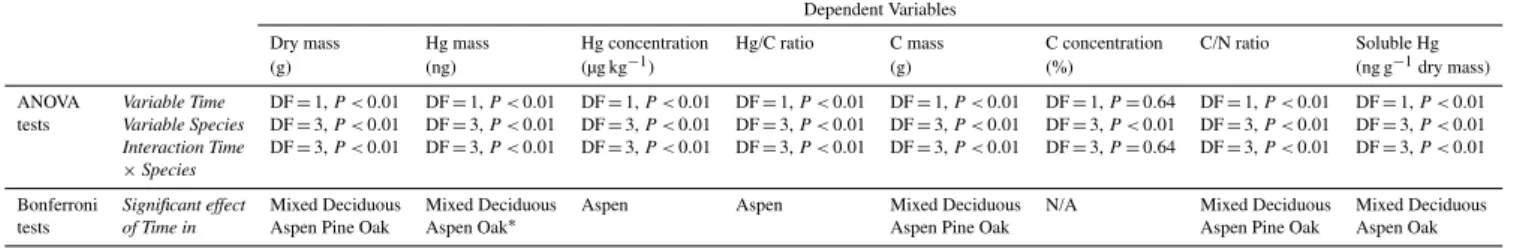
Table 2.Results of statistical Analysis Of Variance (ANOVA) and Bonferroni post-hoc tests to test for effects of incubation time (continuous variable), species (categorical variable), and interactions for the dependent variables: dry mass, Hg mass, Hg concentration, Hg/C ratio, C mass, C concentration, C/N ratio, N mass, N concentration, and soluble Hg.
Dependent Variables
Dry mass Hg mass Hg concentration Hg/C ratio C mass C concentration C/N ratio Soluble Hg
(g) (ng) (µg kg−1) (g) (%) (ng g−1dry mass)
ANOVA Variable Time DF=1,P <0.01 DF=1,P <0.01 DF=1,P <0.01 DF=1,P <0.01 DF=1,P <0.01 DF=1,P=0.64 DF=1,P <0.01 DF=1,P <0.01 tests Variable Species DF=3,P <0.01 DF=3,P <0.01 DF=3,P <0.01 DF=3,P <0.01 DF=3,P <0.01 DF=3,P <0.01 DF=3,P <0.01 DF=3,P <0.01 Interaction Time DF=3,P <0.01 DF=3,P <0.01 DF=3,P <0.01 DF=3,P <0.01 DF=3,P <0.01 DF=3,P=0.64 DF=3,P <0.01 DF=3,P <0.01
×Species
Bonferroni Significant effect Mixed Deciduous Mixed Deciduous Aspen Aspen Mixed Deciduous N/A Mixed Deciduous Mixed Deciduous
tests of Time in Aspen Pine Oak Aspen Oak∗ Aspen Pine Oak Aspen Pine Oak Aspen Oak
∗Significant post-hoc test at significance level=0.10, but not at 0.05.
College Station, Texas, USA). We considered statistically significant effects whenP-values were lower than 0.05.
3 Results
3.1 Laboratory decomposition study: Hg, C, and N concentration and mass changes
At the start of the experiment, initial litter dry mass across all jars were 24.1±0.4 g in mixed deciduous litter, 23.9±
0.3 g in aspen litter, 21.3±0.6 g in pine needle litter, and 11.1±1.2 g in oak leaves (Fig. 1; Table 1). In all four lit-ter species, changes in dry mass showed relatively consis-tent temporal trends with increasing time of incubation. Pine needle litter showed small mass losses with each subsequent time interval, averaging 2, 3, 7, and 8 % loss of the initial (i.e., 0 month) dry mass after 3, 6, 12, and 18 months of incubation, respectively. All other litter types showed more substantial mass losses with time: dry mass decreased by 8, 10, 17, and 19 % in mixed deciduous litter and by 6, 11, 30, and 31 % in aspen litter. We also observed similar mass re-ductions in oak litter accounting for 5, 7, 15, and 22 % loss of initial mass. ANOVA tests (Table 2) including data of all litter species showed significant effects ofTime,Species, and
Time×Speciesinteractions on dry mass, indicative of sig-nificant mass losses in time across all samples. Bonferroni post-hoc tests following the ANOVA showed that a signifi-cant effect ofTimewas evident in all four litter species.
Associated with dry mass losses, we observed C mass losses (Fig. 1; Table 1) with increasing time of incubation, and C mass losses were in a similar range as those observed for dry mass. Mass losses of C, however, were less consis-tent in time, likely due to sample variability of C analyses. Similar to dry mass, ANOVA tests showed significant effects ofTime,Species, andTime×Speciesinteractions on C mass across all litter samples, and Bonferroni post-hoc tests also showed that the significant effect ofTimeoccurred in all four litter species.
The similar behavior of dry mass and C mass losses was due to relatively constant C concentrations in time (Fig. 1; Table 1). Small, inconsistent, and not statistically significant changes in C concentrations by the end of the experiment (af-ter 18 months) included an increase of 2 % and 1 % in mixed deciduous and pine litter as well as a decrease by 3 % and 1 % in aspen and oak litter. ANOVA tests on C concentra-tions showed a significant effect ofSpecies, but no significant effect ofTime.
Initial Hg concentrations (i.e., 0 month; Fig. 2; Table 1) in litter samples averaged 32.4±4.2 µg kg−1 in mixed de-ciduous litter, 50.2±1.6 µg kg−1 in aspen litter, 39.3±
2.5 µg kg−1in pine litter, and 40.7±1.5 µg kg−1 in oak lit-ter. Using all data, ANOVA tests showed statistically signifi-cant effects ofTime,Species, andTime×Speciesinteraction on Hg concentration. Changes in Hg concentrations, how-ever, were highly species-specific: Bonferroni post-hoc tests showed that theTimeeffect was driven solely by one species, aspen litter, which showed a strong increase in Hg concen-tration through time. All other species showed no significant
Timeeffects on Hg concentrations using Bonferroni post-hoc tests. Hg concentration in aspen litter increased by 24 % af-ter 18 months of incubation, but Hg concentrations remained within 1 to 10 % of the original concentrations for the other three species.
A Dry mass
0 5 10 15 20 25 30
Mixed deciduous
Aspen Pine Oak
Dr
y
ma
ss
(g
)
Litter Species
t=0 month
t=3 months
t=6 months
t=12 months
t=18 months
Ptime< 0.05 P
time< 0.05 P time< 0.05
Ptime< 0.05
B C mass
0 2 4 6 8 10 12 14
Mixed deciduous
Aspen Pine Oak
Tot
al
C
ar
bo
n
m
ass
(g
)
Litter Species
Ptime< 0.05 P
time< 0.05 P time< 0.05
Ptime< 0.05
C C concentration
0 10 20 30 40 50 60
Mixed deciduous
Aspen Pine Oak
C
ar
bo
n
con
cen
tr
ati
on
(%)
Litter Species
Ptime= n.s. Ptime= n.s. Ptime= n.s. Ptime= n.s.
Fig. 1. Development of dry mass, carbon (C) mass, and C centrations throughout 18 months of litter decomposition in a con-trolled laboratory study. Bars represent means±standard devia-tions of five replicate samples. P-values are effects of Timefor individual species based on Bonferroni post-hoc analyses (Table 2).
deciduous litter, aspen litter, and to a smaller degree in oak litter (at the 10 % significance level). NoTimeeffect, based on Bonferroni post-hoc tests, was observed for Hg mass in pine litter.
3.2 Stoichiometric relationships between Hg, C, and N
Hg/C ratios showed only minor changes during the 18 months of laboratory decomposition in most litter species (Fig. 2; Table 1). Overall, ANOVA tests showed significant effects ofTime,Species, andTime×Speciesinteraction on Hg/C ratios. As with Hg concentrations, the significant in-crease in Hg/C ratios, however, was driven entirely by aspen as indicated by Bonferroni post-hoc tests, while no signifi-cantTimeeffect was evident for the other three litter species. In aspen, Hg/C ratios increased from 106.1±3.3 µg kg−1C
at the start of the experiment to 135.6±12.2 µg kg−1C at the
end of the experiment.
In regards to C/N ratios, ANOVA tests showed significant effects ofTime,Species, andTime×Speciesinteraction, in support of decreases in C/N ratios in time across all labora-tory samples. Post-hoc Bonferroni tests showed that theTime
effects were significant in all four litter species, although oc-curring to various degrees. Regression analyses between Hg concentrations and C/N ratios in laboratory samples (Fig. 3c) showed significant increase in Hg concentrations with de-creasing C/N ratios in aspen and pine litter samples (sig-nificant negative slope of linear regression; r2=0.77 and r2=0.22, respectively), while the two other litter species showed no significant regression slopes.
3.3 Field litter decomposition patterns
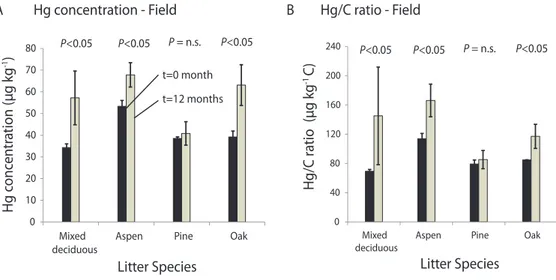
Paired Student t-tests of Hg concentrations of samples prior to and after exposure for one full year in the field showed that Hg concentration increased significantly across all species. When each species was analyzed independently, three of four showed significant Hg concentration increases after field ex-posure, and only in pine litter was the effect not statistically significant. Increases in Hg concentrations during the one-year field exposure (i.e., from timet=0 month to timet=12 months, Fig. 3a) accounted for 23 µg kg−1in mixed
decidu-ous (+67 %), 15 µg kg−1in aspen (+28 %), and 21 µg kg−1in
0 10 20 30 40 50 60 70 80
Mixed deciduous
Aspen Pine Oak
Hg
c
o
n
cen
tr
at
io
n
(µ
g
kg
-1)
Litter Species
t=0 month t=3 months t=6 months t=12 months t=18 months Ptime= n.s.
A Hg concentration
Ptime< 0.05
Ptime= n.s. Ptime= n.s.
0 200 400 600 800 1000 1200 1400
Mixed deciduous
Aspen Pine Oak
Tot
al
L
it
te
r
Hg
ma
ss
(ng)
Litter Species
B Hg mass
Ptime< 0.05
Ptime< 0.05
Ptime< 0.10
Ptime= n.s.
C Hg/ C ratio
0 20 40 60 80 100 120 140 160
Mixed deciduous
Aspen Pine Oak
Hg
/C
ra
ti
o
(µ
g
kg
-1 C
)
Litter Species Ptime= n.s.
Ptime= n.s. Ptime= n.s.
Ptime< 0.05
Fig. 2.Development of Hg concentration, Hg mass, and Hg/C ratio throughout the 18 months of litter decomposition in the controlled laboratory study. Bars represent means±standard deviations of five replicate samples. P-values are effects ofTimefor individual species based on Bonferroni post-hoc analyses (Table 2).
(see discussion below). Figure 3c shows that for field sam-ples of mixed deciduous and oak litter, Hg concentrations fall above the regression line between Hg concentrations and C/N ratios of laboratory samples, indicating that even when adjusted for differences in decomposition rates (i.e., C/N ra-tios), field samples show enhanced Hg levels compared to laboratory samples. However, in aspen and pine litter, data points for field and laboratory samples follow a similar re-gression line between Hg and C/N ratios.
As with Hg concentrations, Hg/C ratios of field samples were significantly enriched after field exposure (Fig. 3b), and individual analysis showed that the increase was significant in all species but pine. C/N levels decreased significantly during exposure in the field in all litter species, with the strongest decrease observed in mixed deciduous, aspen, pine, and to a lesser degree in oak. C/N ratios of field samples after 12 months of exposure were significantly lower than C/N ra-tios observed in laboratory samples after 12 months of expo-sure, with field C/N ratios decreased by 23 to 42 % compared to those exposed in the laboratory (Fig. 3c; Table 1). 3.4 Solubility of Hg in decomposing litter
Concentrations of soluble Hg – measured during one-hour exposure of half the harvested samples to 500 ml of Hg-free water and standardized to the amount of dry mass – were highly variable across different litter species (Fig. 4). For example, the initial amount of soluble Hg per unit of dry lit-ter mass accounted for 0.22±0.02 ng g−1 in oak litter, but
only for 0.07±0.01 ng g−1in pine litter. The amount of
sol-uble Hg generally decreased in all species throughout the ex-periment (Fig. 4). After 18 months, concentrations of solu-ble Hg were negligisolu-ble and mainly below the detection limit of the analyzer (∼0.5 ng l−1, based on three times standard deviation of reagent blanks), except in mixed deciduous lit-ter. Overall, ANOVA tests showed significant effects ofTime
andSpecieson soluble Hg per unit of dry litter mass (both when only samples above the detection limit were consid-ered and when samples below the detection limit were con-sidered as zero values; Table 2). ANOVA tests indicated no
Time×Speciesinteraction when only samples above the de-tection limits were considered, but indicated species-specific responses when all samples were considered (i.e., samples below detection limit set as zero), with Post-hoc Bonferroni tests showing significantTime effects in mixed deciduous, aspen, and oak litter, but not in pine litter (Table 2).
4 Discussion
4.1 Changes in dry mass as well as concentration and mass changes of C and N
C Hg concentration versus C/N ratio - Laboratory and Field
A Hg concentration - Field B Hg/C ratio - Field
0 10 20 30 40 50 60 70 80
Mixed deciduous
Aspen Pine Oak
Litter Species
t=0 month t=12 months
P<0.05
0 40 80 120 160 200 240
Mixed deciduous
Aspen Pine Oak
Litter Species
P<0.05 P<0.05 P = n.s.
Hg
conc
e
n
tr
at
ion
(µg kg
-1)
Hg/C r
atio
(
µg kg
-1 C
) P
<0.05
P<0.05 P<0.05 P = n.s.
Mixed Deciduous Litter Aspen Litter
Pine Litter Oak Litter
0 10 20 30 40 50 60 70 80 90
0 10 20 30 40 50 60 70 80 90
0 20 40 60 80 100 120 0 20 40 60 80
r2 = 0.77
P < 0.05 P = n.s.
r2 = 0.22
P < 0.05 P = n.s.
0 10 20 30 40 50 60
0 20 40 60 80 100 120 140 160 0 10 20 30 40 50 60 70 80
0 20 40 60 80
C/N ratio
t = 0 month
t = 3 month
t = 6 month
t = 12 month
t = 18 month
t = 12 month
Laboratory
Field
Hg
conc
e
n
tr
at
ion
(µg kg
-1)
Fig. 3. (A): Hg concentrations of field samples prior to (t=0 month) and after (t=12 months) one year of exposure in the field. Bars represent means±standard deviations of 15 replicate samples. P-values are based on paired t-tests. (B): same as panel A for Hg/C ratios. (C): scatter plots of Hg concentration and C/N ratios of all litter samples in the laboratory decomposition study (black symbols). Samples at different harvest times are marked with different symbols. Regression line marks linear trendline (solid line whenP <0.05) between Hg and C/N ratios in laboratory samples. Red symbols are Hg concentrations, and C/N ratios of samples exposed in the field. In two species, points fall clearly above trendlines for laboratory samples.
18 months) yielded substantial and detectable mass losses during the laboratory incubation study. Rates of mass de-creases were different among litter species, and aspen leaf litter showed the strongest dry mass decrease (31 % after
-0.05 0.00 0.05 0.10 0.15 0.20 0.25 0.30
Mixed deciduous
Aspen Pine Oak
S
ol
u
b
le
Hg
(ng Hg
g
-1 dr
y mass)
Litter Species
t=0 month
t=3 months
t=6 months
t=12 months
Ptime<0.05
Soluble Hg
t=18 months
< d
.l.
< d
.l.
< d
.l.
Ptime<0.05 Ptime<0.05
Ptime= n.s.
Fig. 4. Development of soluble Hg per unit dry mass throughout the 18 months of litter decomposition in the controlled laboratory study. Bars represent means±standard deviations of five replicate samples.P-values are effects ofTimefor individual species based on Bonferroni post-hoc analyses (Table 2). <d.l. refers to values below the limit of detection.
coniferous litter (Kaneko and Salamanca, 1999; Hall and St. Louis, 2004), while others found the opposite (Demers et al., 2007). Some studies observed inconsistent trends or time-dependent trends, e.g., where initial differences be-tween litter species disappeared during longer time periods (Moore et al., 1999; Sundarapandian and Swamy, 1999; Prescott et al., 2000). In general, these field studies showed higher mass losses (e.g., up to full mass loss after one year; Sundarapandian and Swamy, 1999) than we observed dur-ing our controlled laboratory study. Possible reasons for the slower decomposition rates in the laboratory study include an artificial environment without presence of underlying soil substrates, which may have reduced diversity and mass of microbial communities (Couteaux et al., 1995). Although we regularly watered samples every 2–3 weeks, the moisture conditions for mineralization (Horner et al., 1988) may have been unfavorable compared to a field environment as well. Associated with dry mass losses, we observed similar losses of C mass, although C mass losses were less consistent in time. C concentrations did not significantly change through-out the experiment, and remained within 97 to 102 % of the original C levels after 18 months of decomposition.
Lower C/N ratios in the field control samples (Fig. 3c) compared to laboratory samples after one year of decomposi-tion suggest that litter samples experienced higher decompo-sition rates under field conditions than during laboratory in-cubation. C/N ratios reflect the degree of decomposition with high C/N ratios associated with fresh and undecomposed or-ganic C, while lower C/N ratios are indicative of older and more decomposed fractions (Paul and Clark, 1989). In our
study, the highest C/N ratios were observed in pine litter. This is similar to other studies that reported higher C/N ra-tios of coniferous trees over deciduous (Finzi et al., 1998; Smolander et al., 2005), and may be linked to its correspond-ingly slow decomposition rate and low N availability. (Web-ster and Benfield, 1986; Bryant et al., 1998).
4.2 Concentration and mass changes of Hg plus stoichiometric relationships to C and N
Across all litter types, litter incubated under controlled laboratory conditions exhibited significant Hg mass losses through time (Fig. 2), with losses after 18 months ranging from 5 to 23 % of the initial Hg mass present at the start of the experiment. We ensured that all dry mass was harvested from sample jars and was well homogenized prior to analysis; even if small fractions of dry mass were lost during harvests, any losses would have been constant throughout the experiment (i.e., including at the initial harvest at time=0 months) and hence would not likely explain mass losses in time. Hg losses were relatively consistent and linear in time. At the level of individual species (post-hoc test after ANOVA), significant mass losses were observed in the three deciduous species but were not significant in pine litter. The lack of mass loss in pine may be associated with its correspondingly slow rate of decomposition.
Because litter samples were kept in glass jars that only al-lowed mass losses by air exchange through a 0.2 µm Teflon® filter membrane in the lid, we attribute the observed Hg mass losses from litter to gaseous evasion to the atmosphere, most likely in elemental form. We originally hypothesized (Hy-pothesis 1) that C mass loss due to mineralization (as CO2)
mass during decomposition in most species (in support of Hypothesis 2), but that losses can be similar in others (e.g., aspen).
Evaporation of gaseous Hg from soils and surface litter is considered an important source of Hg to the atmosphere; and many studies have quantified such emissions, in particular from soils, along with its controlling factors (Hanson et al., 1995; Carpi and Lindberg, 1997; Gustin et al., 1997; Poissant and Casimir, 1998; Engle et al., 2001; Zhang et al., 2001; Ericksen and Gustin, 2004; Xin and Gustin, 2007; Kuiken et al., 2008a, b). Only a few studies have performed corre-sponding measurements of both Hg0and CO2efflux rates in
order to assess potential relationships between C mineraliza-tion and Hg emissions, and to quantify if and to what degree Hg emissions may be due to loss of the organic C matrix with which Hg is associated. Fritsche et al. (2008a) reported cor-relations between Hg0and CO2emissions from soils upon
stimulation and inhibition of soil respiration using experi-mental treatments. Wickland et al. (2006) reported a cor-relation between in situ field soil respiration and Hg0 emis-sion rates in boreal forest soils. Previously, Rogers and Mc-Farlane (1979) reported declines in Hg0 emissions follow-ing soil sterilization, albeit without directly measurfollow-ing CO2
respiration rates. Obrist et al. (2010) observed relationships between CO2and Hg0 efflux rates in controlled laboratory
studies and also showed that Hg/C ratios in surface emission only accounted for∼3 % of the Hg/C ratio present in soils. They also showed that experimental treatments (such as im-plementation of anaerobic conditions) easily disrupted this CO2-Hg0 flux relationship. Significant Hg mass losses
ob-served in the present laboratory study suggested that gaseous losses of Hg during decomposition potentially may be much larger in litter than relatively small Hg losses associated with mineralization in soils. We propose that a significant frac-tion of Hg associated with surface forest litter – ranging from 48 % to full loss and depending on species – may be subject to evaporation losses once litter is subject to decomposition, at least under the conditions implemented in our controlled laboratory study.
Our observations of significant Hg mass losses, and rel-atively constant Hg concentrations and Hg/C ratios, dur-ing decomposition contrast observations made in the field, both from previous studies and our field control. Demers et al. (2007) observed that total litter Hg increased by 134 % and 128 % of its initial mass in deciduous and coniferous lit-ter aflit-ter two years of exposure in a mixed deciduous and coniferous forest, while at the same time litter dry mass decreased by 33 % and 43 %, respectively. Similarly, Hall and St. Louis (2004) reported that Hg mass in deciduous and coniferous litter exposed in forests increased by 147 %, and 37 % compared to initial Hg mass after the 798 days of decomposition in a boreal, upland forest, while dry mass declined by 57 to 46 %, respectively. Hayes et al. (1998) showed no Hg mass change in spruce litter in the field dur-ing 2.5 yr of exposure, despite 20 to 40 % dry mass losses.
Along with Hg mass increases, Hall and St. Louis (2004) observed Hg concentration increases during field exposure (151 to 474 % after 798 days of field exposure), and Demers et al. (2007) observed Hg concentration increases of 109 to 127 % after two years of field exposure. In our study, field control samples exposed at the respective sampling locations showed consistently higher Hg concentrations and higher Hg/C ratios after one year compared to levels observed prior to field exposure. Also, litter Hg concentrations were en-hanced by 8 to +64 % compared to samples incubated for the same time period in the laboratory (Fig. 3a). We graphed Hg concentrations versus respective C/N ratios (Fig. 3c) to quantify Hg concentration changes per unit change C/N ratio. As discussed above, we thereby use C/N ratios as a relative measure of the degree of decomposition, with higher C/N ratios representing less decomposed litter samples and lower C/N ratios indicative of more decomposed litter samples. We thereby can account for potentially different decomposition rates of field and laboratory samples and “standardize” Hg concentrations to the degree of decomposition. Results show that two species (mixed deciduous and oak litter) showed particularly pronounced Hg concentration enhancements in the field compared to the laboratory, as evident by data points above the linear trendline drawn for laboratory samples. In aspen litter, however, where we already observed Hg con-centration enhancement in the laboratory, the regression line was similar between laboratory and field samples, and in pine litter we observed inconsistent and variable patterns.
The above patterns suggest pronounced sorption of addi-tional Hg in litter exposed in the field (in support of Hypoth-esis 3), leading to over 60 % concentration enhancements in the field compared to litter exposed in the laboratory where atmospheric Hg inputs were minimized by 0.2 µm Teflon® membranes covering litter jars and addition of Hg-free wa-ter. Our results, however, also indicate that Hg accumulation in the field may strongly dependent on litter types or on lo-cation of field exposure. We did not directly measure Hg deposition at the field sites, but National Atmospheric Depo-sition Program data indicate that wet depoDepo-sition in the area of our field sites ranged between 4 to 6 µg Hg m−2yr−1(NADP,
some species. Further, it is possible that tissues in the field equilibrate Hg concentrations with those of the surrounding substrates: Hall and St. Louis (2004) observed that litter with initial Hg concentration of less than 30 ng g−1 showed in-creases in Hg concentration, while litter with Hg concentra-tions more than 30 ng g−1generally showed a decrease com-pared to initial concentration. In our study, we did not find indication for such a “compensation” point. The notion of significant sorption of Hg in decomposing litter is in good agreement with many studies that report strong accumula-tion of Hg in litter and surface soil layers in the field (Mierle, 1990; Aastrup et al., 1991; Nater and Grigal, 1992; Munthe et al., 1998; Grigal, 2003; Friedli et al., 2007; Obrist et al., 2011).
It is important to note that artificial laboratory conditions also may have contributed to differences between laboratory and field litter samples, including different temperatures, so-lar radiation, humidities, and differences in watering (e.g., Millipore water versus rainwater, drying-wetting cycles). For example, laboratory samples were kept under darkness while litter samples in the field may have experienced light ex-posure. Laboratory samples hence may have been shielded from photoreduction processes (e.g., Graydon et al., 2008). This effect, however, actually should have decreased Hg lev-els of field-exposed litter. Light exposure may possibly only affect very top-surface leaves and may be important for short time periods (until burial by new leaves). Light exposure also may play a role in litter decomposition (e.g., through reduc-tion in litter decomposireduc-tion rate; Austin and Vivanco, 2006). We observed pronounced differences in Hg accumulation patterns between the four litter species; for example, aspen litter showed Hg concentration increases both in the field and during laboratory exposure, while pine litter showed a lack of accumulation under both exposures. This may be caused by pine litter’s low decomposition rate (note its slow mass loss in Fig. 1), possibly caused by relatively high C/N ratios as discussed above. Previous studies have shown strong links between Hg concentrations and organic matter degradation in soils and lake sediments (Grondin et al., 2005; Teisserenc et al., 2011). Obrist et al. (2011) observed increasing Hg ac-cumulation in litter and soils from southern to northern lat-itudes using data of 14 forest sites, which they attribute in part to potentially slower decomposition rates – and hence longer exposure – of organic carbon pools in northern lati-tudes. Given that we only evaluated four litter types, it is not possible to assess if Hg accumulation patterns are specific to particular litter types (such as coniferous versus decidu-ous litter). Aside from C/N ratios, for example, litter species differ in many other biogeochemical processes (tanning and lignin contents, mineralization rates, microbial biomass, dis-solved C and N dynamics; Finzi et al., 1998; Cˆot´e et al., 2000; Smolander et al., 2005), and such parameters could affect the capacity of litter to retain and sorb Hg.
4.3 Solubility of Hg in litter during decomposition When harvested litter was submerged in water for quantifi-cation of Hg solubility, the amount of soluble Hg (filtered by 0.45 µm membrane) per litter dry mass strongly decreased in time. At the start of the experiment, soluble Hg aver-aged between 0.07 and 0.22 ng Hg g−1 dry mass,
depend-ing on species. This amount, although highly variable, de-creased to close to detection limit (about 0.05 ng Hg g−1dry
mass) to 0.13 ng Hg g−1 dry mass after 12 months. After
18 months, most litter samples showed no soluble Hg con-centrations above the detection limit anymore. These results indicate that the fraction of Hg available for mobilization as soluble Hg decreases with increasing time of decomposition. Comparisons of these results with other studies are chal-lenging since we are not aware of studies that addressed Hg solubility of variously decomposed litter substrates. In a con-trolled litter incubation study, Tsui et al. (2008) submerged forest litter samples in different stream water for 66 days and observed that soluble Hg (both total Hg and methylated Hg) in water samples increased significantly with time of expo-sure. The Tsui et al. study demonstrated that litter in streams and lakes decomposing under hypoxic conditions contribute Hg to water bodies and showed that the contributions are highly dependent on stream water chemistry. The experi-mental conditions between Tsui et al.’s study and ours, how-ever, are not comparable – given that we decomposed litter under aerobic conditions and assessed Hg solubility at the time of harvests, while Tsui et al.’s study assessed the cu-mulative amount of soluble Hg released under anaerobic de-composition. In the field, Hall and St. Louis (2004) reported Hg concentration increases in tree litter submerged in flooded reservoirs whereby litter seemed to reach equilibrium condi-tions with the surrounding water. In sphagnum tissues, Heyes et al. (1998) and Hall and St. Louis (2004) reported Hg mass losses from litter submerged in wetland and flooded reser-voirs, respectively.
in our study may include different tissue types, leaf age, and stage of decomposition (e.g., fresh leaves versus surface Oi litter), and that litter was subject to precipitation wash-off prior to collection in the field while leaves used by Erick-sen et al. (2003) were grown in environmentally controlled growth chambers without experiencing rain.
5 Summary
The results of our laboratory incubation study showing sub-stantial Hg mass losses in decomposing litter are important in regards to atmospheric emissions of Hg from terrestrial ecosystems. Such releases back into the atmosphere can be considered re-emission fluxes of Hg that was originally sorbed from the atmosphere and then deposited by leaf lit-terfall. The issue of re-emission processes is of high inter-est since thousands of tons of Hg are contained and stored in surface litter and surface soils (e.g., Grigal et al., 2003; Obrist, 2007), including substantial amounts of past anthro-pogenic emissions due to increased atmospheric Hg pollution during the last 150 yr (Fitzgerald et al., 1998; Schuster et al., 2002). Substantial re-emission of Hg contained in terrestrial storage pools, particularly during mineralization processes, could have important consequences for global environmen-tal change due to predicted changes in terrestrial C storage (Grigal, 2003; Obrist, 2007). Recent studies using stable iso-topes (Hintelmann et al., 2002; Ericksen et al., 2005; Harris et al., 2007; Graydon et al., 2009) showed that most of newly deposited Hg, when applied via wet deposition, is retained in watersheds and soils, and that atmospheric re-emission may account for less than 10 % in the first year after application (Ericksen et al., 2005; Harris et al., 2007). Our study points toward potentially stronger re-emission, up to 23 % of Hg within 18 months, of Hg that is originally associated with plant litter. Our study, however, cannot address the degree to which re-emission will reach the atmosphere in the field, or to what degree artificial laboratory conditions might have bi-ased our results. Our laboratory litter samples, for example, were kept in an artificial environment, were removed from soils, kept in darkness, and watered regularly with Millipore water, and all these conditions may affect re-emission losses of Hg. In a field study, for comparison, we found that gaseous Hg/C ratios in emissions only accounted for a few percent of the Hg/C ratios of the soil pool (Obrist et al., 2009), while in this laboratory study, we observed up to equivalent loss of Hg and C upon decomposition in litter. Smith-Downey et al. (2010) estimated the fraction of emissions of Hg re-leased from soil organic carbon upon decomposition to 16 %. Our results also indicate that litter types show highly species-specific behaviors: evasion losses of Hg were variable by species (ranging from 5 to 23 %), and so was sorption of new Hg litter observed in the field, indicating that different plant tissues show inherently different behaviors regarding sorp-tion, retensorp-tion, and re-emission of Hg.
Acknowledgements. We would like to thank Rebecca Wenk, Andrew Richardson, Scott Ollinger, Michelle Day, and Rob York for help with litter collection and placement of litter bags in the field. Thanks also to Johnny Dagget, Bill Coulomb, Russ Bergin, So Lee, and Xavier Fa¨ın for the experimental set-up and analytical support. We appreciate editorial comments by Roger Kreidberg. Funding was provided by the US Environmental Protection Agency through a Science-To-Achieve-Results grant (# RD833378010) and through DRI Internal Project Assignment funding.
Edited by: X. Wang
References
Aastrup, M., Johnson, J., Bringmark, E., Bringmakr, I., and Iver-feldt, A.: Occurence and transport of mercury within a small catchment area, Water Air Soil Poll., 56, 155–167, 1991. Allard, B. and Arsenie, I.: Abiotic reduction of mercury by humic
substances in aquatic system – an important process for the mer-cury cycle, Water Air Soil Poll., 56, 457–464, 1991.
Austin, A. T. and Vivanco, L.: Plant litter decomposition in a semi-arid ecosystem controlled by photodegradation, Nature, 442, 555–558, 2006.
Bryant, D. M., Holland, E. A., Seastedt, T. R., and Walker, M. D.: Analysis of litter decomposition in an alpine tundra, Can. J. Bot., 76, 1295–1304, 1998.
Carpi, A. and Lindberg, S. E.: Sunlight-mediated emission of elemental mercury from soil amended with municipal sewage sludge, Environ. Sci. Technol., 31, 2085–2091, 1997.
Cˆot´e, L., Brown, S., Pare, D., Fyles, J., and Bauhus, J.: Dynamics of carbon and nitrogen mineralization in relation to stand type, stand age and soil texture in the boreal mixedwood, Soil Biol. Biochem., 32, 1079–1090, 2000.
Couteaux, M. M., Bottner, P., and Berg, B.: Litter decomposition, climate and litter quality, Trends Ecol. Evol., 12, 63–66, 1995. Demers, J. D., Driscoll, T. C., Timothy, J. F., and Joseph, B. Y.:
Mercury cycling in litter and soil in different forest types in the Adirondack region, New York, Ecol. Appl., 17, 1341–1351, 2007.
Driscoll, C. T., Blette, V., Yan, C., Schofield, C. L., Munson, R., and Holsapple, J.: The role of dissolved Organic Carbon in the chemistry and bioavailability of mercury in remote Adirondack lakes, Water Air Soil Poll., 80, 499–508, 1995.
Driscoll, C. T., Han, Y.-J., Chen, C. Y., Evers, D. C., Lambert, K. F., Holsen, T. M., Kamman, N. C., and Munson, R. K.: Mercury contamination in forest and freshwater ecosystems in the North-eastern United States, Bioscience, 57, 17–28, 2007.
Engle, M., Gustin, M. S., and Zhang, H.: Quantifying natural source mercury emissions from the Ivanhoe mining district, North-Central Nevada, USA, Atmos. Environ., 35, 3987–3997, 2001. Ericksen, J. and Gustin, M. S.: Foliar exchange of mercury as a
function of soil and air mercury concentrations, Sci. Total Envi-ron., 324, 271–279, 2004.
Ericksen, J. A., Gustin, M. S., Schorran, D. E., Johnson, D. W., Lindberg, S. E., and Coleman, J. S.: Accumulation of atmo-spheric mercury in forest foliage, Atmos. Environ., 37, 1613– 1622, 2003.
mercury deposited in precipitation from arid soils using a stable isotope, Environ. Sci. Technol., 39, 8001–8007, 2005.
Finzi, A. C., Van Breemen, N., and Canham, C. D.: Canopy tree-soil interactions within temperate forests: species effects on tree-soil carbon and nitrogen, Ecol. Appl., 8, 440–446, 1998.
Fitzgerald, W. F., Engstrom, D. R., Mason, R. P., and Nater, E. A.: The case for atmospheric mercury contamination in remote areas, Environ. Sci. Technol., 32, 1–7, 1998.
Frescholtz, T. F., Gustin, M. S., Schorran, D. E., and Fernandez, G. C. J.: Environmental toxicology – assessing the source of mer-cury in foliar tissue of quaking aspen, Environ. Toxicol. Chem., 22, 2114–2119, 2003.
Friedli, H. R., Radke, L. F., Payne, N. J., McRae, D. J., Lyn-ham, T. J., and Blake, T. W.: Mercury in vegetation and or-ganic soil at an upland boreal forest site in Prince Albert National Park, Saskatchewan, Canada, Geophys. Res., 112, G01004, doi:10.1029/2005JG000061, 2007.
Fritsche, J., Obrist, D., and Alewell, C.: Evidence of microbial con-trol of Hg0emissions from uncontaminated terrestrial soils, J. Plant Nutr. Soil Sc., 171, 200–209, 2008a.
Fritsche, J., Obrist, D., Zeeman, M. J., Conen, F., Wugster, W., and Alewell, C.: Elemental mercury fluxes over a sub-alpine grass-land with two micrometeorological methods, Atmos. Environ., 42, 2922–2933, 2008b.
Fu, X., Feng, X., Zhu, W., Rothenberg, S., Yao, H., and Zhang, H.: Elevated atmospheric deposition and dynamics of mercury in a remote upland forest of southwestern China, Environ. Pollut., 158, 2324–2333, 2010.
Graydon, J., St. Louis, V., Hintelmann, H., Lindberg, S., Sandi-lands, K., Rudd, J., Kelly, C., Hall, B., and Mowat, L.: Long-Term Wet and Dry Deposition of Total and Methyl Mercury in the Remote Boreal Ecoregion of Canada, Environ. Sci. Technol., 42, 8345–8351, 2008.
Graydon, J. A., St. Louis, V. L., Hintelmann, H., Lindberg, S. E., Sandilands, K. A., Rudd, J. W. M., Kelly, C. A., Tate, M. T., Krabbenhoft, D. P., and Lehnherr, I.: Investigation of uptake and retention of atmospheric Hg (II) by boreal forest plants using stable Hg isotopes, Environ. Sci. Technol., 43, 4960–4966, 2009. Grigal, D. F.: Inputs and outputs of mercury from terrestrial
water-sheds: a review, Environ. Rev., 10, 1–39, 2002.
Grigal, D. F.: Mercury sequestration in forests and peatlands: a review, J. Environ. Qual., 32, 393–405, 2003.
Grigal, D. F., Kolka, R. K., Fleck, J. A., and Nater, E. A.: Mercury budget of an upland-peatland watershed, Biogeochemistry, 50, 95–109, 2000.
Grondin, A., Lucotte, M., Mucci, A., and Fortin, B.: Mercury and lead profiles and burdens in soils of Quebec (Canada) before and after flooding, Can. J. Fish. Aqat. Sci., 52, 2493–2506, 2005. Gustin, M. S., Taylor, G. E., and Maxey, R. A.: Effect of
tem-perature and air movement on the flux of elemental mercury from substrate to the atmosphere, J. Geophys. Res.-Atmos., 102, 3891–3898, 1997.
Hall, B. D. and St. Louis, V. L.: Methylmercury and total mercury in plant litter decomposing in upland forests and flooded land-scapes, Environ. Sci. Technol., 38, 5010–5021, 2004.
Hanson, P. J., Lindberg, S. E., Tabberer, T. A., Owens, J. G., and Kim, K. H.: Foliar exchange of mercury vapor : evidence for a compensation point, Water Air Soil Poll., 80, 373–382, 1995. Harris, R. C., Rudd, J. W. M., Amyot, M., Babiarz, C., Beaty, K.
G., Blanchfield, P. J., Bodaly, R. A., Branfireun, B. A., Gilmour, C. C., Graydon, J. A., Heyes, A., Hintelmann, H., Hurley, J. P., Kelly, C. A., Krabbenhoft, D. P., Lindberg, S. E., Mason, R. P., Paterson, M. J., Podemski, C. L., Robinson, A., Sandilands, K. A., Southworth, G. R., St. Louis, V. L., and Tate, M. T.: Whole-ecosystem study shows rapid fish-mercury response to changes in mercury deposition, P. Natl. Acad. Sci. USA, 104, 16586– 16591, 2007.
Heyes, A., Moore, T. R., and Rudd, J. W. M.: Mercury and methylmercury in decomposing vegetation of a pristine and im-pounded wetland, J. Environ. Qual., 27, 591–599, 1998. Hintelmann, H., Harris, R., Heyes, A., Hurley, J., Kelly, C.,
Krabbenhoft, D., Lindberg, S., Rudd, J., Scott, K., and St Louis, V. L.: Reactivity and mobility of new and old mercury depo-sition in a Boreal Forest ecosystem during the first year of the METAALICUS study, Environ. Sci. Technol., 36, 5034–5040, 2002.
Horner, D. J., Gosz, J. R., and Cates, R. G.: The role of carbon-based plant secondary metabolites in decomposition in terrestrial ecosystems, Am. Nat., 132, 869–883, 1988.
Iverfeldt, A.: Mercury in forest canopy throughfall water and its relation to atmospheric deposition, Water Air Soil Poll., 56, 553– 564, 1991.
Johansson, K. and Iverfeldt, ˚A.: The relation between mercury con-tent in soil and transport of mercury from small catchments in Sweden, in: Mercury Pollution: Integration and Synthesis, edited by: Watras, C. J. and Huckabee, J. W., Lewis publishers, Mon-terey, California, USA, 323–328, 1994.
Joslin, J. D.: Regional differences in mercury levels in aquatic ecosystems: a discussion of possible causal factors with impli-cations for the Tennessee River system and the Northern Hemi-sphere, Environ. Manage., 18, 559–567, 1994.
Kaneko, N. and Salamanca, E.: Mixed leaf litter effects on decom-position rates and soil microarthropod communities in an oak-pine stand in Japan, Ecol. Res., 14, 131–138, 1999.
Kolka, R. K., Grigal, D. F., Verry, E. S., and Nater, E. A.: Mercury and organic carbon relationships in streams draining forested up-land/peatland watersheds, J. Environ. Qual., 28, 766–775, 1999. Kuiken, T., Gustin, M. S., Zhang, H., Lindberg, S. E., and Sedinge, B.: Mercury emission from terrestrial background surfaces in the eastern USA, Part II: Air/surface exchange of mercury within forests from South Carolina to New England, Appl. Geochem., 23, 356–368, 2008a.
Kuiken, T., Zhang, H., Gustin, M. S., and Lindberg, S.: Mer-cury emission from terrestrial background surfaced in the eastern USA, Part I: Air/surface exchange of mercury within a southeast-ern deciduous forest (Tennessee) over one year, Appl. Geochem., 23, 345–355, 2008b.
Lee, Y. H., Bishop, K. H., Munthe, J., Iverfeldt, ˚A., Verta, M., Park-man, H., and Hultberg, H.: An examination of current Hg de-position and export in Fenno-Scandinavian catchments, Biogeo-chemistry, 40, 125–135, 1998.
plant detritus, Mar. Pollut. Bull., 5, 93–95, 1974.
Lindberg, S. E., Hanson, P. J., Meyers, T. P., and Kim, K. H.: Atmosphere-surface exchange of mercury in a forest: results of modeling and gradient approaches, J. Geophys. Res.-Atmos., 97, 2519–2528, 1992.
Lorey, P. and Driscoll, C. T.: Historical trends of mercury deposi-tion in Adirondack lakes, Environ. Sci. Technol., 33, 718–722, 1999.
Lyman, S. N., Gustin, M. S., Prestbo, E. M., and Marsik, F. J.: Estimation of dry deposition of atmospheric mercury in Nevada by direct and indirect methods, Environ. Sci. Technol., 41, 1970– 1976, 2007.
Mason, R. P. and Sheu, G. R.: Role of the ocean in the global mercury cycle, Global Biogeochem. Cy., 16, 1093, doi:10.1029/2001GB001440, 2002.
Meili, M.: The coupling of mercury and organic matter in the bio-geochemical cycle – towards a mechanistic model for the boreal forest zone, Water Air Soil Poll., 56, 333–347, 1991.
Millhollen, A. G., Gustin, M. S., and Obrist, D.: Mercury accu-mulation in grass and forb species as a function of atmospheric carbon dioxide concentrations and mercury exposures in air and soil, Chemosphere, 65, 889–897, 2006a.
Millhollen, A. G., Obrist, D., and Gustin, M. S.: Foliar mercury accumulation and exchange for three tree species, Environ. Sci. Technol., 40, 6001–6006, 2006b.
Mierle, G.: Aqueous inputs of mercury to Precambrian shield lakes in Ontario, Environ. Toxicol. Chem., 9, 843–851, 1990. Mierle, G. and Ingram, R.: The role of humic substances in the
mobilization of mercury from watersheds, Water Air Soil Poll., 56, 349–357, 1991.
Moore, T. R., Trofymow, J. W., Taylor, B., Prescott, C., Camire, C., Duschene, L., Fyles, J., Kozak, L.,Kranavetter, M., Morrison, I., Siltanesn, M., Smith, S., Titus, B., Visser, S., Wein, R., and Zoltai, S.: Litter decomposition rates in Canadian forests, Glob. Change Biol., 5, 75–82, 1999.
Munthe, J., Lee, Y. H., Hultberg, H., and Iverfeldt, ˚A., Borg, G. Ch., and Andersson, I.: Cycling of mercury and methylmercury in the G˚ardsj¨on Catchements, in: Experimental Reversal of Acid Rain Effects, The G˚ardsj¨on Roof Project, edited by: Hultberg, H. and Skeffington, R., John Wiley & Sons, New York, USA, 261–276, 1998.
National Atmospheric Deposition Program: Mercury Deposition Program (NADP), available at: http://nadp.sws.uiuc.edu/mdn/, last access: 11 January 2011, 2009.
Nater, E. A. and Grigal, D. F.: Regional trends in mercury distribu-tion across the Great Lakes states, North Central USA, Nature, 358, 139–141, 1992.
Obrist, D.: Atmospheric mercury pollution due to losses of carbon pools?, Biogeochemistry, 85, 119–123, 2007.
Obrist, D., Conen, F., Vogt, R., Siegwolf, R., and Alewell, C.: Esti-mation of Hg0exchange between ecosystems and the atmosphere using222Rn and Hg0concentration changes in the stable noctur-nal boundary layer, Atmos. Environ., 40, 856–866, 2006. Obrist, D., Johnson, D. W., and Lindberg, S. E.: Mercury
concentra-tions and pools in four Sierra Nevada forest sites, and relation-ships to organic carbon and nitrogen, Biogeosciences, 6, 765– 777, doi:10.5194/bg-6-765-2009, 2009.
Obrist, D., Fa¨ın, X., and Berger, C.: Relationships between gaseous elemental mercury emissions and CO2respiration rates in
ter-restrial soils under aerobic and anaerobic conditions, Sci. Total Environ., 408, 1691–1700, 2010.
Obrist, D., Johnson, D. W., Lindberg, S. W., Luo, Y., Hararuk, O., Bracho, R., Battles, J. J., Dail, D. B., Edmonds, R. L., Monson, R. K., Ollinger, S. V., Pallardy, S. G., Pregitzer, K. S., and Todd, D. E: Mercury distribution across 14 U.S. forests, Part I: Spatial patterns of total Hg concentrations in biomass, litter, and soils, Environ. Sci. Technol., 45, 3974–3981, 2011.
Paul, E. A. and Clark, F. E.: Soil microbiology and biochem-istry, Academic Press, San Diego, California, USA, ISBN 0125468059, 1989.
Poissant, L. and Casimir, A.: Water-air and soil-air exchange rate of total gaseous mercury measured at background sites, Atmos. Environ., 32, 883–893, 1998.
Prescott, C. E., Zabek, L. M., Staley, C. L., and Kabzems, R.: De-composition of broad leaf and needle litter in forests of British Columbia: influences of litter type, forest type, and litter mix-tures, Can. J. Forest Res., 30, 1742–1750, 2000.
Rea, A. W., Lindberg, S. E., and Keeler, G. J.: Assessment of dry deposition and foliar leaching of mercury and selected trace el-ements based on washed foliar and surrogate surfaces, Environ. Sci. Technol., 34, 2418–2425, 2000.
Rea, A. W., Lindberg, S. E., Scherbatskoy, T., and Keeler, G. J.: Mercury accumulation in foliage over time in two northern mixed hardwood forests, Water Air Soil Poll., 133, 49–67, 2002. Rogers, R. D. and McFarlane, J. C.: Factors influencing the volatilization of mercury from soil, J. Environ. Qual., 8, 255– 260, 1979.
Rutter, A. P., Schauer, J. J., Shafer, M. M., Creswell, J. E., Olson, M. R., Robinson, M., Collins, R. M., Parman, A. M., Katzman, T. L., and Mallek, J. L.: Dry deposition of gaseous elemental mercury to plants and soils using mercury stable isotopes in a controlled environment, Atmos. Environ., 45, 848–855, 2011. Schuster, P. F., Krabbenhoft, D. P., and Naftz, D. L.: Atmospheric
mercury deposition during the last 270 years: a glacial ice core record of natural and anthropogenic sources, Environ. Sci. Tech-nol., 36, 2303–2310, 2002.
Schwesig, D. and Matzner, E.: Pools and fluxes of mercury and methylmercury in two forested catchments in Germany, Sci. To-tal Environ., 260, 213–223, 2000.
Selin, N. E., Jacob, D. J., Park, R. J., Yantosca, R. M., Strode, S., Jaegle, L., and Jaffe, D.: Chemical cycling and deposition of atmospheric mercury: global constraints from observations, J.Geophys. Res., 112, D02308, doi:10.1029/2006JD007450, 2007.
Sheehan, K. D., Fernandez, I. J., Kahl, J. S., and Amirbahman, A.: Litterfall mercury in two forested watersheds at Acadia National Park, Maine, USA, Water Air Soil Poll., 170, 249–265, 2006. Smith-Downey, N. V., Sunderland, E. M., and Jacob, D. J.:
An-thropogenic impacts on global storage and emissions of mercury from terrestrial soils: Insights from a new global model, J. Geo-phys. Res., 115, G03008, doi:10.1029/2009JG001124, 2010. Smolander, A., Loponen, J., Suominen, K., and Kitunen, V.:
Or-ganic matter characteristics and C and N transformations in the humus layer under two tree species, Betula pendula and Picea abies, Soil. Biol. Biochem., 37, 1309–1318, 2005.
St. Louis, V., Rudd, J. W. M., Kelly, C. A., Hall, B. D., Rolfhus, K. R., Scott, K. J., Lindberg, S. E., and Dong, W.: Importance of the forest canopy to fluxes of methyl mercury and total mercury to boreal ecosystems, Environ. Sci. Technol., 35, 3089–3098, 2001. Sundarapandian, S. M. and Swamy, P. S.: Litter production and leaf litter decomposition of selected tree species in tropical forest at Kodayar in the Western Ghats, India, Forest Ecol. Manag., 123, 231–244, 1999.
Teisserenc, R., Lucotte, M., and Houel, S.: Terrestrial organic mat-ter biomarkers as tracers of Hg sources in lake sediments, Bio-geochemistry, 103, 235–244, 2011.
Tsui, M. T. K., Finlay, J. C., and Nater, E. A.: Effects of stream water chemistry and tree species on release and methylation of mercury during litter decomposition, Environ. Sci. Technol., 42, 8692–8697, 2008.
Weber, J. H.: Review of possible paths for abiotic methylation of mercury (II) in the aquatic environment, Chemosphere, 26, 2063–2077, 1993.
Webster, J. R. and Benfield, E. F.: Vascular plant breakdown in freshwater ecosystems, Annu. Rev. Ecol. Syst., 17, 567–594, 1986.
Wickland, K., Krabenhoft, D., and Olund, S.: Evidence for a link between soil respiration and mercury emissions from organic soils, Eighth International Conference on Mercury as a Global Pollutant, Madison, Wisconsin, 6–11 August 2006.
Xin, M. and Gustin, M. S.: Gaseous elemental mercury exchange with low mercury containing soils: investigation of controlling factors, Appl. Geochem., 22, 1451–1466, 2007.
Zhang, H., Lindberg, S. E., Marsik, F. J., and Keeler, G. J.: Mercury air/surface exchange kinetics of background soils of the Tahqua-menon River watershed in the Michigan Upper Peninsula, Water Air Soil Poll., 126, 151–169, 2001.