Top scores are possible, bottom scores are certain (and middle
scores are not worth mentioning): A pragmatic view of verbal
probabilities
Marie Juanchich
∗Karl Halvor Teigen
†Amélie Gourdon
‡Abstract
In most previous studies of verbal probabilities, participants are asked to translate expressions such aspossibleand not certain into numeric probability values. This probabilistic translation approach can be contrasted with a novel which-outcome (WO) approach that focuses on the outcomes that people naturally associate with probability terms. The WO approach has revealed that, when given bell-shaped distributions of quantitative outcomes, people tend to associate certaintywith minimum (unlikely) outcome magnitudes andpossibilitywith (unlikely) maximal ones. The purpose of the present paper is to test the factors that foster these effects and the conditions in which they apply. Experiment 1 showed that the association of probability term and outcome was related to the association of scalar modifiers (i.e., it is certain that the battery will lastat least..., it is possible that the battery will lastup to...). Further, we tested whether this pattern was dependent on the frequency (e.g., increasing vs. decreasing distribution) or the nature of the outcomes presented (i.e., categorical vs. continuous). Results showed that despite being slightly affected by the shape of the distribution, participants continue to prefer to associatepossiblewith maximum outcomes andcertainwith minimum outcomes. The final experiment provided a boundary condition to the effect, showing that it applies to verbal but not numerical probabilities.
Keywords: probability, language, verbal, judgment.
1
Introduction
Traditionally, verbal probabilities have been examined with a focus on their probabilistic meanings (e.g., a chancemeans on average a 30% probability). This ven-ture is labelled the Probabilistic Translation approach. The present paper presents findings suggesting that this approach should be supplemented with a pragmatic ap-proach that focuses on the outcomes people expect to be associated with a particular verbal expression (e.g.,a chanceis typically used to describe a top outcome). We have called this endeavour the Which Outcome (WO) ap-proach.
When do people use verbal probability expressions such as “it is possible” or “it is certain”, and what do they mean? This question has traditionally been approached with a focus on the numeric probabilities these terms are conveying (e.g., Budescu & Wallsten, 1995; Clarke, Ruf-fin, Hill & Beamen, 1992; Juanchich, Sirota & Butler,
This research was supported by an internal grant from Kingston Business School to the first author.
Copyright: © 2013. The authors license this article under the terms of the Creative Commons Attribution 3.0 License.
∗Kingston Business School, Kingston University, Kingston Hill,
KT2 7LB, UK. Email: [email protected].
†University of Oslo, Norway. ‡University of Birmingham, UK.
2013). In studies inspired by this probabilistic translation approach participants are typically given a “How Likely” task where they read a verbal probability qualifying a specified outcome and are asked to assess the numeric probability value the speaker has in mind. In other words, the verbal expression is “translated” into a number. Fig-ure 1 provides an example of a How Likely Task. The translation approach has revealed that verbal probabili-ties are numerically vague, as participants suggest num-bers that vary considerably (Budescu & Wallsten, 1995; Karelitz & Budescu, 2004). Despite this fuzziness, most people will agree thatpossiblegenerally corresponds to a higher probability thanunlikely, and thatlikely,highly likely, andcertaincorrespond to still higher probabilities. This suggests a rough hierarchy of phrases that enables verbal probabilities to successfully compete with numeric probabilities as input to the decision process (Wallsten, Budescu & Zwick, 1993). In the present paper special at-tention will be paid to the expressionspossible,certain, andnot certain. Translation studies agree that certain
indicates for most people probabilities close to 100%, whereasnot certaincorresponds on average to probabil-ities in the 40–50% range (Brun & Teigen, 1988; Reyna, 1981). This is also the probability range typically as-signed to the termpossible (Clarke et al., 1992; Theil, 2002).
Figure 1: Examples of How Likely and Which Outcome tasks (Teigen, Juanchich & Filkuková, in press).
Example of How Likely Task
“It is possible that the battery will last 2 hours”
What is the probability that the battery will last 2 hours?
0% 10% 20% 30% 40% 50% 60% 70% 80% 90% 100%
Example of Which Outcome Task
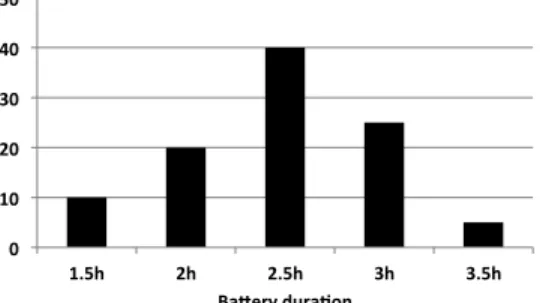
A sample of computers of the brand “Comfor” were tested to check how long the batteries last before they need to be recharged. The figure below shows how many batteries lasted how many hours. Please complete the prediction below with the outcome that seems most ap-propriate in this context.
!" #!" $!" %!" &!" '!"
#(')" $)" $(')" %)" %(')" *+,-./"01.+234"
“It is possible that the battery will last .... hours”
Verbal phrases have also been studied from a more pragmatic perspective, which has focused on an alterna-tive feature of the meaning of probability terms, namely their directionality (Gourdon & Beck, 2012; Honda & Yamagishi, 2006; Teigen, 1988; Teigen & Brun, 1999; for an attempt to reconcile the two approaches, see Juanchich, Sirota, Karelitz & Villejoubert, 2012). Ex-pressions with a positive directionality (such asa chance
andpossible) draw attention toward the occurrence of an outcome and are typically associated with reasons ex-plaining why the outcome should happen (e.g., “It is pos-sible that Blacky will win the race becausehe is in ex-cellent shape”). In contrast, expressions with a nega-tive directionality (such asnot certainandunlikely) fo-cus on the flip side of the coin and are typically associ-ated with reasons supporting the non-occurrence of the target outcome (e.g., “it is not certain that Blacky will win becausehe was injured recently”). The directional-ity of verbal probabilities allows complementary ways of framing a probabilistic message, which can “leak” infor-mation (to use an expression coined by Sher & McKen-zie, 2006) about the speaker’s communicative intentions (e.g., encouraging someone to bet on Blacky or not to bet on Blacky). More generally, positive expressions are used whenever a probability is compared to lower chances, for instance, when an exaggerated probability statement has to be corrected upward. By contrast, negative expressions are used when a probability is compared to a higher one,
for instance, when a belief has to be adjusted downwards (Juanchich, Teigen & Villejoubert, 2010).
In the present study, we approach the usage and mean-ing of probability expressions from yet another pragmatic perspective. Whereas the two previous approaches de-scribe how verbal probabilities qualify an outcome, in this approach we ask which outcomes do they qualify. This approach was developed in a context of outcomes that vary in terms of magnitude (Teigen & Filkuková, 2013; Teigen et al., in press; Teigen, Juanchich & Riege, 2013). For example, weather forecasters predict not only the possibility or likelihood of rain but alsohow much
it will rain (e.g., “It is possible that it will rain 10mm”). Similarly, doctors do not only predict the chances of re-covery of a patient, but a likely rere-covery time (e.g., “The patient will certainly recover in 10 weeks”). In studies using the Which Outcome(WO) approach, participants do not choose a numerical probability associated with the verbal expression, but indicate theoutcomesuggested by the verbal expression in an Outcome Completion Task. For example, in a Battery life vignette, participants re-ceived a unimodal, bell-shaped distribution of outcomes showing the duration of a sample of laptop batteries (as depicted in the lower panel of Figure 1), and were asked how long a batterycanlast, or willpossiblylast (“It is possible that a Comfor battery lasts for ... hours”). The WO approach revealed patterns of association between probability terms and outcome magnitude inconsistent with the traditional probabilistic translation approach.
Typically,certainwas often associated with minimum outcomes, whereascan, possible,a chance, andnot cer-tainwere all used to describe maximal outcomes (Teigen et al., in press). For example, in the battery vignette, where batteries lasted between 1 hour and 3.5 hours with a peak located at 2 hours, most of the participants claimed they werecertainthat the battery would last 1 hour and judged that it was possible that the battery would last 3.5 hours. Note that these two values were infrequent (5–10%) and should accordingly have been perceived as quite unlikely.
The present article investigates the conditions in which participants infer the intensity of an outcome from a prob-ability term and aims to gain a better understanding of the dynamics that underpin the Which Outcome (WO) findings. A series of five studies aims to test the occur-rence of the WO findings with different scalar modifiers, different outcome distributions (e.g., magnitude distribu-tions of different shapes, categorical distribudistribu-tions) and to new formats (numerical probabilities). These studies contribute to the mapping of factors that are responsible for the WO effects.
1.1
At least or at most quantities?
The discrepancy between the probabilistic translation and Which Outcome approaches may be explained by the way participants construe the different tasks. Teigen et al. (2013) suggested that in the How Likely task (i.e., where participants provide a numerical probability to translate the meaning of a verbal probability) participants adopt a probabilistic reading of the task. In contrast, when they are asked to make a prediction, it appears that partici-pants rely more heavily on pragmatic rules of communi-cation of quantities that depart from a frequentistic uncer-tainty interpretation. When conveying quantities in nat-ural language, it is common practice to report the min-imum quantity expected. For example, a person saying that a crop will give 100 kg of potatoes may in fact make the prediction that the crop will give at least a 100 kg of potatoes. Jou, Shanteau and Harris (1996) and Man-del (2001) made the same suggestion that certain pre-dictions are interpreted as communicating the minimum outcome to be expected in the context of framing stud-ies (e.g., “If Program C is adopted, 400 people will die” would be understood as “If Program C is adopted,at least
400 people will die”). In fact it seems that the associa-tion between quantities and scalar modifiers (Nouwen & Geurts, 2007) may be more generalised and complex than expected:certainpredictions could be associated with “at least” quantities, whereas predictions conveying different degrees of certainty would be associated with other scalar modifiers. So for instance, predictions ofpossible out-comes could be given “at most” readings, as suggested by a recent study by Teigen et al. (in press).
Teigen and Filkuková (2013; study 4) tested this possi-bility for the modal auxiliarieswillandcan, and showed that participants associatedwill(close to certain) with the modifier “at least”, whereas can(a modal with similar meaning to possible) was more often combined with the modifier “up to”. A Norwegian corpus search showed the same conclusion: willwas often associated with the scalar modifier “at least”, whereas canwas often asso-ciated with the modifier “up to”. Experiment 1 was de-signed to test whether the verbal probability termscertain
andpossibleare also linked to such scalar modifiers indi-cating extremity.
1.2
Extremeness or uniqueness?
With the novelWhich Outcomeapproach we found that extreme outcomes were more often selected than could be expected from an analysis based on the frequencies of occurrence. For example participants selected a bat-tery duration of 3.5 hours (frequency of 5%) to be pos-sible whereas possible is usually considered to convey a 50% probability (Teigen et al., in press). Moreover, maximum extremes were selected more often than mini-mal ones, especially for outcomes with scalar properties where higher values entail the occurrence of lower ones (e.g., before lasting 3 hours, a battery lasted 1.5 hours). Participants thus preferred outcomes that were extreme, but also unique; which of these two factors drives the preference so far remains unclear.
The preference for extreme outcomes is supported by the cognitive psychology literature showing that extreme probabilities are judged as more informative than mod-erate ones (Keren & Teigen, 2001), and by the social psychology literature showing that information about ex-treme cases (e.g., exex-treme personality traits) has a greater impact than less extreme ones (Fiske, 1980). However, all outcome distributions studied so far (Teigen & Filkuková, 2013; Teigen et al., in press; Teigen et al., 2013) were bell-shaped and approximately symmetrical (see bottom of Figure 1), making extreme outcomes at the same time more infrequent than intermediate outcomes. Hence, we do not know whether people selected maximum out-comes because of their extremeness or their uniqueness— or conversely, whether a higher frequency would make extreme outcomes even more attractive, and perhaps in-crease the choice of bottom values. Experiments 2 and 3 were designed to replicate and extend the original find-ings of the WO effect for outcome distributions that are monotonically increasing or decreasing (Experiment 2) or U-shaped with a mode located either to the bottom or to the maximum of the distribution (Experiment 3).
1.3
Ruling out outcome extremeness with
categorical outcomes
possiblecolour of the car? Which colour isnot certain? There are in this case no top or bottom outcome values, as the colours can be arranged in any order, so the WO effect might seem to not apply. However, relative proba-bility could be used as an alternative cue, suggesting that the most frequent alternative (black) should be mentioned most frequently as apossible colour, whereas the least frequent should be chosen for thecertain colour. If in-stead uniqueness plays a role, more participants should select white than red or grey. Similarly, all outcomes in this example are, by definition, not certain. But is this primarily a characteristic that people will use to de-scribe the most frequent or the least frequent alternative, or will they choose among those in between? In Experi-ment 4, the quantitativehow much-question is replaced with a more general which outcome-question to ascer-tain whether, even under these circumstances, people are prompted to make choices that deviate from those sug-gested by the quantitative translation approach.
1.4
Is the Which Outcome (WO) effect
lim-ited to verbal probabilities?
The WO effect was demonstrated with modals (i.e.,will
andcan; Teigen & Filkuková, 2013) and with positive and negative probability terms (e.g.,a chanceandnot cer-tain; Teigen et al., in press; Teigen et al., 2013). In their concluding comments, Teigen et al., (in press) speculated that the effect observed so far with linguistic materials might be extended to uncertainty communication in gen-eral. This hypothesis entails that the WO effect could be observed with numerical probabilities as well. In agree-ment with this possibility, results of Sirota and Juanchich (2012) show that even numerical probabilities can be terpreted as pragmatic devices to soften bad news, an in-terpretation that was previously believed to be limited to verbal probabilities (Bonnefon & Villejoubert, 2006; Juanchich, Sirota & Butler, 2012). Yet other pieces of evidence support that verbal probabilities are more influ-enced by pragmatic considerations. For example, Winds-chitl and Wells (1996) posited that verbal probabilities are governed by associative processes (and thus more sensi-tive to contextual influences), whereas numerical proba-bilities are more rule based.
In Experiment 4 we asked the WO-questions based on numerical rather than verbal probabilities. Participants were asked which outcome is most appropriate to com-plete a statement such as “There is around a 10% [50%; 90%] chance that a battery of the brand Comfor will last for . . . .. hours”. A literal interpretation of a 10% prob-ability would require that the lowest outcome in the dis-tribution is selected (which occurs in exactly 10% of the cases), whereas the WO effect suggests answers in the high end of the distribution, as these are most often
cho-sen in the verbal probability studies as examples of an “unlikely” outcome. As numerical probabilities encour-age an analytic, mathematical mode of thinking, rather than a pragmatic approach, this could be a boundary test of the WO effect under circumstances not in its favour.
2
Experiment 1
Teigen and Filkuková (2013) showed that the completion ofcanandwillsentences (e.g., a battery can last for ... hours) were related to specific scalar modifiers (i.e.,up to
andat least). The completion of sentences with a differ-ent outcome in the Which Outcome task may be based on a different perception of the questions. For example, peo-ple asked to compeo-plete thecertainsentence may think that it is about providing the minimum outcome that could occur, the larger outcome entailing this one. On the other hand,possible, ascan, could be interpreted as a question focusing on the maximal outcome that could occur.
2.1
Method
In a pre-test designed for the present studies, two classes of Norwegian undergraduate psychology students (N= 43) were asked to estimate the probabilities speak-ers would have in mind when saying “It is possible1 [certain2; not certain3] that the laptop battery will last 3
hours” (along with six other verbal expressions). In this context, which comes close to the vignettes used below,
possible was given a mean probability value of 52.6% (SD = 17.9), certain received a mean score of 92.1% (SD = 14.7), and not certain a mean score of 48.1% (SD= 20.1).
Participants. A total of 50 participants from
Ama-zon Mechanical Turk completed the web questionnaire (Buhrmester, Kwang & Gosling, 2011; Paolacci, Chan-dler & Ipeirotis, 2010). The sample included 40% females and had a mean age of 33.18 years (18-65,
SD = 12.80). Most participants were White Caucasian (88%) and had a higher education (86%).
Materials and Procedure. Participants read vignettes
describing the frequency of outcome magnitudes, for ex-ample different battery durations (in hours) or different weight loss (in pounds) after following a diet. In each vignette the frequency distribution of the outcome mag-nitudes was presented as a bell shaped bar chart similar to the one depicted in Figure 1.
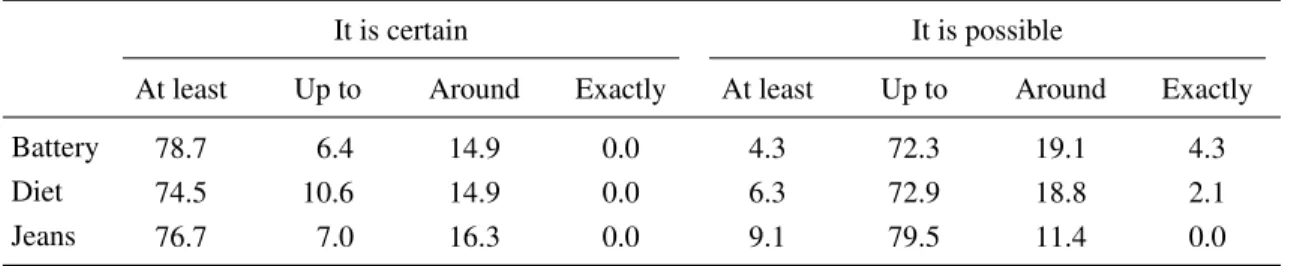
Table 1: Choices (percentages) of modifiers to complete statements about three different products based on two differ-ent verbal probabilities (It is certain and It is possible), Experimdiffer-ent 1.
It is certain It is possible
At least Up to Around Exactly At least Up to Around Exactly
Battery 78.7 6.4 14.9 0.0 4.3 72.3 19.1 4.3 Diet 74.5 10.6 14.9 0.0 6.3 72.9 18.8 2.1 Jeans 76.7 7.0 16.3 0.0 9.1 79.5 11.4 0.0
We used the vignettes Computer battery, Jeans shrink-age, and Diet developed by Teigen and Filkuková (2013). Only the vignette Diet was adapted by providing a uni-modal and bell shaped bar chart instead of a table. Partic-ipants read the vignettes presented on different pages and in a single order. The vignettes featured acertainand a
possiblesentence to be completed, presented on the same page and in a randomised order.
The completion of the sentence was done by a drag and drop process, from a box containing four modifiers: at least, exactly, about, and up to, and the five numerical outcomes described in the distribution of outcomes. The completion instructions read as follows:Please, complete each sentence below with the number that seems most natural in this context. You may also add one of the sug-gested words (at least, around, exactly or up to) if you feel this could improve the sentence.
For example, in the Battery vignette, participants were asked to complete the following sentence: “it is certain that the battery will last _ _ _ _ _ _ _ hours”, after read-ing a distribution of battery durations rangread-ing from 1.5 to 3.5 hours by increments of 0.5 hour. The drag and drop completion task featured the following list organised in a column and always presented in this order: at least, ex-actly, around, up to, 1.5 hours, 2 hours, 2.5 hours, 3 hours, 3.5 hours. The material is available in Appendix A.
2.2
Results
Outcome value selection. Between 76% and 80% of
the participants completed the certain sentence with the minimum outcome value, whereas between 73% and 77% chose a maximum value to describe a possible out-come. As each scenario contained different ranges of nu-merical outcomes (e.g., in the battery scenario, the range was 1.5-3.5 hours, while in the diet scenario it was 10-18 pounds), we recoded in each case the lowest value as 1, the second lowest as 2, and so on. Therefore, an out-come of 3 represents the middle value, which was also the peak of the distribution and its most likely outcome value, whereas scores of 1 and 5 represent the bottom and top tail outcomes, respectively. Mean scores close to
5 indicate that participants chose outcomes towards the upper end of the distribution, while a mean score closer to 1 indicates choices towards the lower end of the distri-bution.
We ran a 3 x 2 within-subjects analysis of variance (ANOVA) on the recoded scores with scenario (battery, diet, and jeans) and probability term (certain and pos-sible) as withparticipants factors. The ANOVA in-dicated no main effect of the scenario, F(2,94) = 1.26,
p = .290, but a main effect of the probability term,
F(1,47) = 146.85,p <.001,η2p=.78. Participants
com-pleted the sentences with certain more often with val-ues towards the lower end of the distribution (M =1.59,
SD =1.06), and the sentences with possible more of-ten with values towards the upper end of the distribu-tion (M = 4.40, SD = 0.97). Finally, there was no in-teraction between the scenario and the verbal probability,
F(1,47) < 1,p =.586 (lower bound adjustment).
Modifier selection. Participants provided modifiers for
most of the vignettes (in 88% to 98% of the cases). Cases where participants provided a combination of modifiers were excluded (e.g., around up to; at least around up to). As indicated in Table 1, participants completed the cer-tainstatement with a modifier stressing the lower bound of an interval (i.e., at least), showing that participants in-terpret thecertainsentence completion as indicating the minimum outcome that can occur in the future. In con-trast, participants completedpossiblewith a majority of modifiers describing the upper bound of an interval (i.e., up to).
We ran analyses of frequencies to investigate the ef-fect of verbal probability and vignette on scalar modifier selection. The analyses showed only an effect of verbal probability. When the verbal probability was certain, the sentence was more often completed with the modifier at least (70% of choices accross scenarios), but when it was possible, it was more often completed with up to (69% of choices across scenarios). The effect of the verbal proba-bility was significant in all of the three scenarios (respec-tively in the Battery, Jeans, and Diet vignettes:χ2(4, N =
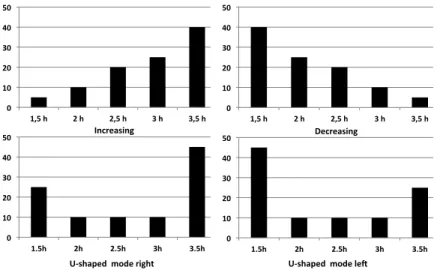
Figure 2: Examples of distributions of outcomes that are monotonically increasing and decreasing (Experiment 2) or U-shaped with mode to the right or to the left (Experiment 3).
!" #!" $!" %!" &!" '!"
#('")" $")" $('")" %")" %('")"
!" #!" $!" %!" &!" '!"
#*')" $)" $*')" %)" %*')"
+,-./012,3"
!" #!" $!" %!" &!" '!"
#('")" $")" $('")" %")" %('")"
!" #!" $!" %!" &!" '!"
#*')" $)" $*')" %)" %*')"
4/-./012,3"
561)07/8""9:8/";/<" 561)07/8""9:8/".23)="
= 50.09,p< .001, Cramer’s V = .71;χ2(4, N = 100) =
50.90,p< .001, Cramer’s V = .71). There was no effect of the scenario when the verbal probability was certain (χ2(6, N = 150) = 3.42,p= .755, Cramer’s V = .11) or
when it was possible (χ2(8, N = 150) = 6.44, p= .598,
Cramer’s V = .15).
These results replicate the effect of verbal probability on outcome selection shown by Teigen et al. (in press), in-dicating thatcertaintywas associated with unlikely small outcomes (frequency of 5%) whereaspossiblewas asso-ciated with equally unlikely maximum outcomes. The present results further show that the pattern of outcome association is related to the perception of an implicit spe-cific modifier. Certainty is associated with lower bound range modifier (at least) whereaspossiblewas most often associated with higher bound range modifier (up to).
3
Experiment 2
When people are asked to select acertainoutcome from a unimodal, bell-shaped distribution of outcomes (see Fig-ure 1) they often choose the lowest one, or alternatively, the most frequent middle score. As shown in Experi-ment 1, when they are asked to pick apossibleoutcome they regularly choose the highest value (Teigen et al., in press), despite the fact that outcomes in both tails of the distribution are infrequent and hence quite unlikely. The present experiment was designed to investigate whether this phenomenon could be replicated with monotonic dis-tributions. In monotonically increasing distributions the lowest score is least frequent, whereas the highest score is most frequent. In contrast, in a monotonically decreasing distribution the lowest value is the most frequent, whereas the highest value is least frequent as illustrated by the
dis-tributions in the top panel of Figure 2. If extremeness is a decisive factor, people will continue to describe low val-ues ascertainand high values aspossible, regardless of the shape of the distribution. If, on the other hand, out-come frequencies are important then the response pattern might change. So for instance, if the phrase “it is pos-sible” suggests a low probability, participants should be more inclined to select an outcome in the lower than in the upper end of the distribution like the one depicted in the left panel of Figure 2. Conversely, if “certain” is in-fluenced by outcome frequency, they might switch their outcome preferences from low and middle to high values.
3.1
Method
Participants. Students following an introductory class
at the University of Tromsø, Norway served as partici-pants; N = 59 (89.8% female, 2 did not report gender; median age 20 years). They were randomly assigned to one of two conditions, one with decreasing and the other with increasing distributions.
Design, Materials and Procedure. All
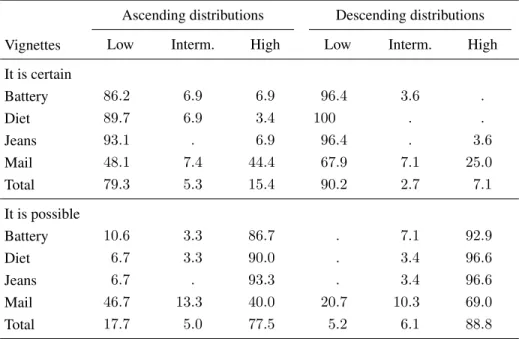
Table 2: What will certainly and what will possibly happen? Choices (percentages) of low, intermediate, and high numbers in statements about four different products based on monotonically increasing and decreasing distributions, Experiment 2.
Ascending distributions Descending distributions
Vignettes Low Interm. High Low Interm. High
It is certain
Battery 86.2 6.9 6.9 96.4 3.6 .
Diet 89.7 6.9 3.4 100 . .
Jeans 93.1 . 6.9 96.4 . 3.6
Mail 48.1 7.4 44.4 67.9 7.1 25.0
Total 79.3 5.3 15.4 90.2 2.7 7.1
It is possible
Battery 10.6 3.3 86.7 . 7.1 92.9
Diet 6.7 3.3 90.0 . 3.4 96.6
Jeans 6.7 . 93.3 . 3.4 96.6
Mail 46.7 13.3 40.0 20.7 10.3 69.0
Total 17.7 5.0 77.5 5.2 6.1 88.8
each vignette, one containing the term certain and an-other with the termpossible,(e.g., “it is possible [certain] that the battery will last for .... hours”). Half of the par-ticipants received the statements withpossiblebefore the
certainstatements, and the other half completed the state-ments in the reverse order.
Half of the participants read distributions of outcomes that were monotonically increasing, with the lowest value as the least frequent one and the highest value as the mode, and the other half read decreasing distributions that dovetailed the increasing version. The vignettes and their associated distributions are presented in Appendix B. This study therefore featured a 4 x 2 x 2 mixed de-sign, with the four vignettes and the two probability terms within-subjects and the shape of the distribution between-subjects.
3.2
Results
Responses from all vignettes were coded in three cate-gories as low (minimum outcome), high (maximum out-come) and intermediate (all scores in between). Results displayed in Table 2 show that most participants preferred to describe acertainoutcome with the bottom value of the distribution and apossibleoutcome with the maximum value of the distribution, both for ascending and descend-ing distributions. For example, about 90% of the partic-ipants judged that it wascertain that the battery would last 1.5 hours, whereas a similar percentage judged that it
waspossiblethat it would last 3.5 hours, given a distribu-tion in which a sample of batteries lasted from 1.5 to 3.5 hours.
A mixed-design variance analysis was conducted, to test the effect of the verbal probability, distribution and vignette on outcome selection. The analysis showed that verbal probability had an effect on outcome selection (F(1, 52) = 254.44,p < .001 , η²p = .83). The vignette
did not produce a main effect (F(3, 156) < 1), nor an interaction with the distribution shape (F(3, 156) < 1). Vignette was interacting with verbal probability (F(3, 156) = 22.90,p <.001 ,η²p = .31). This interaction is
due to mail vignette where participants did not select the same outcomes as in the other vignettes. The deviant re-sponse pattern of this vignette has been previously ob-served (Teigen et al., in press) and was presumed to be caused by the fact that the outcome dimension in this vi-gnette is bi-directional. Indeed the time it takes for a letter to go from Norway to the United-States can be construed in terms of quickness or in terms of delay, therefore cre-ating a bimodal preference for either the fastest delivery (i.e., minimum outcome value) or the longest delay (i.e., maximal outcome).
(F(1, 52) = 6.10,p= .017 ,η²p= .10). However, the
gen-eral conclusion to be drawn from these patterns of results is that the tendency to describe low values ascertainand high values as possibleis not uniquely dependent upon one particular distribution of outcomes.
These results support the view that preference for max-imum outcomes to describe possibility is not determined by their frequency of occurrence. Ifpossible was asso-ciated with rare outcomes, like in the previous studies, we would have expected a shift of responses toward the low end of the distribution in the ascending series. How-ever, participants continued to select maximal values as the possible ones, even when they were also most fre-quent. This preference was weaker in the mail context, which has an ambiguous underlying dimension, where both lowest values (i.e., how fast the mail takes) and high-est values (i.e., how long it takes) can be perceived as top achievements (for ambiguous dimensions, see Teigen et al., in press, Study 3). The valence of the outcome de-scribed did not appear to modify participants’ preferences for outcome magnitude.
Participants in the present experiment associated cer-tainty almost exclusively with the lowest value, regard-less of its frequency. Even in the ascending distribu-tion the maximum value was rarely selected, although it was the most frequent outcome of the distribution. This pattern is more conspicuous in the present results than for the bell-shaped distributions used previously and con-trasts sharply with predictions based on the probabilistic translation approach, where the most probable outcome would also be expected to be the most certain. How-ever, the present results are compatible with a directional, scalar interpretation of numerical magnitudes where low outcomes are entailed by higher ones. For outcomes or-dered on such a scale it makes sense to say that a battery of this brand will certainly last forat least1.5 hours (and probably longer) because before lasting 3 hours, a battery has indeed lasted for 1.5 hours.
4
Experiment 3
Experiment 2 demonstrated that participants associate
certain with the lowest outcome and possible with the highest outcome in a monotonically increasing or de-creasing distribution, replicating earlier findings based on unimodal symmetrical distributions (Teigen et al., in press). In Experiment 2, extreme outcomes were ei-ther the least or the most frequent, thus implying fre-quency extremeness. The rarity, or conversely, the high frequency of occurrence of the outcome may have con-tributed to steer participants in selecting these outcomes, as both low and high extreme likelihoods are more infor-mative than middle ones (Keren & Teigen, 2001).
Ex-periment 3 was designed to replicate these findings us-ing bimodal, U-shaped distributions as shown in the bot-tom panel of Figure 2, where the middle outcomes are the least frequent.
Moreover, in Experiment 2, statements about what is certain and what is possible were completed by the same participants. This might have contributed to po-larizing participants’ assessment of these two terms, in line with findings suggesting that people tend to exagger-ate the difference between concepts they are asked about in a joint presentation format, compared with their as-sessment of the same concepts presented on separate oc-casions (Schwarz, 1999). To control for this effect, in the present experiment assessments of certain and pos-sible outcomes were performed separately in a between-subjects design. Finally, to avoid a potential influence of outcome valence, one presumably neutral “nonsense” or “utility free” vignette was included in the set, replacing the ambiguous Mail vignette.
4.1
Method
Participants. Psychology students from the University
of Birmingham (UK) took part in this experiment in ex-change for course credits,N = 102 (81.1% females, me-dian age: 19 years). Participants were randomly allocated to four different conditions.
Design, Materials and Procedure. In a 2 (Probability
term) x 2 (Mode location) x 4 (Vignette) mixed design, participants read the Battery, Jeans, and Diet vignettes previously used (see Vignettes 1-3 in Appendix B) and the new Shmulp (utility free) vignette (described as Vi-gnette 5 in Appendix B). The utility free viVi-gnette was composed with fantasy outcomes in a non-existing con-text. This vignette aimed to test whether the reference for minimum or maximal outcomes was derived from infor-mation about the utility of the outcomes. If this was the case, the preference for minimum or maximal outcome should not be observed in this vignette. The probability term and the mode location of the distribution were ma-nipulated in between-subjects.
In each vignette the distribution of outcome values was presented by means of a bar chart featuring a U-shape with two peaks, the highest being located either to the left or to the right (as in the bottom panel of Figure 2). In all vignettes participants were asked to complete one state-ment describing either a “possible” or “certain” value (e.g., “it is possible that the battery will last ... hours”).
4.2
Results
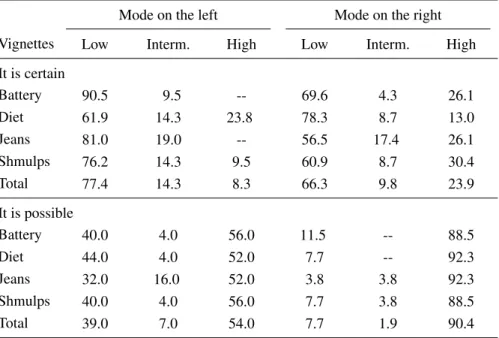
partici-Table 3: What will certainly and what will possibly happen? Choices (percentages) of low, intermediate, and high numbers in statements about four different products, for U distributions with the mode located either on the left or on the right (N=95), Experiment 3.
Mode on the left Mode on the right
Vignettes Low Interm. High Low Interm. High
It is certain
Battery 90.5 9.5 -- 69.6 4.3 26.1 Diet 61.9 14.3 23.8 78.3 8.7 13.0 Jeans 81.0 19.0 -- 56.5 17.4 26.1 Shmulps 76.2 14.3 9.5 60.9 8.7 30.4 Total 77.4 14.3 8.3 66.3 9.8 23.9
It is possible
Battery 40.0 4.0 56.0 11.5 -- 88.5
Diet 44.0 4.0 52.0 7.7 -- 92.3
Jeans 32.0 16.0 52.0 3.8 3.8 92.3 Shmulps 40.0 4.0 56.0 7.7 3.8 88.5 Total 39.0 7.0 54.0 7.7 1.9 90.4
pants with answers in each scenario, to be taken into ac-count in the analysis. Remaining values were recoded as low, intermediate, and high, as in previous experiments. Answers outside the distribution range, if not outliers, were recoded as either low or high values (3 in the battery vignette, 4 in the diet vignette, 3 in the jeans vignette, and 11 in the Shmulp vignette).
Results displayed in Table 3 show that most of the par-ticipants preferred describingcertainoutcomes with the bottom values of the distributions. However this trend was more pronounced when the mode of the distribution was low (on the left) than when it was high (on the right). For example, 92% of the participants judged that it was certain that the battery would last 1.5 hours, given a dis-tribution in which the mode was 1.5 hours, whereas 67% judged that it was certain that it would last 1.5 hour, given a distribution in which the mode was 3.5 hours.
In contrast, most of the participants describedpossible
outcomes with the maximum value of the distribution. Again, this trend was more pronounced when the mode of the distribution was high (on the right) than when it was low (on the left). For example, 89% of participants judged that it was possible that the battery would last 3.5 hours, given a distribution in which the mode was 3.5 hours, whereas 54% judged that it was possible that it would last 3.5 hours, given a distribution in which the mode was 1.5 hours.
For the purpose of the analysis of variance, low an-swers were given a value of 1, intermediate anan-swers re-ceived a value of 2 and high answers were given a value
of 3. The main and combined effects of the probability terms (i.e., possible vs. certain) and of the mode location (i.e., left vs. right) on outcome preferences were tested by a 4 (vignette) x 2 (verbal probability) x 2 (distribution) mixed design variance analysis.
Overall, the vignettes had no effect on the magnitude of the answer, (F(3, 273) < 1, p = .358; lower bound adjustment). The analysis revealed a main effect of the location of the modal value on the outcome preference (F(1, 91) = 12.86,p = .001 ,η²p = .12) and a main
ef-fect of the probability term on the outcome magnitude (F(1, 91) = 63.20, p < .001 , η²p = .41). The
analy-sis did not reveal an interaction between the probabil-ity term and the location of the modal value or between the probability term and the vignette (respectively,F(1, 91) = 2.43,p= .122 andF(3, 273) < 1,p= .564 ). There was no significant interaction between the location of the modal value and the vignette (F(3, 273) = 2.32,p= .076,
η²p = .03). There was an interaction between the
prob-ability term, the location of the modal value and the vi-gnette (F(3, 273) = 4.36,p = .005,η²p = .05). This
in-teraction may illustrate that in thecertain Diet vignette the preference for the minimal outcome was reinforced when the mode was on the right whereas in all the other vignettes this preference was reinforced when the mode was on the left.
contrasted withcertainin a within-subject design such as in Study 2. Moreover, the effect seems not to be utility dependent as it also was found in the Shmulp vignette, which describes a non-existent entity with nonsense out-come values (Shmulps can have different numbers of Glomps). In the Shmulp context it is hence difficult to claim that extreme outcomes are preferred because they are considered more (or less) useful than middle ones. Finally, results based on the U-shaped distributions sug-gest that the preference for extreme outcome values is not caused by the shape of the distribution, although partic-ipants preferred the extremes that were also most likely. This applies both to certain andpossible. Bottom out-comes are more certain when they are frequent, and sim-ilarly, maximum outcomes are more possible when they are also the most frequent ones.
5
Experiment 4
Experiments 1, 2 and 3 confirmed previous findings (Teigen et al., in press) that people typically complete
possible statements with extreme outcome values, and disregard outcomes in the middle range. Moreover, re-sults indicate that extreme outcomes were selected to qualifypossibleorcertainirrespective of whether those outcomes were the least, the most or only moderately likely. Building on these findings, we can assume that the extremeness of the outcomes in itself may be partly responsible for the preference for maximal and minimal outcome in the outcome completion task. To test the role of outcome quantitative extremeness the next experiment features outcomes that cannot be ordered on a quantita-tive dimension.
In Experiment 4 participants were presented with fre-quency distributions of multiple categorical outcomes (e.g., the distribution of red, black, white, and grey cars), which cannot be ordered according to magnitude. For ex-ample, a black car cannot be ranked as surpassing cars of a different colour, and does not imply the previous occur-rence of a red one in the same way that a battery lasting 3.5 hours implied that the battery has also lasted for 1.5 hour. In categorical outcome distributions, it makes less sense to speak of maximum or minimum scores, and the concept of outcome extremeness is not applicable, unless redefined. This could be obtained by ordering categories from least to most frequent, or the other way around, from common to rare.
Three verbal probabilities will be examined here: It is possible, it isentirely possible and it is not certain. Ifpossibleis still associated with “maximum scores”, it would now be expected to be used to characterize either the most frequent or the least frequent category, as op-posed to the intermediate ones. The emphatic expression
entirelymight be expected to magnify the tendency to as-sociatepossiblewith a highly probable outcome, but from a conversational perspective,entirelycould rather call at-tention to the occurrence of a relatively improbable out-come. Finally, the phrasenot certainis, by definition, ap-plicable to all outcomes that have a probability of occur-rence below 1.0. However, for magnitude distributions, Teigen et al. (in press) found thatnot certainstatements were primarily associated with maximum or middle out-comes, rather than low ones. In other words,not certain
differs frompossibleby being applicable to intermediate values, but was similar in the sense that high extremes were preferred to minimum scores. For categorical out-comes, as in the present study, it remains an open ques-tion whethernot certainwill be associated with the most frequent category, the least frequent category (which both can be regarded as “top” scores, albeit on different dimen-sions) or categories in the intermediate range.
The verbal probabilitycertainwas not used here as the
at leastinterpretation does not apply to categorical vari-ables, and none of the outcome categories were compre-hensive enough to be regarded ascertain. Participants would accordingly feel that the task of picking acertain
outcome to be a meaningless one. In contrast, all cate-gories with a non-zero probability of occurrence would in principle bepossibleas well asnot certain.
5.1
Method
Participants. Students from the University of
Birming-ham (UK) took part in the experiment on the internet in exchange for course credits,N= 98 (89.8% females, me-dian age: 19 years). Participants were randomly allocated to three conditions with 32-34 participants in each.
Design, Materials and Procedure. The participants
read four vignettes presented in randomized order, and for each vignette they completed a statement starting with either “it is possible that . . . ”, “it is entirely possible that . . . ” or “it is not completely certain that . . . ”. Partici-pants completed the statement with the categorical out-come they judged most appropriate.
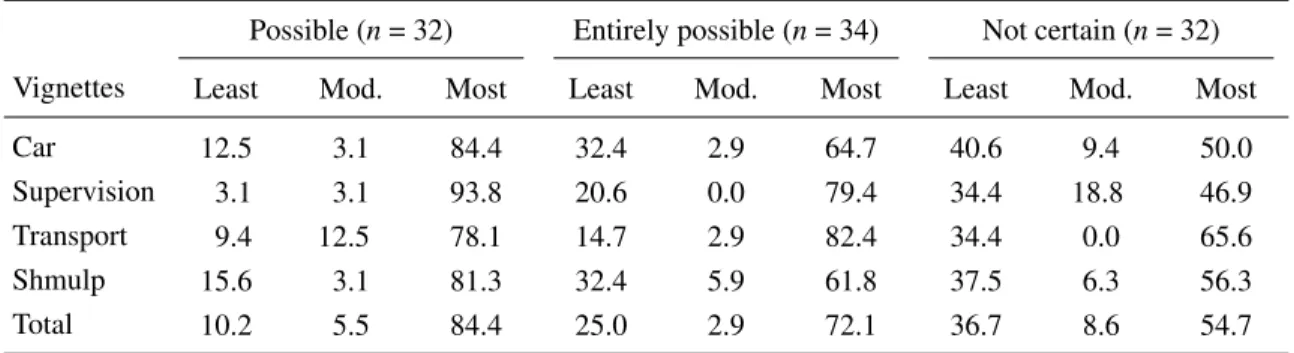
Table 4: Percentages of participants choosing the least frequent, moderately frequent or most frequent category to describe a possible, an entirely possible or a not certain outcome, Experiment 4.
Possible (n= 32) Entirely possible (n= 34) Not certain (n= 32) Vignettes Least Mod. Most Least Mod. Most Least Mod. Most
Car 12.5 3.1 84.4 32.4 2.9 64.7 40.6 9.4 50.0 Supervision 3.1 3.1 93.8 20.6 0.0 79.4 34.4 18.8 46.9 Transport 9.4 12.5 78.1 14.7 2.9 82.4 34.4 0.0 65.6 Shmulp 15.6 3.1 81.3 32.4 5.9 61.8 37.5 6.3 56.3 Total 10.2 5.5 84.4 25.0 2.9 72.1 36.7 8.6 54.7
infer an outcome preference based on their order of pre-sentation. The order of presentation did not affect the par-ticipants’ preferences and will not be discussed further.
In addition to the car vignette described above, two vignettes illustrated real life situations (Supervision and Transport) and the final vignette used a nonsense con-text (Shmulps). In the Supervision vignette a teacher is wondering whether she would tutor a student attending program A (10%), B (20%), or C (70%). In the Trans-port vignette a man is guessing whether his wife would go to work the next day by car, bus, or bike. Finally, in the Shmulp vignette, participants read that shmulps are of three kinds: gelering (10%), laurding (20%) or glimpsing (70%). The vignette was introduced as follows: Please read the following vignette; don’t worry if you do not un-derstand the meaning of some words. Try to complete the statement with the expression that sounds most appropri-ate given the context. The complete set of vignettes is presented in Appendix C.
5.2
Results and Discussion
Choice distributions are presented in Table 4. The car vignette (Car) involved a choice among four options. For this vignette, the selections of the two “moderately frequent” categories were pooled together. The three other vignettes involved a choice between three cate-gories (e.g., students from programme A, B, or C in the Supervision vignette). In the table, the categories are or-dered according to size from least to most frequent.
As depicted in Table 4, most participants completed the statements with the most frequent outcome across all the conditions and vignettes (from 46.9% to 93.8%). Nevertheless, some participants chose the least frequent outcome to describe apossibleoutcome (10.15%). This preference was magnified by the more colloquial en-tirely possiblestatement, for which one participant in four chose the least frequent outcome. It was speculated that this more emphatic expression would fit a conversational
context where it is important to announce that this out-come, despite its rareness, should not be overlooked. Fi-nally, more than one in three participants chose the least likely outcome to describe anot certainoutcome.
Overall, only around 5% of the participants chose the intermediate outcome, even if the frequency of this out-come (20-30%) should be within the range of probabili-ties corresponding tonot certainandpossible, according to probabilistic translation studies (Brun & Teigen, 1988). The main and interaction effects of the probability terms (i.e., possible, entirely possible, not certain) and of the vignettes on outcome choices were tested with a mixed-design variance analysis. The order of presenta-tion of the categorical outcome (i.e., increasing vs. de-creasing order) was also included as an independent vari-able. The tests of between-subjects effects revealed a main effect of the probability term on the outcome pref-erence,F(2, 92) = 6.07,p= .003 ,η²p = .12. The order
of presentation of the categorical outcome did not affect participants’ preference, (F(1, 92) < 1), nor did it inter-act with the probability term (F(2, 92) < 1). The proba-bility term and the vignette did not interact significantly (F(6, 276) = 1.88,p= .085 ,η²p = .04). There was also
a main effect of the vignette on the outcome choice,F(3, 276) = 17.49,p< .001 ,η²p= .16. This was related to a
stronger preference for the most frequent outcome in the supervision and the transport vignettes.
Participants appear to have avoided moderately fre-quent outcomes and preferred the least and most frefre-quent ones. Most of the participants chose to describepossible,
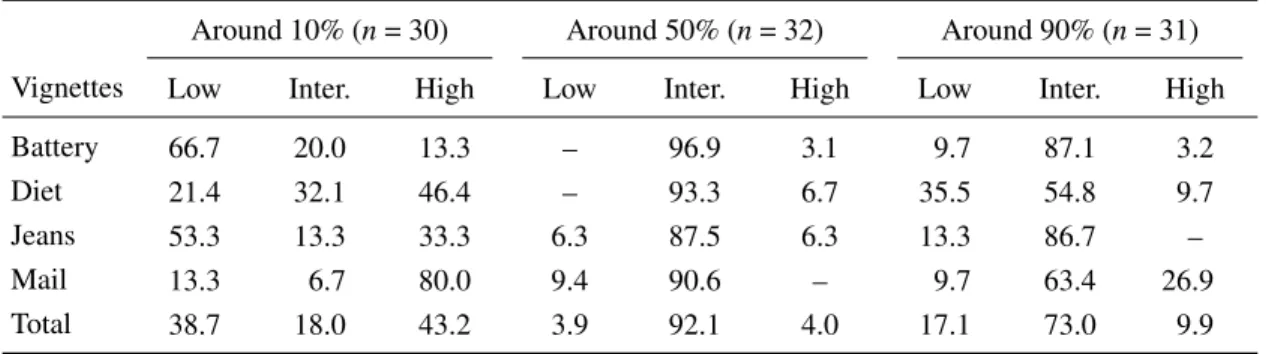
Table 5: Choices (percentages) of low, intermediate and high outcome values for predictions featuring a 10%, 50% or 90% probability, Experiment 5.
Around 10% (n= 30) Around 50% (n= 32) Around 90% (n= 31) Vignettes Low Inter. High Low Inter. High Low Inter. High
Battery 66.7 20.0 13.3 – 96.9 3.1 9.7 87.1 3.2 Diet 21.4 32.1 46.4 – 93.3 6.7 35.5 54.8 9.7 Jeans 53.3 13.3 33.3 6.3 87.5 6.3 13.3 86.7 – Mail 13.3 6.7 80.0 9.4 90.6 – 9.7 63.4 26.9 Total 38.7 18.0 43.2 3.9 92.1 4.0 17.1 73.0 9.9
numeric translations of possible. In contrast, a larger pro-portion of individuals felt drawn toward the least likely outcome, which had an occurrence frequency of only 5-10%. Fornot certainthe least likely outcome was chosen even more frequently. This could be explained by differ-ent membership functions for negative than for positive probability expressions (Budescu, Karelitz & Wallsten, 2003), but even the membership approach would find it difficult to explain the absence of intermediate outcomes, as membership curves are consistently drawn as single-peaked (cf. Dhami & Wallsten, 2005, Figure 3).
6
Experiment 5
This study aimed to test whether the results of the new ap-proach also applied to numerical probabilities or whether numerical probabilities were associated with outcomes according to strict quantitative rules. We studied which of the outcome values taken from a bell-shaped distribution participants associated with three numerical probability magnitudes: around 10%, around 50%, and around 90%. The term “around” was used to relax impossible proba-bilistic constraints (e.g., associating a 50% probability to a 40% probable outcome).
Based on the new approach findings, we expect low and moderate probabilities (10% and 50%) to be associ-ated with maximum outcome values (in agreement with low and moderate verbal phrases, such as unlikely, a chance, and possible), whereas 90% could be expected to suggest minimum values (likecertain). On the other hand, the probabilistic translation approach predicts that low probabilities will be associated with extreme out-come values (e.g., low or high), whereas 50% and 90% probabilities will be associated with intermediate values that are also the most frequent.
6.1
Method
Participants. Altogether 94 participants were
re-cruited through Amazon Mechanical Turk (53.6% fe-male; median age: 30 years, age range: 18-63 years). Most of the participants were in work (69.2%) and had higher education experience (83.6%). Three participants did not report their socio-demographic characteristics and two participants reported an impossible age (2 and 4 years old), which was considered a typo (or a joke). Partici-pants were randomly assigned to three different numeri-cal probability conditions (around 10%, around 50%, and around 90%). Participants with extreme scores (more than 3 standard deviations away from the mean) were ex-cluded, resulting inn= 32,n= 30, andn= 31 in Condi-tions 10%, 50%, and 90%, respectively.
Questionnaires. All participants completed a brief
web-questionnaire composed of the four vignettes (Bat-tery, Diet, Jeans, and Mail) used in Experiment 2, but with the original bell shaped outcome distributions shown in Figure 1. In each vignette participants read and com-pleted a numerical uncertainty statement (e.g., “there is around a 10% chance that a battery of the brand Com-for will last ... hours”). The vignettes were presented in a randomized order on separate web pages. The uncer-tain outcome was described with a probability of “around 10%”, “around 50%” and “around 90%” in three different versions of the questionnaire.
6.2
Results
Outcome values chosen by participants were recoded as low, intermediate and high values as in Experiments 1 and 2. The distributions of choices for each probability condition are shown in Table 5.
duration (67%), in agreement with the distribution per-centages (in this vignette, the minimum score was ob-tained by 10%, whereas the maximum score was only achieved by 5% of the batteries). For the other vignettes, both maximum scores and bottom scores were obtained by 1/10 of the samples. In the Jeans vignette participants preferred the lowest value, whereas they associated a 10% chance with the highest values to describe weight loss fol-lowing a diet, or the time a letter from Norway takes to ar-rive in the US. A large majority of the participants judged that a 50% chance and a 90% chance best characterised an intermediate value (92.9% and 80.0% respectively). For example a computer battery had a 90% chance to last 2.5 hours given that such batteries were previously found to last between 1.5 and 3.5 hours. Yet it is interesting to note that altogether, 27% of participants chose one of the (rare) extreme outcomes to describe a 90% chance. Of these, 63.3% chose the minimum outcome, in line with the How Much effect observed forcertainin the previous studies. Numerical probability magnitude had an effect on the outcome chosen in all the four vignettes (respec-tively in the Battery, Diet, Jeans, and Mail vignettes: χ²
(4, N = 93) = 50.89, p < .001, Cramer’s V = .52; χ²
(4, N = 89) = 33.31, p < .001, Cramer’s V = .43; χ²
(4,N= 92) = 48.40,p< .001,Cramer’s V = .51;χ² (4,
N= 93) = 69.80,p< .001,Cramer’s V= .61).
Overall, participants’ choices of outcome values were quite consistent with a literal interpretation of numeri-cal probabilities and appeared not to be affected by the WO effect. These results suggest that numeric and ver-bal probabilities are pragmatically different in the sense that verbal expressions corresponding to a moderate de-gree of certainty (possible,not certain) are typically as-sociated with the maximum extreme values, whereas a corresponding numerical probability (50%) is associated with outcomes in the middle range. A high verbal prob-ability (certain) can be given anat least interpretation, and hence be associated with low outcome values. The present results suggest that this makes less sense for a high probability expressed in numbers (90%).
7
General discussion
In studies conducted within the Which Outcome (WO) approach, participants are typically provided with a fre-quency distribution of outcomes (e.g., computer batter-ies which last between 1.5 and 3.5 hours) and asked to complete a verbal statement with the outcome value that sounds most appropriate (“It is possible that a computer battery will last ___ hours”). This question format re-vealed several WO-effects featuring (1) a preference for selecting outcomes in the tails of an outcome distribu-tion, (2) a preference for low end values to describe
cer-tain outcomes and outcomes that will happen, and (3) a preference of high end values forunlikelyand uncer-tainoutcomes,possibleoutcomes, outcomes that havea chanceof happening, or outcomes thatcanoccur (Teigen & Filkuková, 2013; Teigen et al, in press; Teigen et al., 2013). The objective of the present paper was to study the robustness of these effects and to test their lim-its with various distribution shapes, outcome types, and with numeric rather than verbal expressions of probabil-ity, thereby improving our understanding of the pragmat-ics of communication about uncertain events.
Results of five studies informed and specified the WO approach on four points.
First, the preference for a specific outcome goes to-gether with the preference for a scalar modifier. Possi-blepredictions are likely to be associated with the mod-ifier “up to” and with a maximal outcome, whereas cer-tainpredictions are most often associated with the mod-ifier “at least” and with a minimum outcome (Experi-ment 1). Secondly, a preference for extreme outcomes was not limited to symmetrical distributions. This find-ing indicates that extremes were not preferred because of their uniqueness; on the contrary, results from Experi-ment 2 and 3 show that extremes that were frequent were chosen more often than less frequent extremes. Thirdly, disregard for intermediate values could also be observed in a set of categorical outcomes (Experiment 4), where the most and the least frequent category were chosen more often than categories in the middle. Finally, the WO effects characteristic of verbal probabilities cannot be extended to uncertainty communication in general as a study conducted with numerical probabilities (Experi-ment 5) found that they are given literal (mathematical) rather than pragmatic interpretations.
7.1
Predictions and modifiers
Findings of Experiment 1 provided evidence that the term
possiblewas often associated with predictions of maxi-mum outcomes and was therefore often associated with a scalar modifier indicating an upper interval bound (i.e.,
up to).Certainwas often associated with a minimum out-come that had a low frequency of occurrence and was as-sociated with a scalar modifier indicating a lower interval bound (i.e.,at least). Interestingly, very few participants chose to use the termexactly(0-6%), although they were provided the frequentistic information that is deemed to be sufficient to make accurate predictions. These re-sults mirror well the findings of Teigen and Filkuková (2013) with the termscanandwill, as findings with pos-sibleandcertainwere very similar to findings withcan
prob-abilities (e.g., a chance, it is uncertain) and attempt to draw some regularities in people’s preferences. For ex-ample, further research could test whether the pattern of association between verbal probabilities and modifier de-pends on the average degree of certainty believed to be conveyed by the probability term: low or medium prob-abilities (e.g., can, possible) could be more often associ-ated with maximum outcome modifiers (i.e., up to) and very high degrees of certainty (e.g., will, certain) are as-sociated with minimum outcome modifiers (i.e., at least). These findings could have strong implications for pre-diction studies where a medium probability of an out-come occurrence is expected to convey the same infor-mation than the medium probability of the outcome non-occurrence. For example, in framing studies, the pre-diction “If Program C is adopted, 400 people will die” (Tversky & Kahneman, 1981) was originally assumed to be logically equivalent to “If Program A is adopted, 200 people will be saved” given a set of 600 people. Yet, participants may instead consider that savingat least200 people is not the same as havingat least400 people dy-ing. The non-equivalence between the different readings of the predictions was hypothesised by Mandel (2001), who showed that a complete description of the different outcomes (e.g., 200 are saved and 400 die) cancels the framing effect. Our present findings suggest that theat least interpretation would also hold for descriptions in-volving certainty, for instance “If Program A is adopted, 200 people will be saved for sure”.
7.2
Preference for extreme outcomes
When describing an outcome magnitude, participants chose maximum values to describe possible outcomes and minimum values forcertainoutcomes (Teigen et al., in press). These results hold even when the maximum value was the most likely and the bottom value the least likely. In Experiment 2, almost 90% of the participants chose to associatecertainwith the least likely outcome in apparent disregard of the quantitative meaning of what it takes to be certain. For example, in the computer bat-tery vignette, participants read that the batbat-tery could last from 1.5 to 3.5 hours, and that only 10 batteries out of the 100 tested lasted 1.5 hours. The WO effects also held in a between-subject design, where participants completed
possibleorcertainstatements with outcome values from skewed U-shaped distributions (Experiment 3). Also in this case, participants chose to complete certain state-ments with low scores andpossiblestatements with high scores, particularly when these scores belonged to the most frequent group of outcomes.
7.3
Preferences for large and small
cate-gories
When outcomes belonged to qualitatively different cate-gories (e.g., car colours), magnitude extremeness could not be used as a cue for choosing which outcome was
not certainorpossible. In this case, most participants se-lected categories most closely matching the probabilistic meaning of the probability term, choosing for example the most frequent outcome as the one believed to be (en-tirely) possibleandnot certain. Yet, the least frequent category was also selected by a substantial minority, who apparently felt this category more appealing than the in-termediate categories (which were almost never selected). This result suggests that some participants selected an outcome only based on its rarity. Rare events have in many contexts a special appeal, as testified by the old adage “praeclara sunt rara” (the extraordinary is rare), and by modern studies of thescarcity principle in con-sumer psychology (Ditto & Jemmott, 1989; Lynn, 1991).
7.4
The new approach does not apply to
nu-merical probabilities
No WO effect was found with numerical probabili-ties, which appeared to be given a frequentist inter-pretation; participants chose the outcome whose occur-rence matched most closely the probability communi-cated. Participants did not consider that a 90% probabil-ity should be associated with the minimum outcome, or that a 10% probability should be reserved for maximum values. Instead, 10% was used by a majority to describe the low tail of the distribution in the Battery and Jeans vignettes, which had exactly a 10% frequency of occur-rence, whereas values from the high tail of the distribu-tion were preferred in the Diet and Mail vignettes. Inter-estingly, these vignettes gave the outcome distributions in tabular form as whole numbers (1 of 10) rather than per-centages (10%), which could have made the probability matching strategy less salient.
Numerical probabilities appear here to have the advan-tage of not being subject to contextual (pragmatic) con-siderations that affect the interpretation of verbal prob-abilities. This result is in line with the suggestions and findings of Windschitl and Wells (1996) who proposed that numerical probabilities elicit rule based strategies whereas verbal probabilities rely more on associative pro-cesses.
knowing that a computer has a 10% chance to last 1.5 hours, participants could be less likely to say that this per-formance iscertainthan when based on frequency distri-butions.
7.5
Two interpretations of verbal
probabil-ities
When people are asked to translate verbal expressions into numerical probabilities, in accordance with the “how likely” approach,possibleandnot certainoutcomes are expected to be placed close to the midpoint of the prob-ability scale. In the pre-test reported in the introduction, only one participant suggested thatpossiblecould mean a 10% probability, and only three participants translated
not certainwith 10% or less. However, in a context of “which outcome” questions, we have seen that outcomes with a 10% probability are frequently selected as repre-sentative of possible as well as not certain events.
These results demonstrate that standard numerical “translations” (obtained by the How Likely approach) of verbal probabilities are not applicable to all contexts. One possible source of the discrepancy between the results of the How Likely and a Which Outcome task could be that participants given the “how likely” question have a di-chotomous outcome space in mind consisting only of the focal outcome and its complement (a battery lasting or not lasting in 3 hours), whereas those who are given the “which outcome” or “how much” questions are consider-ing multiple outcomes.
One may suggest that the WO findings are caused by a specific design of the tasks. For example, participants were not given the opportunity to choose a 100% certain outcome, as the most frequent outcome had only around a 50% chance of occurring. Participants, finding no al-ternative that by itself could be regarded as a certain out-come, may have chosen to redefine the task as a question about minimum outcomes. According to this interpreta-tion the WO effect would merely be the result of compli-ance with the response format, which forced participants to voice certainty in a situation where none of the out-comes is actually certain to occur.
However, several arguments can be marshalled against this view. First, if participants were reluctant to breach the probabilistic interpretation of verbal probabilities, they could choose one of the most likely outcomes (closer to 100%) instead of an unlikely bottom value. Note that participants associated the most likely outcome to a 90% numerical probability, suggesting that they were able to choose the outcome that best fitted a likelihood value. Second, the consistent preference for low val-ues rather than high ones suggests substantial agreement about which values can be consideredcertain, as opposed to those that are more appropriately labelledpossible.
Fi-nally, WO effects are also demonstrated forpossibleand in previous studies even for phrases likethere is a chance
orit is unlikely(Teigen et al., in press). These findings in-dicate that WO effects also occur where several outcome frequencies match the numerical meanings of the expres-sions and where people have the opportunity to select out-comes more consistent with the HL approach. The scope and robustness of the WO phenomena indicate that they cannot be dismissed as a purely methodological artefact. Instead, the WO phenomenon appears to rely on strong conversational habits.
7.6
Applied implications
Findings of the new approach highlight that risk and un-certainty communication is a process that is even more complex than expected.
Investigations applying the traditional probabilistic translation approach to verbal probabilities using “How Likely” methods have unveiled many potential risk com-munication problems. The recurrent between-subjects variability of the probability associated to different terms (e.g., Budescu & Wallsten, 1995) and their contextual de-pendence (e.g., Harris & Corner, 2011; Juanchich et al., 2012) represents two important and still unresolved chal-lenges. On top of this complexity, we now know that a forecaster may say that “it is certain that it will rain 2mm tomorrow”, despite knowing that this exact amount of precipitation is in fact unlikely. It is well known in lin-guistics that numerals are not always given an “exactly” interpretation, but that “at least” and “at most” readings are also possible (Levinson, 2000; Musolino, 2004). It is for instance acceptable to say: “John has three children, perhaps four”, indicating that the first mentioned number can be considered true even if he has four children. The present research adds to this analysis by showing that cer-tainis particularly suited to suggest an “at least” interpre-tation of scalar quantities. Compare the predictions A and B.
(A) Tomorrow we will have 2mm of rain.
(B) Tomorrow we willcertainlyhave 2mm of rain. Both forecasts A and B are ambiguous in the sense that they can mean that 2mm of rain is themost likelyamount of precipitation, or that the expected amount isat least
2mm of precipitation (and most likely more). Our results suggest that the “at least” interpretation is more compati-ble with statement (B) than with statement (A).