www.jped.com.br
ORIGINAL
ARTICLE
Food
consumption
of
children
younger
than
6
years
according
to
the
degree
of
food
processing
夽
Ediana
Volz
Neitzke
Karnopp
a,
Juliana
dos
Santos
Vaz
b,
Antonio
Augusto
Schafer
c,
Ludmila
Correa
Muniz
b,
Rosângela
de
Leon
Veleda
de
Souza
b,
Iná
dos
Santos
c,
Denise
Petrucci
Gigante
c,
Maria
Cecilia
Formoso
Assunc
¸ão
c,∗aUniversidadeFederaldePelotas(UFPEL),FaculdadedeNutric¸ão,ProgramadePós-graduac¸ãoemNutric¸ãoeAlimentos,Pelotas,
RS,Brazil
bUniversidadeFederaldePelotas(UFPEL),FaculdadedeNutric¸ão,Pelotas,RS,Brazil
cUniversidadeFederaldePelotas(UFPEL),DepartamentodeMedicinaSocial,ProgramadePós-graduac¸ãoemEpidemiologia,
Pelotas,RS,Brazil
Received16October2015;accepted6April2016 Availableonline5July2016
KEYWORDS
Foods; Nutrition; Child,preschool; Publichealth
Abstract
Objective: Toevaluatefoodintakeaccordingtothedegreeofprocessing,stratifiedbyfamily incomeandage,inarepresentativesample ofchildren youngerthan6yearsinthecityof Pelotas,RS,Brazil.
Methods: Cross-sectional population-based study carried out with 770 children aged 0---72 monthsofagelivingintheurbanareaofPelotas.Thedietaryintakeofchildrenwasassessed by24-hrecalladministeredtomothersorguardians.Theenergyintakewasestimatedandeach fooditemwasclassifiedaccordingtothefoodprocessingdegree.Foodconsumptionwas strati-fiedbyage(youngerthan24months;24monthsorolder)andassociationsbetweenquintilesof familyincomeandrelativecontributionofeachfoodtototalenergywereperformedbylinear regression.TheWaldtestwasappliedtotestlineartrendacrossgroups.
Results: Themeanenergyintakewas1725.7kcal/day.Themeancontributionofprocessedand ultraprocessedfoodswas19.7%amongchildrenyoungerthan24monthsand37%inthoseaged 24monthsorolder,whilethemeanconsumptionofnaturalandminimallyprocessedfoodwas 61%and44%,respectively.Among childrenaged24 months orolder, agreaterconsumption ofcannedfoods,cheeseandsweetswasobservedasfamilyincomequintilesincreased,while breadsweremoreconsumedbythosechildrenbelongingtothelowerincomequintiles.
夽
Pleasecitethisarticleas:KarnoppEV,VazJS,SchaferAA,MunizLC,SouzaRL,SantosI,etal.Foodconsumptionofchildrenyounger than6yearsaccordingtothedegreeoffoodprocessing.JPediatr(RioJ).2017;93:70---8.
∗Correspondingauthor.
E-mail:[email protected](M.C.Assunc¸ão).
http://dx.doi.org/10.1016/j.jped.2016.04.007
0021-7557/©2016PublishedbyElsevierEditoraLtda.onbehalfofSociedadeBrasileiradePediatria.Thisisanopenaccessarticleunder
Conclusion: Ahighcaloriccontributionofultraprocessedfoodsindetrimenttoalower con-sumptionofnaturalandminimallyprocessedfoodswasobservedinthedietofchildrenyounger than6years.
©2016PublishedbyElsevierEditoraLtda.onbehalfofSociedadeBrasileiradePediatria.Thisis anopenaccessarticleundertheCCBY-NC-NDlicense(http://creativecommons.org/licenses/ by-nc-nd/4.0/).
PALAVRAS-CHAVE
Alimentos; Nutric¸ão; Pré-escolares; Saúdepública
Consumoalimentardecrianc¸asmenoresdeseisanosconformeograu deprocessamento
Resumo
Objetivo: Avaliaroconsumoalimentarconformeograudeprocessamento,segundoarendae afaixaetária,emumaamostrarepresentativadecrianc¸asmenoresdeseisanosdeidadeda cidadedePelotas,RS.
Métodos: Estudotransversalconduzidocom770crianc¸asdezeroa72mesesresidentesnazona urbanadePelotas.Oconsumoalimentardascrianc¸asfoiavaliadoporrecordatóriode24horas, aplicadoàsmãesouresponsáveiseoconsumocalóricodosalimentosfoiestimadodeacordo comograudeprocessamento.Oconsumoalimentarfoiestratificadoporfaixaetária(menosde 24meses;24mesesoumais)easassociac¸õesentrerendafamiliareaparticipac¸ãorelativados alimentosnototaldecaloriasdiáriasforamconduzidasporregressãolinearsimples.Realizou-se testedeWaldparaavaliartendêncialinearentreosgrupos.
Resultados: Amédiadeconsumofoi1.725,7Kcal/dia.Aparticipac¸ãocalóricaprovenientedo grupodealimentosultraprocessadosfoide19,7%nascrianc¸ascommenosde24mesese36,1% naquelascom24mesesoumais,enquantoqueacontribuic¸ãodogrupodealimentosinnaturae minimamenteprocessadosfoide61,2%e44,1%%,respectivamente.Nascrianc¸ascom24meses oumais,observou-semaiorconsumodedocesconformeoaumentodarendafamiliar,enquanto que ospãesforam maisconsumidos entreascrianc¸aspertencentes aosmenores quintisde renda.
Conclusão: Observou-seelevadaparticipac¸ãocalóricadealimentosultraprocessadosem detri-mentoaomenorconsumodealimentosinnaturaeminimamenteprocessadosnaalimentac¸ão decrianc¸asmenoresde6anos.
©2016PublicadoporElsevierEditoraLtda.emnomedeSociedadeBrasileiradePediatria.Este ´
eumartigoOpenAccesssobumalicenc¸aCCBY-NC-ND(http://creativecommons.org/licenses/ by-nc-nd/4.0/).
Introduction
Interest on food consumption in childhood is increasing, considering that the formation of eating habits occurs in the early years of life.1,2 Inappropriate eating habits
at an early age can have negative effects in the short-and long-term, affecting the child’s physical growth and development3,4andrepresentingariskforobesityandother
complications.5---7
Inrecentyears,theprevalenceofoverweightand obe-sityhasincreasedconsiderablyintheBrazilianpopulation, accordingtodatafromtheFamilyBudgetSurvey(Pesquisa deOrc¸amentosFamiliares[POF])carriedoutin2008---2009. The numbers are alsoof concern regarding children aged 5---9 years, of whom 33.5% areoverweight and 14.3% are obese.8Thesubstitutionofhome-cookedandnaturalfoods
for processedfoods canbe oneof thefactorsresponsible for the high prevalence of excess weight observed in childhood, because these are high energy-density foods, high in fat, sugar, and sodium. Factors such as global-ization, accelerated pace of life, purchasing power, and women’s work outside the home can also contribute to thechangesthatoccurredintheeatinghabitsofBrazilian
families.9---11 Similarly, theinfluenceof marketing,through
advertisements,attractivepackagingandlabels,stimulates excessive consumption of industrialized goods, especially amongchildren.12---14
In2010,Monteiroetal.15proposedafoodclassification
basedonthe degreeandpurposeof foodprocessing.This classificationhasbeen recentlyupdatedand incorporated intotheFoodGuidefortheBrazilianpopulation,initslatest versionpublishedin2015.16 Thefirstgroupcomprises
Consideringtheearlyintroductionofprocessedand ultra-processedfoodsinchildren’sdiet,aswellasthefactthat lowconsumptionofraworminimallyprocessedfoodsmay have a negative impact on children’s health, this study aimedtoevaluatefoodintakeaccording tothedegree of foodprocessing,stratifiedbyincomeandagerange,ina rep-resentativesampleofchildrenagedlessthan6yearsfrom acityinSouthernBrazil.
Methods
Across-sectionalpopulation-basedstudywascarriedoutin thecity ofPelotas, state of RioGrandedo Sul,Brazil, in 2008,comprisinga temporalseriesoffoursurveysfroma studythataimedtoassesstheeffectoffortificationofwheat flourand corn mealon theoccurrence of anemia in chil-drenagedlessthan6 years.Methodologicaldetails ofthe study can be found in a previous publication.17 In the 40
studiedcensussectors,systematicallyselectedwith proba-bilityproportionaltosize,850childrenaged1---72months wereidentified.Therefore,799 children wereincluded in thestudy,representing94%ofthesample.Forthepresent study,childrenweregroupedbyagerange:youngerthan24 monthsand24monthsorolder.
The children’sfood intake wasassessed througha 24-h recall, appliedto mothers or tutors, ona weekdaynot subsequenttoSundaysandholidays, byateamof trained nutritionists.Onehundredandnineteenchildrenattended daycarecenters.Inthiscase, the24-hrecallwasapplied to caregivers, and was complemented by the mother or guardian.The homemeasurementsobtained fromthe 24-h foodrecall were transformed in gramsor milliliters for theanalysisoftheirnutritionalcomposition.Theuseof veg-etableoilwasstandardizedat15mLforeachsavorymeal.
The energy content of foods was analyzed with the ADSNutriprogram(ADSNutri(2006)NutritionalSystem, ver-sion 9.0; Brazil),18 using the Brazilian Food Composition
Table,19complementedbythetablefromtheUnitedStates
Department of Agriculture.20 For children who were still
breastfed,butalsoreceivedothertypesofmilkand/or com-plementaryfoods, the energycontribution of breast milk wascalculated.21
Subsequently, the consumed foods were classified into fourgroups according to thedegree and purposeof their processing, following the proposal of the Food Guide for theBrazilianpopulation.16 Group 1comprisednaturaland
minimally processedfoods (e.g., vegetables, fruits, roots andtubers,grains andcereals,legumes, dried fruits,and natural fruitjuices; nuts without saltor sugar,flours and meal, pasta, and fresh pasta; meats; fresh, pasteurized orultra-pasteurizedmilkor powdermilk;yogurt(nosugar added);eggs;andtea,coffee,anddrinkingwater).Group2 comprisedprocessed culinary ingredients (e.g., vegetable oils, butter, lard, and coconut oil; white, demerara or brownsugar;andrefinedorcoarsesalt).Group3comprised processedfoods(e.g.,cannedfoods,fruitinsyrupand crys-tallizedfruits,jams,driedmeatandbacon,cannedsardines andtuna, cheese), and group4 comprised ultraprocessed foods(e.g.,bread,cakesandbakedproducts,cookies,ice cream, chocolates, candies andsweets in general; cereal bars, breakfast cereals with added sugar, sweetened and flavoredyogurtanddairybeverages; energydrinks;frozen
and ready-to-heat foods [pasta, pizza, burgers], nuggets, frankfurters and sausages, and pre-prepared dishes and sauces; hydrogenated vegetable fat [margarine and hal-varine],chips;sauces;sweetandsavorysnacks;softdrinks andprocessedjuices; cannedmeatanddehydratedsoups; ready-made noodles; infant formula, complementary for-mula,andprocessedbabyfood;andartificialsweeteners). Somesocio-demographicinformationwereobtainedfrom themainstudyandusedascovariatesinthisanalysis:child gender,maternallevelofeducationinyears(upto4,5---8, 9---11,≥12years),andfamilyincomequintiles(obtainedby
thesumoftheincomeofallhouseholdmembers).
Initially,themeandaily energy(kcal)ingested by chil-drenandthecorrespondingstandarderrorwerecalculated. Thesameestimatewascalculatedaccordingtoquintilesof household income (first quintile, lowest income and fifth quintile,highestincome),inordertoidentifywhetherthe incomehasinfluenceonfoodconsumptionaccordingtothe degree of processing. At a second moment, the relative contribution of each of thefour groups in relation tothe totaldailyenergyestimationofeachchildwascalculated, aswellastheindividualrelativecontributionofeachfoodin relationtothetotalenergyestimate.Bothestimateswere analyzedaccordingtothequintilesofhouseholdincomeand stratifiedbyagegroup(<24monthsand24monthsofageor older).
DatawereanalyzedusingtheStataprogram(Stata Cor-poration,CollegeStation,version12.0;USA)usingthesvy commandinallanalyses,giventhecomplexityofthe samp-lingprocess,whichwascarriedoutinmultiplestages.The association betweenfamilyincomeandrelative participa-tionof eachfoodgroup intotalenergywasperformed by linearregression.Waldtestforlineartrendwasperformed toassessdifferencesbetweenthegroups.A5%significance levelwasassumedforallanalyses.
ThestudywasapprovedbytheEthicsCommitteeof Fac-uldadedeMedicinadaUniversidadeFederaldePelotas.An informedconsentwasobtainedfromthechildren’sparent orguardianpriortodatacollection.
Results
Of the 799 children included in the original study, 770 were assessed, as 29 were in exclusive breastfeeding. It wasobservedthat52%ofchildrenweremales,72.5%were agedlessthan24months,53%ofmothershaduptoeight years of schooling, and the mean family income was R$ 1326.00(medianofR$860.00).Themeandailyenergy con-sumptionwas1725.7kcal.Ultraprocessedfoodscontributed with about 32% of the total energy; of the remaining, approximately14%oftotaldailyenergywasobtainedfrom processedculinaryingredientsand5.2%ofprocessedfoods (datanotshownintables).
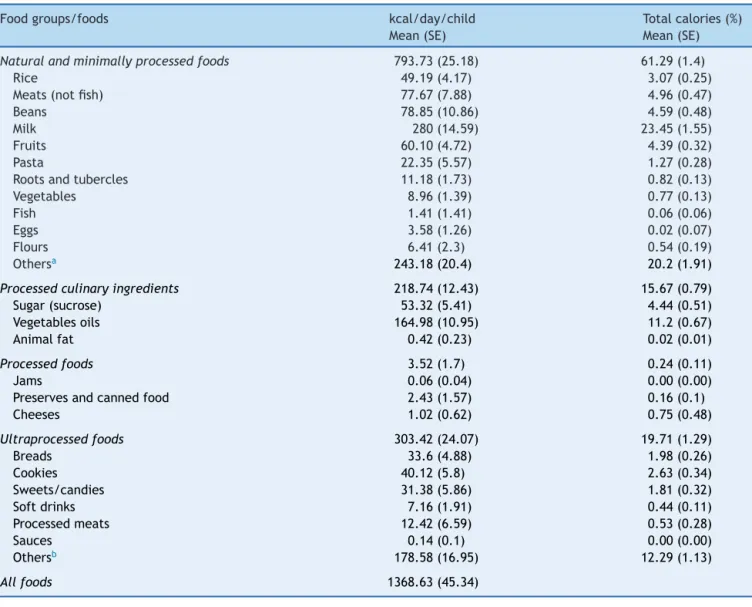
Table1 Caloricintakeofchildrenagedlessthan24months,accordingtoclassificationoffoodsinrelationtotheextentand purposeoftheirindustrialprocessing.Pelotas,RS,Brazil,2008(n=214).
Foodgroups/foods kcal/day/child
Mean(SE)
Totalcalories(%) Mean(SE)
Naturalandminimallyprocessedfoods 793.73(25.18) 61.29(1.4)
Rice 49.19(4.17) 3.07(0.25)
Meats(notfish) 77.67(7.88) 4.96(0.47)
Beans 78.85(10.86) 4.59(0.48)
Milk 280(14.59) 23.45(1.55)
Fruits 60.10(4.72) 4.39(0.32)
Pasta 22.35(5.57) 1.27(0.28)
Rootsandtubercles 11.18(1.73) 0.82(0.13)
Vegetables 8.96(1.39) 0.77(0.13)
Fish 1.41(1.41) 0.06(0.06)
Eggs 3.58(1.26) 0.02(0.07)
Flours 6.41(2.3) 0.54(0.19)
Othersa 243.18(20.4) 20.2(1.91)
Processedculinaryingredients 218.74(12.43) 15.67(0.79)
Sugar(sucrose) 53.32(5.41) 4.44(0.51) Vegetablesoils 164.98(10.95) 11.2(0.67)
Animalfat 0.42(0.23) 0.02(0.01)
Processedfoods 3.52(1.7) 0.24(0.11)
Jams 0.06(0.04) 0.00(0.00)
Preservesandcannedfood 2.43(1.57) 0.16(0.1)
Cheeses 1.02(0.62) 0.75(0.48)
Ultraprocessedfoods 303.42(24.07) 19.71(1.29)
Breads 33.6(4.88) 1.98(0.26)
Cookies 40.12(5.8) 2.63(0.34)
Sweets/candies 31.38(5.86) 1.81(0.32)
Softdrinks 7.16(1.91) 0.44(0.11)
Processedmeats 12.42(6.59) 0.53(0.28)
Sauces 0.14(0.1) 0.00(0.00)
Othersb 178.58(16.95) 12.29(1.13)
Allfoods 1368.63(45.34)
kcal,calories;SE,standarderror.
a Naturalfruitjuices;peanuts;lentils;soupsandotherhome-cookedculinarypreparations(purees,vegetablepies,pancakes,among
others);homemadecakesandbreads;teasandcoffees;rolledoats;honey.
b Industrializedjuices;processedbabyfood;powderinfantformulaandsupplements;cerealflour;processedmeats(breadedmeat,
nuggets,hamburgers);processedpasta(cupnoodlesandnoodles);industrializedseasoning;sweetenedcornflakes;potatochips; sweet-enedcerealbars;pizzas;chocolatemilkpowder;soybeverages;artificialsweeteners;creamcheese;yogurtandsweetenedandflavored dairybeverages.
contributedwith15.7%of thetotaldailyenergy,obtained mainlyfromvegetableoils(11.2%;Table1).
Regarding income quintiles in children younger than 24 months, there were no significant differences in the consumption of natural and minimally processed foods. However, when analyzing the participation of each food alone,itwasobservedthatconsumptionoffruitsand veg-etables wassignificantly higher amongchildren belonging tothehighest incomequintile. As fortheparticipationof processedculinaryingredients,sugarconsumption showed asignificantinverseassociationwithincomequintiles.The consumptionofprocessedandultraprocessedfoodsdidnot differaccordingtoincomequintiles(Table2).
Table 2 Relative caloric contribution of food groups, classified according to the extent and purpose of their industrial processing,for the caloric intakeofchildren aged lessthan 24 months,according tofamily incomequintiles. Pelotas, RS, Brazil,2008(n=214).
Foodgroups/foods Familyincomequintiles---%(SE) p-Valuec
1st 2nd 3rd 4th 5th
Naturalandminimallyprocessed foods
56.26(3.5) 58.13(2.33) 69.0(2.63) 60.14(0.5) 62.64(3.72) 0.154
Rice 3.51(0.53) 2.57(0.46) 2.87(0.47) 2.72(0.5) 3.8(0.81) 0.769 Meats(notfish) 3.87(0.93) 4.5(0.85) 5.38(1.10) 3.76(1.04) 7.61(1.23) 0.058 Beans 5.01(0.9) 4.98(1.33) 3.5(1.08) 3.83(0.8) 5.77(1.35) 0.977 Milk 19.11(2.52) 24.24(2.82) 23.38(3.71) 29.83(4.79) 20.24(2.52) 0.399 Fruits 3.56(0.77) 3.14(0.59) 5.37(0.78) 4.3(0.68) 5.74(0.77) 0.020 Pasta 1.37(0.87) 1.3(0.57) 1.23(0.66) 0.89(0.31) 1.59(0.71) 0.983 Rootsandtubercles 0.61(0.19) 0.96(0.29) 0.76(0.23) 0.56(0.19) 1.27(0.49) 0.421 Vegetables 0.43(0.18) 0.58(0.17) 0.49(0.14) 0.68(0.24) 1.78(0.56) 0.026 Fish 0.31(0.3) 0.0(0.0) 0.0(0.0) 0.0(0.0) 0.0(0.0) 0.314 Eggs 0.06(0.06) 0.03(0.03) 0.28(0.22) 0.39(0.21) 0.25(0.2) 0.103 Flours 0.44(0.24) 0.0(0.0) 1.61(0.85) 0.15(0.15) 0.47(0.28) 0.750 Othersa 221.44(4.42) 18.38(3.94) 26.94(4.14) 16.02(4.67) 17.87(3.94) 0.480
Processedculinaryingredients 17.64(1.94) 20.02(1.97) 13.06(1.09) 15.54(1.8) 11.61(1.6) 0.005
Sugar(sucrose) 5.61(1.37) 5.96(1.46) 4.56(1.04) 3.64(0.81) 2.16(0.65) 0.010 Vegetableoils 11.98(1.41) 14.02(1.74) 8.49(1.05) 11.9(1.83) 9.42(1.18) 0.114 Animalfat 0.04(0.03) 0.03(0.03) 0.0(0.0) 0.0(0.0) 0.03(0.03) 0.576
Processedfoods 0.0(0.0) 0.24(0.19) 0.02(0.01) 0.73(0.52) 0.19(0.12) 0.157
Jams 0.0(0.0) 0.01(0.01) 0.0(0.0) 0.0(0.0) 0.01(0.01) 0.627 Preservesandcannedfood 0.0(0.0) 0.04(0.04) 0.0(0.0) 0.6(0.5) 0.15(0.11) 0.132 Cheeses 0.0(0.0) 0.19(0.19) 0.01(0.0) 0.13(0.13) 0.03(0.03) 0.967
Ultraprocessedfoods 22.57(33.42) 19.02(2.23) 15.03(2.28) 20.53(2.46) 21.73(3.96) 0.954
Breads 2.58(0.6) 1.7(0.53) 2.12(057) 2.35(0.75) 1.03(0.35) 0.177 Cookies 4.11(1.08) 2.78(0.65) 2.4(0.83) 1.43(0.42) 2.44(0.63) 0.067 Sweets/candies 2.01(0.73) 1.02(0.74) 1.33(0.49) 2.41(0.92) 2.36(0.71) 0.379 Softdrinks 0.67(0.33) 0.72(0.29) 0.27(0.18) 0.0(0.0) 0.54(0.3) 0.269 Processedmeats 0.26(0.17) 0.1(0.1) 0.69(0.48) 1.54(1.25) 0.0(0.0) 0.458 Sauces 0.0(0.0) 0.0(0.0) 0.03(0.03) 0.01(0.01) 0.0(0.0) 0.294 Othersb 12.92(2.73) 12.68(2.14) 8.16(1.57) 12.77(1.72) 15.35(4.14) 0.655 SE,standarderror.
aNaturalfruitjuices;peanuts;lentils;soupsandotherhome-cookedculinarypreparations(purees,vegetablepies,pancakes,among
others);homemadecakesandbreads;teasandcoffees;rolledoats;honey.
b Industrializedjuices;processedbabyfood;powderinfantformulaandsupplements;cerealflour;processedmeats(breadedmeat,
nuggets,hamburgers);processedpasta(cupnoodlesandnoodles);industrializedseasoning;sweetenedcornflakes;potatochips; sweet-enedcerealbars;pizzas;chocolatemilkpowder;soybeverages;artificialsweeteners;creamcheese;yogurtandsweetenedandflavored dairybeverages.
c LineartrendWaldtest.
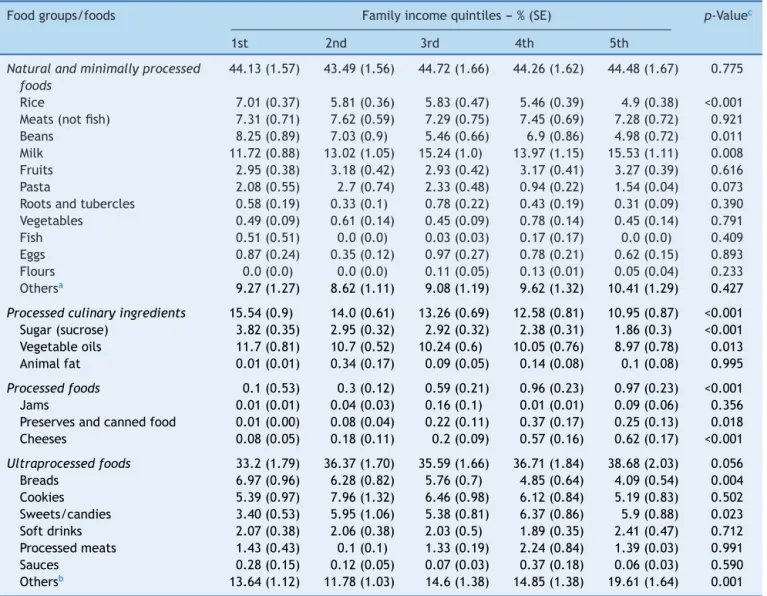
In the age group of 24 months or older, the partici-pation of the group of natural and minimally processed foods did not vary according to income quintiles. How-ever,whenanalyzingtheparticipationofeachfoodalone, it was observed that the consumption of rice and beans decreased significantly with increasing income, whereas milk consumption increased. Regarding the participation of processed culinary ingredients in the diet, sugar and vegetable oils showedan inverse association with income quintiles. Regarding the group of processed and ultra-processedfoods, consumption increased according tothe incomequintiles,beingsignificantonlyinthegroupof pro-cessedfoods.
Whenanalyzingthecontributionofeach itemfromthe ultraprocessedfoodgroupalone,theconsumptionofbread decreased significantly as income increased, while can-dies/sweetsandotherfoods,suchaschocolatemilkpowder, processed juices, yogurts,and dairy beverages, showed a positivesignificantassociationwithincome(Table4).
Discussion
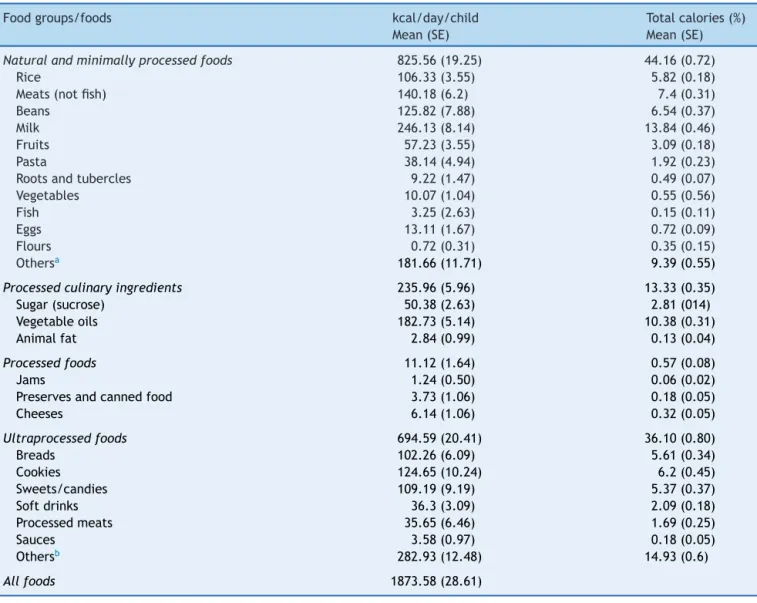
Table3 Caloricintakeofchildrenaged24monthsorolder,accordingtotheclassificationoffoodsinrelationtotheextent andpurposeoftheindustrialprocessing.Pelotas,RS,Brazil,2008(n=556).
Foodgroups/foods kcal/day/child
Mean(SE)
Totalcalories(%) Mean(SE)
Naturalandminimallyprocessedfoods 825.56(19.25) 44.16(0.72)
Rice 106.33(3.55) 5.82(0.18)
Meats(notfish) 140.18(6.2) 7.4(0.31)
Beans 125.82(7.88) 6.54(0.37)
Milk 246.13(8.14) 13.84(0.46)
Fruits 57.23(3.55) 3.09(0.18)
Pasta 38.14(4.94) 1.92(0.23)
Rootsandtubercles 9.22(1.47) 0.49(0.07)
Vegetables 10.07(1.04) 0.55(0.56)
Fish 3.25(2.63) 0.15(0.11)
Eggs 13.11(1.67) 0.72(0.09)
Flours 0.72(0.31) 0.35(0.15)
Othersa 181.66(11.71) 9.39(0.55)
Processedculinaryingredients 235.96(5.96) 13.33(0.35)
Sugar(sucrose) 50.38(2.63) 2.81(014) Vegetableoils 182.73(5.14) 10.38(0.31)
Animalfat 2.84(0.99) 0.13(0.04)
Processedfoods 11.12(1.64) 0.57(0.08)
Jams 1.24(0.50) 0.06(0.02)
Preservesandcannedfood 3.73(1.06) 0.18(0.05)
Cheeses 6.14(1.06) 0.32(0.05)
Ultraprocessedfoods 694.59(20.41) 36.10(0.80)
Breads 102.26(6.09) 5.61(0.34)
Cookies 124.65(10.24) 6.2(0.45)
Sweets/candies 109.19(9.19) 5.37(0.37)
Softdrinks 36.3(3.09) 2.09(0.18)
Processedmeats 35.65(6.46) 1.69(0.25)
Sauces 3.58(0.97) 0.18(0.05)
Othersb 282.93(12.48) 14.93(0.6)
Allfoods 1873.58(28.61)
SE,standarderror.
a Naturalfruitjuices;peanuts;lentils;soupsandotherhome-cookedculinarypreparations(purees,vegetablepies,pancakes,among
others);homemadecakesandbreads;teasandcoffees;rolledoats;honey.
b Industrializedjuices;processedbabyfood;powderinfantformulaandsupplements;cerealflour;processedmeats(breadedmeat,
nuggets,hamburgers);processedpasta(cupnoodlesandnoodles);industrializedseasoning;sweetenedcornflakes;potatochips; sweet-enedcerealbars;pizzas;chocolatemilkpowder;soybeverages;artificialsweeteners;creamcheese;yogurtandsweetenedandflavored dairybeverages.
in the assessed age groups was characterized by several processed foods, as well as breads, cookies, and can-dies/sweets.Itis knownthatchildren’seatingbehavioris highlyinfluencedbythefamily’seatinghabits.Conversely, during the phaseof complementaryfeeding introduction, it is common for children to have food neophobia and difficulties in accepting new flavors.22 Therefore,parents
mayexperiencedifficultiesininfantfeedingwiththeoffer of more palatable and convenient foods found in ultra-processed items, which promotes the establishment of unhealthyhabitsatlaterages.
Theincreaseintheparticipationofprocessedand ultra-processed foods and the decrease in the consumption of natural and minimally processed foods in the Brazilian diet is a phenomenon observed in thelast threenational Family Budget Surveys.10 The National Demographic and
HealthSurvey(2006/2007)carriedoutwithchildrenyounger than 5 years showed a low intake of natural foods, such asvegetables, green vegetables, and meat, as well as a highconsumption of processedfoods (suchas softdrinks, candies/sweets and snacks).23 Another Brazilian study on
dietarypatternsof childrenyoungerthan5 yearsliving in urbanandruralregionsidentifiedthe presenceofbreads, cookies,andsugars inthecustomaryconsumption of chil-drenaged6---17months,inadditiontoalowconsumptionof milkandlowvarietyoffruitsandvegetablesinthedietsof childrenaged18monthsandolder.22
DatafromtheNationalHealthSurveyoninfantfeeding, whichwasrecentlyreleased,showsthat60.8%ofchildren younger than 2 years old eat cookies, biscuits, or cake, and 32.3% drank soft drinks or artificial juices.23 These
Table 4 Relative caloric contribution of food groups, classified according to the extent and purpose of their industrial processing,forthecaloricintakeofchildrenaged24monthsorolder,accordingtofamilyincomequintiles.Pelotas,RS,Brazil, 2008(n=556).
Foodgroups/foods Familyincomequintiles---%(SE) p-Valuec
1st 2nd 3rd 4th 5th
Naturalandminimallyprocessed foods
44.13(1.57) 43.49(1.56) 44.72(1.66) 44.26(1.62) 44.48(1.67) 0.775
Rice 7.01(0.37) 5.81(0.36) 5.83(0.47) 5.46(0.39) 4.9(0.38) <0.001 Meats(notfish) 7.31(0.71) 7.62(0.59) 7.29(0.75) 7.45(0.69) 7.28(0.72) 0.921 Beans 8.25(0.89) 7.03(0.9) 5.46(0.66) 6.9(0.86) 4.98(0.72) 0.011 Milk 11.72(0.88) 13.02(1.05) 15.24(1.0) 13.97(1.15) 15.53(1.11) 0.008 Fruits 2.95(0.38) 3.18(0.42) 2.93(0.42) 3.17(0.41) 3.27(0.39) 0.616 Pasta 2.08(0.55) 2.7(0.74) 2.33(0.48) 0.94(0.22) 1.54(0.04) 0.073 Rootsandtubercles 0.58(0.19) 0.33(0.1) 0.78(0.22) 0.43(0.19) 0.31(0.09) 0.390 Vegetables 0.49(0.09) 0.61(0.14) 0.45(0.09) 0.78(0.14) 0.45(0.14) 0.791 Fish 0.51(0.51) 0.0(0.0) 0.03(0.03) 0.17(0.17) 0.0(0.0) 0.409 Eggs 0.87(0.24) 0.35(0.12) 0.97(0.27) 0.78(0.21) 0.62(0.15) 0.893 Flours 0.0(0.0) 0.0(0.0) 0.11(0.05) 0.13(0.01) 0.05(0.04) 0.233 Othersa 9.27(1.27) 8.62(1.11) 9.08(1.19) 9.62(1.32) 10.41(1.29) 0.427
Processedculinaryingredients 15.54(0.9) 14.0(0.61) 13.26(0.69) 12.58(0.81) 10.95(0.87) <0.001
Sugar(sucrose) 3.82(0.35) 2.95(0.32) 2.92(0.32) 2.38(0.31) 1.86(0.3) <0.001 Vegetableoils 11.7(0.81) 10.7(0.52) 10.24(0.6) 10.05(0.76) 8.97(0.78) 0.013 Animalfat 0.01(0.01) 0.34(0.17) 0.09(0.05) 0.14(0.08) 0.1(0.08) 0.995
Processedfoods 0.1(0.53) 0.3(0.12) 0.59(0.21) 0.96(0.23) 0.97(0.23) <0.001
Jams 0.01(0.01) 0.04(0.03) 0.16(0.1) 0.01(0.01) 0.09(0.06) 0.356 Preservesandcannedfood 0.01(0.00) 0.08(0.04) 0.22(0.11) 0.37(0.17) 0.25(0.13) 0.018 Cheeses 0.08(0.05) 0.18(0.11) 0.2(0.09) 0.57(0.16) 0.62(0.17) <0.001
Ultraprocessedfoods 33.2(1.79) 36.37(1.70) 35.59(1.66) 36.71(1.84) 38.68(2.03) 0.056
Breads 6.97(0.96) 6.28(0.82) 5.76(0.7) 4.85(0.64) 4.09(0.54) 0.004 Cookies 5.39(0.97) 7.96(1.32) 6.46(0.98) 6.12(0.84) 5.19(0.83) 0.502 Sweets/candies 3.40(0.53) 5.95(1.06) 5.38(0.81) 6.37(0.86) 5.9(0.88) 0.023 Softdrinks 2.07(0.38) 2.06(0.38) 2.03(0.5) 1.89(0.35) 2.41(0.47) 0.712 Processedmeats 1.43(0.43) 0.1(0.1) 1.33(0.19) 2.24(0.84) 1.39(0.03) 0.991 Sauces 0.28(0.15) 0.12(0.05) 0.07(0.03) 0.37(0.18) 0.06(0.03) 0.590 Othersb 13.64(1.12) 11.78(1.03) 14.6(1.38) 14.85(1.38) 19.61(1.64) 0.001 SE,standarderror.
aNaturalfruitjuices;peanuts;lentils;soupsandotherhome-cookedculinarypreparations(purees,vegetablepies,pancakes,among
others);homemadecakesandbreads;teasandcoffees;rolledoats;honey.
b Industrializedjuices;processedbabyfood;powderinfantformulaandsupplements;cerealflour;processedmeats(breadedmeat,
nuggets,hamburgers);processedpasta(cupnoodlesandnoodles);industrializedseasoning;sweetenedcornflakes;potatochips; sweet-enedcerealbars;pizzas;chocolatemilkpowder;soybeverages;artificialsweeteners;creamcheese;yogurtandsweetenedandflavored dairybeverages.
c LineartrendWaldtest.
consumption by children with a consequent reduction in naturalandminimallyprocessedfoodconsumption.
Regarding natural and minimally processed foods, it is observed that the participation of fruits and vegetables showedapositiveassociationwithfamilyincomeonlyamong childrenyoungerthan24months,whereasintheolderage group the relative participation decreased at the higher quintilesandthus,theassociationwithincomedisappeared. Therefore,thedatamaysuggestthatthelowerparticipation offruitandvegetablesinchildren’sdietmightnotbeonly amatteroffamilyincome.Infact,thelowconsumptionof fruitsandvegetablesisalsoobservedinchildrenfromricher countries.1,2 Otherfactorssuchasthelateintroductionof
fruitsandvegetablesatthephaseofcomplementary feed-ingandthemothers’habitofeatingfruitsandvegetables caninterferewiththeirchildren’sfoodpreferences.1,24---26
Regarding processed culinary ingredients, sugar con-sumptionmaintaineda significantinverseassociation with income quintiles in both age groups. The participation of vegetable oils showed a significant inverse association with income only among children older than 24 months. Unlike vegetable oils, which contribute as an important source of essential fatty acids in infant feeding, sugar is an ingredient virtually free of nutrients and its use does notcontributetoimprovethenutritionalvalueofthefood towhichitisadded.Often,theincreasedconsumptionof sugarandfatsareusuallyassociatedwiththelowerincome population.27,28
Althoughultraprocessedfoodshavehighenergydensity anddonotaddsignificantnutritionalvalue,differencesin the relative participation of certain foods in relation to incomequintileswereobservedonlyamongchildrenolder than24months.However,therelativeparticipationofsoft drinks and cookies increased amongchildren in the same agerange,withnodifferencebetweentheincomequintiles. Conversely,therelativeparticipationofsweetsincreasedas thequintilesofhouseholdincomeincreased.OtherBrazilian studieshavealsoshowntheinfluenceoffamilyincomeon theconsumptionofultraprocessedfoods.3,29
Oneofthelimitationsofthepresentstudyistheuseof 24-h recall of only one day of the week, which does not considerthevariabilityoffoodconsumption.Another limi-tationtobeemphasizedreferstotheclassificationoffoods regardingthedegreeofprocessing.
Becausethis wasastudy ofsecondary data,theinitial study planning did not predict the classification of foods accordingtotheirdegreeofprocessing.However,therecall methodrequiresadetailedaccountoftheconsumedfoods, whichallowedfortheclassificationofmostitems;incasesof doubt,aconservativeclassificationwaschosen, characteriz-ingasprocessedandultraprocessedonlythosefoodswithout thepossibilityofhomepreparation.Despitepossible limita-tions,thisstudywasabletocollectdetailedinformationon feedingandidentifyimportantdifferencesinconsumption betweentheassessedagegroups.
Thisstudyreinforcesdiscussionsaboutthegrowing par-ticipationof ultraprocessedfoodsin thedietof Brazilians andthe importanceof greaterattention tothequalityof thedietprovidedtochildrenyoungerthan6years.Thedata showthatatanearlyage,onecanobserveagreater rela-tiveparticipationof ultraprocessedfoodtothedetriment of lowerconsumption of natural andminimally processed foods.Theresultscanbeusedbyhealthcareprofessionals to guide parents about infant feeding, aswell as educa-torsandprofessionalsinvolvedintheplanningofmenusin kindergartens.
Funding
Conselho Nacional de Desenvolvimento Científico e Tec-nológico.
Conflicts
of
interest
Theauthorsdeclarenoconflictsofinterest.
References
1.JonesLR,SteerCD,RogersIS,EmmettPM.Influencesonchild fruit and vegetable intake: sociodemographic, parental and childfactorsinalongitudinalcohortstudy.PublicHealthNutr. 2010;13:1122---30.
2.deLauzon-GuillainB,JonesL,OliveiraA,MoschonisG,Betoko A,LopesC,etal.Theinfluenceofearlyfeedingpracticeson fruitandvegetableintakeamongpreschoolchildrenin4 Euro-peanbirthcohorts.AmJClinNutr.2013;98:804---12.
3.ToloniMH,Longo-SilvaG,GoulartRM,TaddeiJA.Introduc¸ãode alimentosindustrializadosedealimentosdeusotradicionalna dietadecrianc¸asdecrechespúblicasnomunicípiodeSãoPaulo. RevNutr.2011;24:61---70.
4.Oliveira LP, Assis AM, Pinheiro SM, Prado MS, Barreto ML. Alimentac¸ãocomplementarnosprimeirosdoisanosdevida.Rev Nutr.2005;18:459---69.
5.GolleyRK,SmithersLG,MittintyMN,EmmettP,NorthstoneK, LynchJW.DietqualityofU.K.infantsisassociatedwithdietary, adiposity,cardiovascular,andcognitiveoutcomesmeasuredat 7---8yearsofage.JNutr.2013;143:1611---7.
6.RauberF,CampagnoloPD,HoffmanDJ,VitoloMR.Consumption ofultra-processedfoodproductsand itseffectsonchildren’s lipidprofiles:alongitudinalstudy.NutrMetabCardiovascDis. 2015;25:116---22.
7.BrazionisL, Golley RK,MittintyMN, Smithers LG,EmmettP, NorthstoneK,etal.Dietspanninginfancyandtoddlerhoodis associatedwithchildbloodpressureatage7.5y.AmJClinNutr. 2013;97:1375---86.
8.InstitutoBrasileirodeGeografiaeEstatística---IBGE.Pesquisa deOrc¸amentosFamiliares(POF)2008---2009:antropometria e estadonutricionaldecrianc¸as,adolescenteseadultosnoBrasil; 2010.
9.Mallarino C, GomezLF, Gonzalez-Zapata L, Cadena Y, Parra DC.Advertising ofultraprocessedfoods and beverages: chil-drenasavulnerablepopulation.RevSaúdePública.2013;47: 1006---10.
10.Martins AP, Levy RB, Claro RM, Moubarac JC, Monteiro CA. Increasedcontributionofultra-processedfoodproductsinthe Braziliandiet(1987---2009).RevSaúdePública.2013;47:656---65.
11.LelisCT,TeixeiraKM,daSilvaNM.Ainserc¸ãofemininano mer-cadodetrabalhoesuasimplicac¸õesparaoshábitosalimentares damulheredesuafamília.SaúdeDebate.2012;36:523---32.
12.AlmeidaSdeS,NascimentoPC,QuaiotiTC.Amountand qual-ity offood advertisement onBraziliantelevision. RevSaúde Pública.2002;36:353---5.
13.deAquinoRdeC,PhilippiST.Associationofchildren’s consump-tionofprocessedfoodsandfamily incomeinthecityofSao Paulo,Brazil.RevSaúdePública.2002;36:655---60.
14.LobancoCM,VedovatoGM,CanoCB,BastosDH.Reliabilityof foodlabelsfromproducts marketedinthecityofSaoPaulo, SoutheasternBrazil.RevSaúdePública.2009;43:499---505.
15.MonteiroCA,LevyRB,ClaroRM,CastroIR,CannonG.Anew classificationoffoodsbasedontheextentandpurposeoftheir processing.CadSaúdePública.2010;26:2039---49.
16.Cadernosdeatenc¸ãobásica.Guiaalimentarparaapopulac¸ão brasileira/MinistériodaSaúde,SecretariadeAtenc¸ãoàSaúde, DepartamentodeAtenc¸ãoBásica.Brasília:MinistériodaSaúde; 2014.p.156.
17.Assunc¸ãoMC,SantosIS,BarrosAJ,GiganteDP,VictoraCG.Flour fortificationwithironhasnoimpactonanaemiainurban Brazil-ianchildren.PublicHealthNutr.2012;15:1796---801.
18.ADSNutriSistemaNutricional(versão9.0).9ed.Pelotas,RS: Fundac¸ãodeApoioUniversitário;2006.
20.US Department of Agricultural Research Service. USDA NationalNutrientDatabasefor StandardReferences, Release 18. Washington, DC: Nutrient Database Laboratory; 2005 [cited30.03.15].Availablefrom:http://www.ars.usda.gov/ba/ bhnrc/ndl
21.WorldHealth Organization. Complementaryfeeding ofyoung childrenindevelopingcountries:areviewofcurrentscientific knowledge.Genebra:WHO;1998.
22.QuaiotiTC,AlmeidaSS.Determinantespsicobiológicosdo com-portamentoalimentar:umaênfaseemfatoresambientaisque contribuemparaaobesidade.PsicolUSP.2006;17:193---211.
23.BortoliniGA,GubertMB,SantosLM.Foodconsumptionin Brazil-ian children by 6 to 59 months of age. Cad Saude Publica. 2012;28:1759---71.
24.MatosSM,BarretoML,Rodrigues LC,OliveiraVA,OliveiraLP, D’InnocenzoS,et al.Dietarypatterns ofchildrenunderfive yearsofagelivinginthestatecapitaland othercountiesof BahiaState, Brazil,1996and 1999---2000.CadSaudePublica. 2014;30:44---50.
25.Pesquisa nacional de saúde: percepc¸ãodo estado de saúde, estilos de vida e doenc¸as crônicas: Brasil, grandes regiões,
unidades da federac¸ão, municípios das capitais e Distrito Federal. Ministério do Planejamento, Orc¸amento e Gestão. Instituto Brasileiro de Geografia e Estatística. Diretoria de Pesquisas. Coordenac¸ão de Trabalho e Rendimentos; 2013. p.155---64.
26.CookeLJ,WardleJ,GibsonEL,SapochnikM,SheihamA,Lawson M.Demographic,familialandtraitpredictorsoffruitand veg-etableconsumptionbypre-schoolchildren.PublicHealthNutr. 2004;7:295---302.
27.InstitutoBrasileirodeGeografiaeEstatística---IBGE.Pesquisa deorc¸amentosfamiliares2008---2009:análisedoconsumo ali-mentar pessoal no Brasil. 2011. Rio de Janeiro: Instituto BrasileirodeGeografiaeEstatística;2011.
28.AquinoRC,PhilippiST.Consumoinfantildealimentos industri-alizadoserendafamiliarnacidade deSão Paulo.RevSaúde Pública.2002;36:655---60.