REGIONAL DISPARITIES IN THE TRANSITION PERIOD
IBOLYA KURKÓ
1ABSTRACT - The abolishment of the communist regime, the establishment of a democratic legal and institutional system brought important changes in the development of the regional economy of Romania. The old – from an economic point of view – differentiating factors have lost some of their importance, mainly the level of industrialization, which, in the past, was used to measure economic development. In addition, other factors came forward, that correlate more with the economic capacity, but, nowadays, their positive effect can only be increased by the combination of several other factors: foreign investments, as an indicator of regional attractiveness, regional GDP, the level of personal income, and the appreciation of human resources. Today, in the interest of enhancing the competitiveness of the regions a special role is reserved for entrepreneurial activity, the strength of the SME sector, the role of foreign working capital in the local economy, but also the territorial concentration of R&D centers. The study focuses on some aspects of disparities regarding the regional economic structure.
Key words: regional disparities, GDP per capita, positional changes, Hoover-index, weighted relative standard deviation
At the beginning of the transition period, the deepening of the inter-regional development gap, their appearance in all sorts of new dimensions has been positively influenced by the country's transition to a market economy. In a relatively short time, due to the process of deindustrialization, restructuring, most regions of the country have entered into a period of decline, economic growth has stopped, with unemployment rising to an unprecedented level. The rise of inflation, the internal and external debts, the pauperization of the major groups of society have brought to light these rapid transformations, processes that could not be stopped on the short term (Réti, 2003). Economic recession has led to the restructuring of many branches of the economy, in which a major role was given to the primary sector, in the detriment of the secondary one. All these changes have led to the decreased performance and growth of the economy (in 1990 the economic growth rate was -7.4% and in 1994, 1%), which was further hampered by high inflation rate and the rising external debt (inflation increased from 4.2% in 1990 to 136.8% in 1994). Such "defects" of economic processes have been well illustrated by the oscillations of the country’s GDP.
The moment of crisis has proven to be more severe and lasted much longer than the 1929-1933 crisis, but the unique feature was that it was not triggered by overproduction, but a structural crisis, which can be deducted from the collapse of the institutional system as well as the failure to create new ones (Török, 2007).
In the same time, the restructuring, which took place after the political junction, has lead to the formation of a wide range of crisis areas and has greatly contributed to the homogenization of the spatial spreading of agriculture. The south-Transylvanian axis, considered a stable pole for the economy has collapsed, the restructuring of the whole economy acted in favor of agriculture. In this period, agriculture had a security role in employment (Heining and Bara, 1999). However, there is still the problem, that the rate of those working in this sector is much higher than its contribution to the country’s GDP, the production of new values that reflects the subsistence character, as the negative consequence of the political juncture. While in the case of the North-East, South and South-West Regions the rate of farmers exceeded 40% in 2005, the contribution of this sector to the country’s GDP was a mere 15%. This is also supported by the fact that appliances and machines needed for technologic structural change, the traditional ways of production and the lack of a new production
1 Assistant professor, PhD, Babe -Bolyai University, Faculty of Geography, Department of Regional Geography,
culture is unable to boost the competitiveness of the sector. We could also say that on those territories, where agriculture is predominant, competitiveness is low because it “sucks away” the GDP that could be produced with a higher rate of services and industrial activity (Kölcsey, 2005).
Figure 1.The relation between the rate of those working in the main sectors of the economy and the GDP produced, in 2006
(Source: Statistical Yearbook of Romania - 2006, NSI, Bucharest)
The industrial workers and the produced values show a rather more balanced situation, but the present and future pulling sector will be first of all that of services. This is confirmed by the fact that the amount of GDP produced by the service sector is well above the rate of people working in this field. Thus, in our days, the regions that can be considered the roots of growth poles are those that were able to successfully implement the new elements of the market economy that came after the revolution. Banks and business services, the upsurge of tourism and the processing industry are the propellants of the economy. Besides Bucharest (62.1%), the North-West Region also excels from the viewpoint of the GDP produced in the service sector (45.5%), but the West Region is also close with its 44.8%. Thus, the Arad-Timi oara-Oradea axis linked by Cluj to the Bra ov-Pite ti and Bucure ti-ConstanŃa development axis can be considered future growth poles. The areas that find it difficult to break free from this crisis situation, besides the south-Transylvanian counties, are the less developed ones situated in the North-East and South, battling with a high level of ruralization. The gap in development between these two types of regions contributes to the further increase in regional disparities.
The increase in regional disparities is inherent in the process of economic development of countries. Economic growth is influenced by many factors, some of which can create positive externalities (increased number of SMEs, rise of foreign direct investment), and others which have a negative impact on the economy (the effects of pollution on tourism). Some authors consider that distance has become an important factor of location (Heller and Iano , 2004), which in the countries in transition plays indeed a major role in the concentration of some economic processes. When determining, measuring the level of development of a region, the gross domestic product and its per capita value are very often taken into account. Nevertheless, the level of development is only a concept, a notion much more complex, with multiple dimensions and multiple variables (Nagy, 2005), some of which cannot be explained by a single variable, so it is advisable to approach this phenomenon in detail. Before analyzing this phenomenon in more complex way (with the help of factor analysis), we can determine the level of development of the Romanian counties with the help of GDP per capita.
In the middle of the nineties, the increase of the GDP per capita was largely affected by the economic decline of the entire country. The restructuring of state-owned enterprises, the privatization
budget (Réti, 2003). The inflation has increased to an alarmingly high rate, while, at the same time, the closing down of the industrial plants has boosted unemployment, all these having a negative effect on the whole economy of the country. At the end of the nineties, the stabilization of the macroeconomic processes, the increase of foreign investments and last but not least, the fall of inflation to a level of 16% have all contributed to the increase of the internal GDP, reaching a value of 5,7% in the year 2001. Despite this increase, the level of the GDP still remains much below the EU average, only the capital city of the country showing signs of approaching the 70% value of the EU average.
Thus, an economic growth above the national average (4.1%) was registered in Bucharest (7.3%) and the West Region (5.6%), where the most significant input to economic growth has been given by the industry, with a high gross added value (6.5%) and by the services sector (10%). The high gross added value of the South Region (8%) is also worth mentioning, but taking into account the adverse weather conditions in recent years, with major impact on increasing agricultural production, the economic performance of the region was largely annihilated (National Prognosis Center, 2005).
Besides the evolution in time of the country’s development, it is very important to analyze the inequalities that have appeared between the different areas of the country: the Hoover index and the weighted relative standard deviation calculated for the different territorial levels. From the inequalities viewpoint, the analized period can be separated into two stages. This period coincides with the expansion of the deindustrialization process because the decline of the mining industry, the closing down of large industrial centers and the rising unemployment have reached their peak in the second half of the nineties (this period also coincides with the change in direction of the internal migration flows in 1997 and increase of the unemployment rate, reaching the highest values in 1999). In a relatively short time, there have appeared quite obvious differences between the counties of Romania, which were further emphasized by the processes of privatization and foreign direct investment, both having a selective character. Some areas have entered a period of decline (especially the mountainous areas dominated by the extractive and manufacturing industry, as well as urban centers characterized by the presence of heavy industry), while territories with a more favorable position, with more developed infrastructure have further strengthened their position in the spatial structure of the economy. Thus, at this stage, in the second half of the transition period, regional inequalities have been rising rapidly at all levels and also in the case of both indices that we have taken into account.
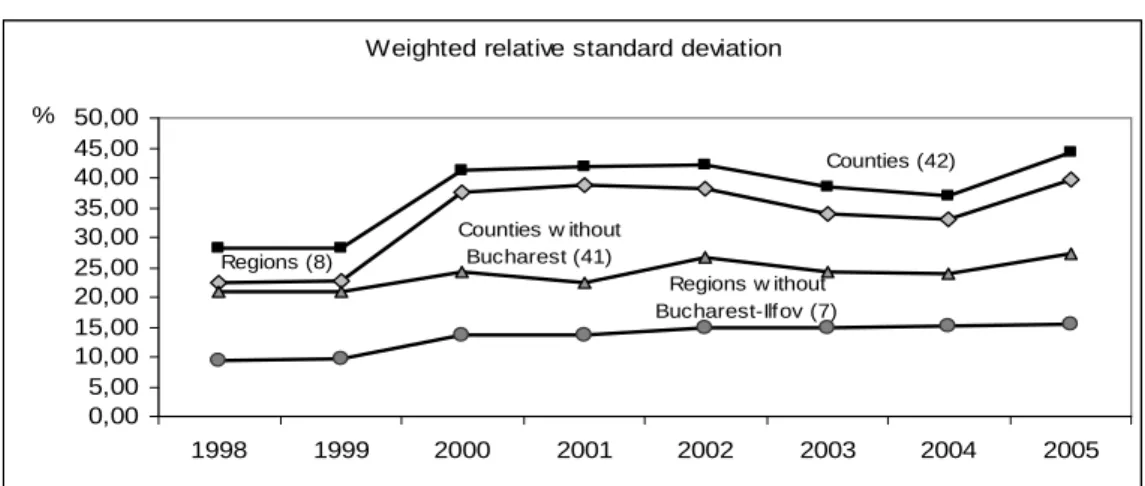
The second stage starts with the year 2002 and is characterized by large oscillations, the decrease of territorial inequalities being followed by periods of growth especially starting with 2004. What should be noted is that inequalities are much higher in the case of county and regional levels, those territorial units which also include the capital city, and this is true both in the case of the Hoover index and the weighted relative standard deviation (Figure 2).
Hoover-index
Regions (8)
Counties(42)
Counties w ithout Bucharest(41)
Regions w ithout Bucharest-Ilfov (7)
0,00 2,00 4,00 6,00 8,00 10,00 12,00 14,00 16,00 18,00
1998 1999 2000 2001 2002 2003 2004 2005
Weighted relative standard deviation
Regions (8)
Counties (42)
Counties w ithout Bucharest (41)
Regions w ithout Bucharest-Ilfov (7)
0,00 5,00 10,00 15,00 20,00 25,00 30,00 35,00 40,00 45,00 50,00
1998 1999 2000 2001 2002 2003 2004 2005
%
Figure 2.The evolution of regional inequalities regarding GDP per capita on different territorial levels and on the two indices
(Source: the author, based on data from Eurostat)
As we can see, there is only one territorial level where the inequalities are relatively balanced, this being that of the regions (not counting Bucure ti-Ilfov Region because of its specific position in the country’s territorial structure). If we analyze the GDP per capita of the other seven regions, we can conclude that in the future it is likely that they will decrease even more considering the main objective of the European Union, much of the financial support coming in at this level.
Another index worth mentioning refers to the ratio between the maximum and minimum values of the GDP per capita, which very eloquently reinforces the situation presented above. If we look at the territories of Romania from the point of view of their share in the country average, regional disparities are emphasized even more: the differences between counties in a more favorable situation and those in a less favorable one, we can see that not only did the disparities not decrease, but we can even observe a significant growth in this sense. If in 1998 the difference between these two types of counties was triple, by 2005 inequalities incresed almost five times. As the capital city and its development is very different from the rest of the counties, it is more appropriate to eliminate Bucharest from this analysis and to compare the differences in development between the second most developed territory and that most underdeveloped one. Thus, the disparities regarding GDP per capita have been steadily decreasing, although they have not dissapeared entirely: in the 1998-2005 period, the differences in development between Ilfov county (being the most developed county after Bucharest according to GDP per capita) and Vaslui have even shown a slight but steady increase.
The last years have contributed to a large extent to the positional changes of the counties in the hierarchy of development, although the general tendency has mostly remained unchanged: the disadvantaged areas have not managed to consolidate their position in the economical spatial structure, whereas the territories that had a higher level of development back from the last decades have managed to hold their position within the new and changed economic environment.
All these changes are very well illustrated in Figure 3, which were created on the basis of
Taking the whole period into consideration, the biggest changes can be observed in the case of Arge , Timi and Ilfov counties. It is important to mention the situation of Arge county, which was somewhere in the middle of the hierarchy in 1998, while, nowadays, it has become one of the most developed areas of the country. The convergent development of Arge county has begun immediately after the World War II when the investment policies of the communist regime have concentrated all the innovative and high-influence economic sectors, like the automotive industry (the Dacia Automobile factory in Pite ti, Aro in Câmpulung), the chemical industry – close to the capital city, these being able to profit at the same time from the positive externalities of the agglomeration of the capital (Benedek, 2004). In the transition years, the process of privatization, the investments made in the machine industry (Dacia-Renault) have contributed not only to the increase in economic performance of the area, but also to overcoming the economic and social difficulties, peculiar to such periods.
Figure 3. The evolution of GDP per capita in the 1998-2005 period, compared to the country average (Source: the author, based on data from Eurostat)
It is important to mention the downfall of Gorj County, the county where the changes of the economic structures after WW II (extractive industry, energy industry) have generated an economic growth and a productivity of high importance. However, this sector of the national economy has not managed to adapt to the requirements of the market economy, slowly becoming the junction of social dysfunctions.
the long run, the differences in the territorial development seem to remain stable, the positional changes being more likely to appear in the case of the more developed areas, the less developed ones not being able to adapt to the different economic conditions. These differences in development between the more dynamic regions and those in decline contribute even more to the deepening of the crevasses existing in the present (Kurkó, 2008).
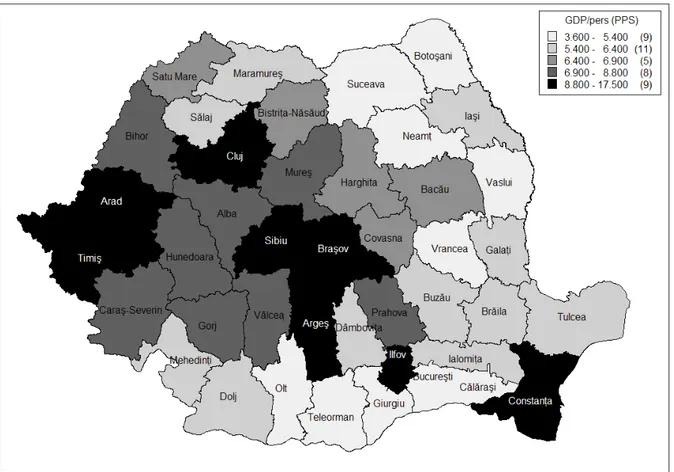
As we could see, the highest values can mostly be found in the Transylvanian counties that are greatly influenced by their regional position, the proximity to the Western European Countries, the openness that gave them the ability to absorb the foreign capital. We cannot discard the vast traditions of these areas, their favorable position in the past centuries that was emphasized by the fact that these regions were also part of the Austrian-Hungarian Monarchy. Thanks to their more developed infrastructure, the further developments that took place during the communist years were easier to implement than in certain under-developed, purely industrialized areas (Heller and Iano , 2004). All these are very well expressed by the values of the weighted relative standard deviation: while in Transylvania, the value of this index is 18%, in Romania, the average value of this index reaches 44.1%, which shows that regional disparities in development are much higher at national level than in the case of the territories situated in Transylvania.
Figure 4.The distribution of counties based on GDP per capita in 2005 (Source: the author, based on data from Eurostat)
As we have already mentioned, somewhat higher values can also be found on the Gorj-Vâlcea-Arge -Prahova axis completed by ConstanŃa at the southeastern end, counties that have
neighbors was pretty much defined by the forced industrialization of the seventies, nowadays struggling with the transition to a market economy and restructuring. The lowest values of GDP can be found in the peripheral – from a spatial point of view as well - Boto ani, Vaslui, Giurgiu, Olt and Teleorman counties (POS 2007-2013).
The counties with a higher GDP per capita have managed to adapt much better to the changed economic and social conditions, they have managed to integrate the new elements of the forces of territorial structuring. These territories are the most dynamic poles of Romania, where the human capital, the high level of urbanization, the high rate of employment in the tertiary sector will most probably be able to sustain an economic capital similar to that of the European Union.
CONCLUSION
In conclusion, the changeover to a market economy, the consequences of restructuring have led to the forming of a West – East duality. The proximity of western markets has been beneficial for the counties forming the thin and dynamic line called the gates to the European Union, the Eastern areas being characterized by the preponderance of peripheral counties. We could say that the winners of the privatization and restructuring processes of the last 15 years or so were the regions that were able to effectively adapt to the requirements of the new and innovative activities. By this, they acquired certain comparative advantages, that has further strengthened they position occupied in the country’s spatial structure (Timi , Cluj, Bihor counties). The so-called losers of the transition were henceforward the peripheral, agrarian areas, where the high rate of unemployment, low income did not act as an allurement for large capital enterprises. We can find BistriŃa-Năsăud, Sălaj, Satu-Mare and Maramure counties in this category. Although the GDP per capita unmistakably points out the Transylvanian Regions as the most developed ones, there are significant differences within these areas. The diminution of these only depends on the successful implementation of regional policies elaborated on different levels and the rational distribution of resources in the hands of local administrations.
The inequalities of the economic space can greatly be influenced by adequate interventions towards a more homogenous spatial structure and the establishment of territorial cohesion. In this sense, from the concepts drawn up in the Regional Development Plans, the priorities should be the sections regarding infrastructure, human capital and the labor market. Recent analyses have also pointed out that the most severe social dysfunctions following the revolution were those related to unemployment. Making the business environment more attractive, the stimulation of SMEs, the development of the R&D sector and the establishment of an information society, tourist potential and the amelioration of the chances of the rural population could contribute to the diminution of inequalities not only in certain historical regions, but also at the level of the whole country. In the near future, territorial planning and regional policies, the cooperation between local, regional and nationwide institutions will have a much more significant role in diminishing inequalities, so that Romania (and its historical regions) can be a more competitive and more dynamic part of the European Union.
REFERENCES
BENEDEK, J. (2004), Amenajarea teritoriului i dezvoltarea regională [Territorial Planning and
Regional Development], Editura Presa Universitară Clujeană, Cluj-Napoca.
HEINING, R., BARA, S. (1999), Agriculture – An Important Sector for Romania: Analysis and
Possible Development, In: South East Europe Review, vol. 2, No. 3, p. 99-110.
HELLER, W., IANO , I. (2004), Spatial Patterns of Economy and Migration in Post-socialist
Romania, In: Europe Regional, vol. 12, no. 1, p. 4-13.
KURKÓ, I. (2008), Regionális fejlettségi különbségek a posztszocialista Romániában [Regional
KÖLCSEY A. (2005), Regionális versenyképesség Romániában [Regional Competitiveness in
Romania], In: Közgazdász Fórum, epa.oszk.hu/00300/00315/00035/pdf/00035.pdf
NEMES NAGY J. - coordinator (2005), Regionális elemzési módszerek [Methods for Regional
Analyses], Regionális Tudományi Tanulmányok 11, Macropolis Kiadó, Budapest.
RÉTI, T. – coordinator (2003), Közeledı régiók a Kárpát-medencében [On-coming Regions of the
Carpathian Basin], Európai Összehasonlító Kisebbségkutatások Közalapítvány, Budapest.
TÖRÖK G. (2007), A kis- és középvállalkozások számának idıbeli változása, térbeli megoszlásuk és
hatásuk a foglalkoztatottságra Romániában [Changes in the Number of SMEs Over Time,
their Spatial Distribution and the Impact on Employment in Romania],manuscript.
* * * Anuarele Statistice ale României [Statistical Yearbooks of Romania], 1990-2007, INS, Bucure ti.