USING TERRESTRIAL LASER SCANNERS TO CALCULATE AND MAP VERTICAL
BRIDGE CLEARANCE
Chengyi Zhang a, *, David Arditi b, Zhong Chen c
a Graduate student, Dept. of Civil, Architectural, and Environmental Engineering, Illinois Institute of Technology, Chicago, IL, United States - [email protected]
b Professor, Dept. of Civil, Architectural, and Environmental Engineering, Illinois Institute of Technology, Chicago, IL, United States - [email protected]
c President, uGRIDD Corporation, Chicago, IL, United States - [email protected]
KEY WORDS: 3D laser scanning, bridge clearance, geo-referenced, mapping
ABSTRACT:
The vertical clearance of a bridge over a highway is important in preventing oversized vehicles from hitting the bridge. The vertical clearance of a bridge is traditionally measured by using surveying equipment such as leveling rods and total stations. Typically, measurements are taken at multiple locations in order to determine the minimum vertical clearance under the bridge. This process is time and labor consuming. Also, these measurements may not be accurate because of the traffic, the uneven surface, and the reading error caused by the surveyor. Additionally, when one is faced with a multitude of reports especially in large projects with multiple ramps and bridges, it is not easy and it often takes a long time to find the bridge under study. This research provides a highly accurate measurement of the vertical bridge clearance by using terrestrial laser scanners. The clearance can be measured in the office by processing the collected point cloud data. The minimum vertical clearance is easily identified and the measurement is visualized and geo-referenced. An approach to reduce data noise caused by traffic is also introduced in this study. In addition, to help reduce the confusion of finding the bridge under study and to facilitate access to the clearance data, the clearance measurements are geo-referenced to an online mapping system. This system allows access to the final deliverable very easily through a single web portal. Finally, Illinois Department of Transportation’s Circle Interchange is used to demonstrate this new method.
1. INTRODUCTION
In United States, over two hundred million trips are taken daily across deficient bridges in the nation’s 102 largest metropolitan regions. There are almost 607,380 highway bridges. The average age of these bridges is currently 42 years. Structural damages occur when bridges reach to mid-age (ASCE Infrastructure Report Card, 2013). The main purpose of bridge inspection is to ensure public safety in bridge structural capacity and to protect the public investment. All these issues emphasize the importance of accurate and reliable geometric information about bridges. Geometric data, such as maximum span and minimum vertical clearance are the main parameters measured in the bridge inspection process.
An appropriate vertical clearance is one of the most important geometric requirements in bridge design, is mandated by the Federal Highway Administration, and is critical in determining the magnitude of possible collision damages (Dunker and Rabbat 1990). Traditionally, a bridge’s vertical clearance is measured by using surveying equipment such as ruler and total station. Typically, measurements are taken at multiple locations in order to determine the minimum vertical clearance under the bridge. This process is time and labor consuming, and not accurate. Besides, it is not safe for a surveyor to perform a measurement in the middle of the drive way with passing traffic. 3D laser scanning technology has become one of the most accurate and one of the fastest data acquisition methods compared to existing surveying techniques, such as theodolite, and total station (Chen et al.,
2005). Gordon and Lichti (2006) suggest that a detailed inspection of condition of a bridge and other structures can be conducted by laser scanning technology that allows for analyzing 3D point clouds and rebuilding the surface models of these structures. Hori et al. (2007) use laser scanner to determine the accuracy of original structural drawings compared to the as-built conditions. Liu et al. (2012) introduce an automatic bridge clearance measurement technique based on terrestrial scanning, which is part of a LIDAR-based bridge evaluation (LIBE) algorithm (Liu et al., 2009).
In large infrastructure projects, long-term data archiving has been a vexing challenge for owners, operators, contractors and other project stakeholders. Paper, documents such as plans, calculations, quantity sheets, schedules, punch li sts, spreadsheets, maps, etc., are difficult to index and manage physically, and can be tedious to consult (Chen, 2012). This can be frustrating. Many surveyors and engineers have had the experience of knowing that a particular map, or set of survey control coordinates, or bridge clearance logs have been produced by experts, but simply not being able to find them. This often requires that successful past work be redone. Owners and operators of infrastructure facilities may be especially frustrated since it is not so common for important documents to be transferred to them in an organized way (Chen, 2012).
This paper provides a highly accurate measurement of the vertical bridge clearance by using terrestrial laser scanners. The clearance was measured in the office by processing the
International Archives of the Photogrammetry, Remote Sensing and Spatial Information Sciences,
collected point cloud data. An approach to reduce data noise caused by traffic is also introduced in this study. In addition, to help reduce the confusion of finding the bridge under study and to facilitate access to the clearance data, the clearance measurements are geo- referenced to Google Maps using uGRIDD. This system allows access to the final deliverable very easily through a single web portal. Finally, Illinois Department of Transportation’s Circle Interchange is used to demonstrate this new method.
2. LASER SCANNING TECHNOLOGY
3D laser scanning is a relatively new surveying technology that captures the real scenery and translates it into a 3D virtual world. It utilizes light detection and ranging to produce accurate 3D representations of objects. A laser scanner consists of an emitting diode that produces a light source at a specific frequency. A mirror directs the laser beam horizontally and vertically towards the object. The surface of the object then reflects the laser beam. Using the principles of pulse time of flight, the distance to the object can be determined by the transit time. The result of a scan produces a collection of points in space, commonly known as “point clouds,” which can be processed and combined into accurate 3D models (Su et al., 2006). Stationary terrestrial laser scanning technology refers to laser scanning applications that are performed from a static point on the surface of the earth (CDOT, 2011). It can be described as a motorized total station, which measures automatically all the points in its horizontal and vertical field. The points are captured with its distance to the laser scanner, horizontal and vertical angles (Abdelhafez and Niemeier, 2009) shown in Figure 1.
Figure 1. Laser scanning measuring technology (CDOT, 2011)
Terrestrial laser scanners scan the surface of object by obtaining X, Y, Z coordinates within seconds, possibly with color information, i.e., RGB (Red, Green, and Blue) depending on the function of the scanner and the distance between the scanner and the object. The point cloud data acquired by the scanning process may be in an XYZIRGB (X, Y, Z coordinate, return Intensity, and Red, Green, Blue color values) format if color information is available. The point cloud data structure is shown in Table 1.
Table 1 Point cloud data structure
Coordinates Color Information
X Y Z I R G B
53238.001 274986.273 5.923 -1319 29 22 16
53237.555 274986.015 5.920 -1252 36 27 20
53237.728 274986.071 5.922 -1359 40 27 19
53238.001 274986.095 5.923 -1342 25 18 12
There are two different types of scanners that are commonly used in 3D laser scanning. Phase-based scanners utilize a constant beam of laser energy that is emitted from the scanner. The change of phase of the laser light is measured to
allow the scanner to calculate distances. Phase-based scanners are typically used in industrial applications or interior architectural spaces to populate detailed building information models of existing facilities. The advantage of this technology is the significant speed of data capture. The major limitation is a short range, but this limitation does not preclude its use in progress monitoring applications like the system proposed here. Time-of- flight scanners emit a pulse of light which measures the amount of time it takes to travel from the scanner to the object and back allowing the scanner to calculate the distance. The key benefit of this type of laser scanning technology is its long range. But these scanners can collect fewer points per second compared to phase- based scanners. Time-of-flight technology is typically used for topographic surveys of roadways and as-built structures.
3. EQUIPMENT AND SOFTWARE
More than ten manufacturers produce laser scanners. Since the useful ranges of laser scanner are different, and since the accuracy of the scan data diminishes beyond a certain distance, the right scanner should be selected before starting performing a laser scan. The right scanner should be determined by factors such as the range and accuracy specifications of the scanner, the accuracy requirements of the project, the cost of the scanner as well as the budget of the entire project. Dynasty Group, Inc., Chicago, IL provided the scanners and software used in this study. The Leica C10 shown in Figure 2 was selected to conduct the study.
Figure 2. Lecia C10 scanner
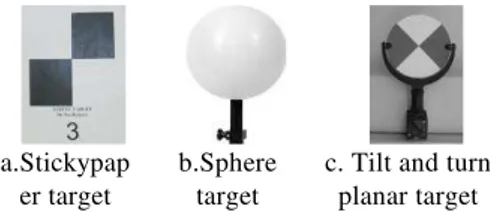
Targets are used as control points for registration purposes. A flat target can be stuck on a surface as shown in Figure 3a, a spherical target shown in Figure 3b and a tilt-and-turn planar target shown in Figure 3c can be mounted to a tripod.
a.Stickypap er target
b.Sphere target
c. Tilt and turn planar target
Figure 3. Different types of targets
Scanners are typically set up on a tripod. A tripod is a portable three-legged frame as shown in Figure 4a, used as a platform for supporting the weight and maintaining the stability of an object. A tripod provides stability against downward forces and horizontal forces and movements about horizontal axes. A tribrach is an attachment plate (Figure 4b) used to attach a laser scanner, or a target to a tripod. A tribrach allows a scanner to be repeatedly placed in the same position with sub-mm precision, by just loosening and re-tightening a locking screw. Some laser scanners come with a tribrach. No additional one needed.
International Archives of the Photogrammetry, Remote Sensing and Spatial Information Sciences,
a. Tripod b. Tribrach
Figure 4. Tripod and tribrach
When performing a scan, one should follow OSHA Regulation 1926.54 (2010) and manufacturers’ recommendations regardless of the type and grand laser equipment used. One should never stare into the laser beam or view laser beams through magnifying optics, such as telescopes or binoculars. Operators should never direct the laser toward personnel operating instruments with magnifying optics such as total stations or levels. The eye safety of workers and the traveling public and other people should be considered at all times and the equipment should be operated in a manner to ensure the eye safety of all (OSHA Regulation 1926.54, 2010).
After performing a 3D laser scan, the raw point cloud data need to be processed. There are many software packages such as Faro Scene, Maptek I-Site, ScanMaster, Quantapoint, and Cyclone that provide service for point cloud data from registration to 3D modeling to many other applications. In this research, Cyclone is selected as the software to process point cloud data because it is a software developed by Leica, the manufacturer of 3D laser scanner used in the study, hence avoiding compatibility problems in between the software and the equipment, and avoiding the cost of purchasing a new software since Cyclone comes with the Leica 3D laser scanner.
4. CAPTURE OF POINT CLOUD DATA
Before starting laser scanning, the environment of the project should be considered to determine the best time to collect data in order to minimize noise from traffic or other factors. Also, obstructions that may cause data voids or shadows should be identified. The scanner set-up plays an important role in the quality of the resulting point cloud.
The location of the scanner should be carefully established before scanning is performed by considering the factors mentioned in the preceding paragraph. A bridge deck with much traffic may not be a good place to perform scanning. Safety should always be taken into consideration when designing the location of the scanner. A tall tripod or high position may be used to help reduce noise and avoid obstructions from traffic and pedestrians. Site conditions, project requirement, and the capabilities of the available scanners should be considered to determine the distance of the scans. Some areas that are difficult to scan need to be identified at the beginning. Multiple scans should be performed to minimize the occlusion effect. A good resolution setting or multiple setups increase scan density, and hence accuracy.
Control points are used to adjust, geo-reference, and combine different scans together in the registration step. Control points can be the target or the center of the scanner. Targets should be placed at the recommended optimal distance from the scanner according to the scanners’ manual. There should be at
least one target in each quadrant. Maximum scanner range and accuracy capabilities may limit effective scan coverage.
Once the location of the scanner and control system are designed, the scans can be performed by the following setup. (1) Setup the tripod. One should make sure the tripod’s legs are locked tight and sunk into the ground. The scanner position must remain fixed during the scanning process. To ensure the safety of the equipment, the scanner should be secured well to reduce the risk of it being knocked over and getting damaged. At least, one crew member needs to watch the scanner during the scanning. (2) Secure the tribrach to the tripod. If the scanner comes with a tribrach, for example Leica C10, skip this step. Install the tribrach and level the tribrach by tightening/loosening the leveling screws until the bubble is leveled. (3) Carefully mount the scanner. Make sure the three mount prongs located at the bottom of the scanner are completely inserted into the three holes of the tribrach. One should always stand nearby serve as a “spotter” when mounting the scanner, especially if the scanner is set on an uneven surface or at a high position. One should measure and record the height of the instrument and height of the targets at the completion of each set-up. Perform system calibration if needed.
5. DATA ACQUISITION AND ANALYSIS
Once the point cloud data is downloaded, a process called registration is performed. Registration is the process of integrating several scans into a single coordinate system. The registration process performs optimal alignment transformations to make sure that the targets used as constraints are aligned as closely as possible. After registration, the coordinates of all point cloud data are the same as the control system.
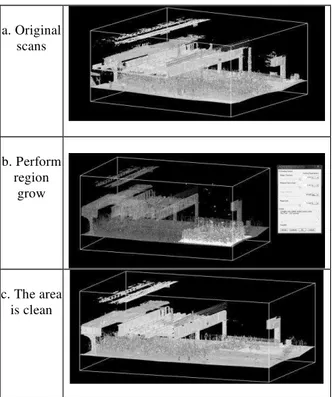
In real construction conditions, the data collected may be noisy and difficult to be interpreted. A “region grow” technology is applied to automatically reduce the noise caused by people, equipment, traffic, etc. that happen to be between the scanner and the object that is being scanned. Region grow is done by picking one or more points within the region that contains a supported shape (patch, prism, cylinder, or sphere), and then choosing the “region grow” option of Cyclone. Scans from an urban train station are selected as an example to illustrate how region growing eliminates noise from the data. As observed in the original scans seen in Figure 5a, the data on the street is noisy due to pedestrian and car traffic. Only a part of the model seen in Figure 5b is selected to show how region growing works. When the region grow function is performed, parameters are defined to control the thickness of the ground, the level of detail, and the size of the region. The region grow results are shown in Figure 5c. Note that all traffic on the portion of the street defined in Figure 5b has been removed.
International Archives of the Photogrammetry, Remote Sensing and Spatial Information Sciences,
a. Original scans
b. Perform region
grow
c. The area is clean
Figure 5. Region grow
After the noisy data is removed, the point cloud data can be used to measure the vertical clearance of the bridge. Traditionally, vertical clearance is measured by using surveying equipment such as measuring tape, ruler and total station. Typically, measurements are taken at multiple locations in order to determine the minimum vertical clearance under the bridge. This process is time and labor consuming, and not accurate. Besides, it is not safe for a surveyor to perform a measurement in the middle of the road with traffic as shown in Figure 6. By using laser scanning technology, the entire bridge information is stored in point clouds data and clearance measurements can be taken in the office with high accuracy by calculating the distance between the road surface and the overhead surface at several different locations as shown in Figures 7 and 8. After the clearance is measured, a vertical clearance report of the specific bridge is generated. The report is then mapped to Google Map by extracting the geo-referenced information from the point cloud data.
Figure 6. Vertical clearances in the perspective view
Figure 7. Vertical clearances in the plan view
Figure 8. Vertical clearances taken in the elevation view
6. CASE STUDY
The I-90/94 and I-290 Circle Interchange, located in the heart of downtown Chicago, adjacent to the west end of the central business district, was originally built in the late 1950s and early 1960s. It links the Dan Ryan Expressway (I-90/94) to the south, the Kennedy Expressway to the north (I-90/94), the Eisenhower Expressway (I-290) to the west, and Congress Parkway to the east. The Circle Interchange shown in Figure 9, is critical to the Chicago's transportation system, particularly for freight movement on Interstate and arterial roadways, as well as to regional railroads and waterways.
According to the American Transportation Research Institute and the Federal Highway Administration, the Circle Interchange is the slowest and most congested highway freight bottleneck in the nation with more than 300,000 vehicles traveling through the Interchange on a daily basis, and over 1,100 crashes reported on average per year. In August 2012, the Illinois Department of Transportation (IDOT) began the planning and design phases for the potential rehabilitation of the Circle Interchange.
Figure 9. Circle Interchange
In order to avoid the noisy data and occlusions caused by the traffic, especially large trucks, scans were perform at midnight. One hundred and fifty scans were performed in a one-month period to capture thirty seven bridges in the circle interchange. The Leica C10 scanner was selected for use in this project. For each bridge, four scans were performed to achieve maximum point cloud coverage. The scanner was
International Archives of the Photogrammetry, Remote Sensing and Spatial Information Sciences,
typically set up along the shoulder outside of the bridge as shown in Figure 10.
Figure 10. Scanner’s location
The point cloud data was registered into the State Plane Coordinate system for geo-referencing purposes. Multiple clearances were measured from the pavement to the lower beam of the bridge to define the minimum vertical clearance. The result was compared to the current design standards shown in Table 2.
Table 2. Ranges for minimum vertical clearance (2011, A Policy on Geometric Design of Highways and Streets, 6th Edition, AASHTO)
Type of Roadway
Rural Urban
US (feet)
Metric (meters)
US (feet)
Metric (meters) Freeway 14–16* 4.3–4.9* 14–16* 4.3–4.9* Arterial 14–16* 4.3–4.9* 14–16* 4.3–4.9* Collector 14 4.3 14 4.3
Local 14 4.3 14 4.3
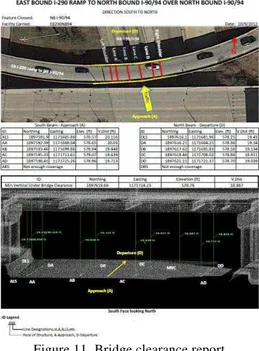
For each bridge, a bridge clearance report was generated as shown in Figure 11.
Figure 11. Bridge clearance report
uGRIDD is a web-based service provider that offers geo- referencing of infrastructure data. One of uGRIDD’s functions called “Data2Map” was used in this research to geo -reference bridge clearance reports to Google map. By extracting the State Plane coordinates of each bridge and projecting it to the WGS 84 coordinates system, the location
of each report was located on Google map as shown in Figure 12.
Figure 12. Brige clearance on Google Map
Each red dot represents a bridge clearance report. When one clicks on it, detailed information, such as the bridge name, northing, easting, elevation, and a printable PDF file for download show up in a bubble as shown in Figure 13.
Figure 13. Clearance report information
For security reason, some data may be sensitive and perhaps should not be available to the public. Codes were created to secure the information. Only authorized person, who have been issued invitation codes could view the information as shown in Figure 14. The final product is a simple URL that can be opened and shared with other authorized project participants.
Figure 14. Invitation code
7. CONCLUSION
This paper presented a new method to measure bridge clearance. A method that uses laser scanning technology to collect geo- referenced high definition point cloud data to create clearance report has been thoroughly described. An approach to reduce data noise caused by traffic was implemented. In addition, to help reduce the confusion of finding clearance information about a bridge under study and to facilitate access to the clearance data, a system called uGRIDD was used to geo-reference the clearance measurements to Google Map. This system allows access to the final deliverable very easily through a popular web portal.
ACKNOWLEDGEMENT
International Archives of the Photogrammetry, Remote Sensing and Spatial Information Sciences,
This research would not have been possible without the guidance, assistance, and funding provided by the Dynasty Group, Inc. and the uGRIDD Corporation, both located in Chicago, IL.
REFERENCE
AASHTO. (1994). “A policy on geometric design of highways and streets.” Washington, DC.
Abdelhafiz A. and Niemeier W. (2009). Integration of Digital Images and Laser scanning Point Clouds - Texture Mapping with 3DImage. 91. DVW-Seminar Terrestrial laser scanning TLS2009, ISBN 978-3-89639-734-8, Fulda, Germany, November 19-20. Journal of DVW 60/2009.
ASCE America’s infrastructural report card, 2013.
California Department of Transportation (2011). Terrestrial laser scanning specifications.
Chen, X.N., Xia, Q., Zhang, S.H. and Zhou, Y. (2005). "3D Laser Scanner System for Surveying and Engineering". Department of Photogrammetry and Remote
Chen, Z. (2012) The Coming Revolution in Digital Data Management,
http://geodatapoint.com/articles/view/the_coming_revolution_i n_digital_data_management
Dunker, K. F., and Rabbat, B. G. (1990). “Performance of highway bridges.” Concr. Int., 12(8), 40–42.
Federal Highway Administration (2010), Status of the Nation's Highways, Bridges, and Transit: Conditions & Performance.
Lichti, D.D. and Gordon, S.J. (2004). Error propagation in directly geo-referenced terrestrial laser scanner point clouds for cultural heritage recording, Proceedings of WSA2 Modeling and Visualization, Athens, Greece.
Liu, W., Chen, S., and Hasuer, E. (2012). ”Bridge Clearance Evaluation Based on Terrestrial LIDAR Scan.” J. Perform. Constr. Facil., 26(4), 469–477.
OSHA Regulation 1926.54. U.S. Department of labor occupational outlook handbook 2010-11 edition
Su, Y. Y., Hashash, Y. M. A., and Liu, L. Y. (2006). “Integration of construction as-built data via laser scanning with geotechnical monitoring of urban excavation.” Journal of Construction Engineering and Management, 132(12), 1234-1242.
Yoshiki HORI, Osamu Ajioka, Asami Hanghai, Laser Scanning in Pompeian City wall A comparative study of accuracy of the drawings from 1930s to 1940s,3D-Arch’2007 3D Virtual Reconstruction and Visualization of Complex Architectures,2007.07
International Archives of the Photogrammetry, Remote Sensing and Spatial Information Sciences,