Ciência Rural, v.47, n.4, 2017.
Methods of analysis and number of replicates for trials with large
numbers of soybean genotypes
Métodos de análise e número de repetições para ensaios com grande número de genótipos de soja
Gilvani Matei1 Giovani Benin1* Lindolfo Storck2 Anderson Simionato Milioli1 Antonio Henrique Bozi1 Samuel Cristian Dalló1 Ricardo Antonio Lucion1
ISSNe 1678-4596
Received 06.29.16 Approved 11.12.16 Returned by the author 12.19.16 CR-2016-0629.R1
INTRODUCTION
Planning for genotype evaluation trials is
a very important activity for qualification of results in
genetic breeding programs. This activity is even more important when the number of entries (genotypes) is large, as usually occurs in breeding programs. For these cases, most appropriate designs and analysis methods are reported, e.g., single and triple lattice designs (RAMALHO et al., 2000) and the Papadakis spatial analysis method. This was applied in various cases with a smaller number of soybean genotypes (VOLLMAN et al., 2000; STORCK et al., 2008; BENIN et al., 2013),
showing significant accuracy gains when compared
to the random complete block design. Appropriate measures to assess the experimental precision in bean and soybean genotypes competition assays were studied (CARGNELUTTI FILHO et al., 2009), and they can be used to identify the best planning and data analysis.
Bean yield data with 25 to 400 genotypes and lattice design were used, and it was observed that the Papadakis method contributes to improve the local
control efficiency (COSTA et al., 2005). In wheat, it
was observed that the indices of experimental precision measurements improved with use of the Papadakis method, and the number of replicates necessary to
1Programa de Pós-graduação em Agronomia, Universidade Tecnológica Federal do Paraná (UTFPR), Pato Branco, PR, Brasil. E-mail:
[email protected]. *Corresponding author.
2Programa de Pós-graduação em Agronomia, Universidade Federal de Santa Maria (UFSM), Santa Maria, RS, Brasil.
ABSTRACT: The aim of this study was to evaluate the experimental precision of different methods of statistical analysis for trials with large numbers of soybean genotypes, and their relationship with the number of replicates. Soybean yield data (nine trials; 324 genotypes; 46 cultivars; 278 lines; agricultural harvest of 2014/15) were used. Two of these trials were performed at the same location, side by side, forming a trial with six replicates. Each trial was analyzed by the randomized complete block, triple lattice design, and use of the Papadakis method.
The selective accuracy, least significant difference, and Fasoulas differentiation index were estimated, and model assumptions were tested. The resampling method was used to study the influence of the number of replicates, by varying the number of blocks and estimating the precision
measurements. The experimental precision indicators of the Papadakis method are more favorable as compared to the randomized complete block design and triple lattice. To obtain selective accuracy above the high experimental precision range in trials with 324 soybean genotypes, two repetitions can be used, and data can be analyzed using the randomized complete block design or Papadakis method.
Key words: Glycine max, resampling, experimental precision, experimental design, selective accuracy.
RESUMO: O objetivo deste estudo foi avaliar a precisão experimental de diferentes métodos de análise estatística para ensaios com grande
número de genótipos de soja e sua relação com o número de repetições. Foram usados dados de produtividade de grãos de soja (nove ensaios,
324 genótipos, 46 cultivares, 278 linhagens, safra agrícola de 2014/15). Dois destes ensaios foram realizados no mesmo local, lado a lado, constituindo um ensaio com seis repetições. Cada ensaio foi analisado pelos delineamentos de blocos ao acaso, látice triplo e uso do método
de Papadakis. Foram estimados a acurácia seletiva, diferença mínima significativa e índice de diferenciação de Fasoulas, e, ainda foram testados os pressupostos do modelo. O método de reamostragem foi usado para estudar a influência do número de repetições, variando o
número de blocos e estimando as medidas de precisão. Os indicadores de precisão experimental do método de Papadakis são mais favoráveis, quando comparados com os delineamentos de blocos ao acaso e látice triplo. Para obter acurácia seletiva acima da faixa de alta precisão experimental em ensaios com 324 genótipos de soja, pode-se usar duas repetições e analisar os dados, usando o delineamento de blocos completos ao acaso ou método de Papadakis.
Palavras-chave: Glycine max, reamostragem, precisão experimental, delineamento experimental, acurácia seletiva.
Ciência Rural, v.47, n.4, 2017. predict genotype performance was reduced (STORCK
& SILVA, 2014). Similar results were obtained in soybean trials with a small number of genotypes, and it was observed that the Papadakis method allowed to reduce the number of replicates (STORCK et al., 2009). In breeding programs, obtaining information about the best analysis method and the most appropriate number of replicates is extremely important to conduct competition assays with a large number of genotypes. This information allows to improve network testing
and efficiency in the identification of most promising
genotypes. Precision of trials, with a large number of soybean genotypes and analyzed by different methods, is still unknown. Number of replicates suitable for trials with a large number of genotypes is also not known. The aim of this study was to evaluate both the experimental precision of different statistical analysis methods, with a large number of soybean genotypes, and their relationship with the number of replicates.
MATERIALS AND METHODS
Data on soybean yield of nine trials were used (324 genotypes obtained in the 2014/15 harvest). Among the genotypes, lines from bi-parental crosses (generation F7:8 of the Nidera Sementes Ltda breeding program) (240), advanced lines of the program (38), and commercial cultivars recommended for the soybean cultivation macroregions 1 and 2 (46) were evaluated. The triple lattice experimental design with three replicates was used. Each repetition (complete block) was arranged in six rows of three incomplete blocks (18 incomplete blocks) and each incomplete block contained 18 genotypes. Each plot comprised four 5-m length lines, with 0.50-m spacing between lines. The two central lines of each plot were used to obtain the grain yield data. A seeding density of 30 seeds m-2 was used, and the basic fertilization consisted of NPK (02:20:20; 350kg ha-1). Procedures for the control of weeds, pests, and diseases met the technical recommendations for the culture.
The trials were conducted in the state of Paraná (PR), in the cities of Cambé (lat: 23°11’ S; long: 51°17’ W; alt: 520m), Corbélia (lat: 24°32’ S; long: 53°18’ W; alt: 650m), Mamborê (lat: 24°13’ S; long: 52°32’ W; alt: 715m), Palotina (lat: 24°18’ S; long: 53°50’ W; alt: 330m), Realeza (lat: 25°42’ S; long: 53°32’ W; alt: 520m), São Jorge do Ivaí (lat: 23°25’ S; long: 52°18’ W; alt: 560m), and São Miguel do Iguaçu (lat: 25°15’ S; long: 54°14’ W; alt: 290m), and in the state of São Paulo (SP), in the city of Cândido Mota (lat: 22°46’ S; long: 50°23’ W; alt: 440m). In Corbélia city (PR), two side-by-side trials were performed, also forming an experiment with six complete blocks or a duplicate triple lattice design with 1944 plots.
Analysis of variance was performed according to the triple lattice design for each trial. Genes (CRUZ, 2013) software was used in these analyzes. The same trials were also analyzed using the randomized complete block design (RCBD) and spatial analysis or Papadakis method, using DelPapa (STORCK et al., 2015) software. From these analyzes, precision measurements
were obtained as follows: relative efficiency for the use
of complete block in relation to completely randomized
design (CRD); relative efficiency of the use of triple lattice in relation to RCBD; error variation coefficient (VCe); genetic variation coefficient (VCg); ratio VCe/
VCg; and selective accuracy (SA), which was estimated as: SA = (1-1/F)1/2, for F>1, and SA = 0, for F<1, in which F is the F test value for the genotype. The least
significant difference (LSD) between genotypes was also
obtained by the Tukey test. The Fasoulas differentiation index (FDI) was calculated using the expression:
,
and mi is the number of averages that the ith genotype
statistically exceeds, after the Tukey test (α=0.05) was
applied. The FDI is the percentage of the number of
significant differences between means, which the method
of multiple comparisons of means (Tukey) could detect in relation to the total number of pairs of means.
Mathematical model additivity was evaluated by the non-additivity test (STEEL et al., 1997). Regarding error estimates, homogeneity between
genotype variances was verified using the Bartlett test (STEEL et al., 1997) with α=0.05. Normality of
distribution and error randomness was assessed by the
Shapiro-Wilk test (α=0.05) (STORCK et al., 2015).
Averages estimated by analysis with the random block design, and those obtained using the triple lattice analysis and Papadakis method, were used
to estimate the Pearson linear correlation coefficients
and Spearman non-parametric method.
Considering that a six-replicate experiment (six complete blocks) was also conducted in the city of Corbélia (PR), with plots arranged according to a 36-row and 54-column matrix, block resampling (replicate) was possible using the R (R Development Core Team, 2015) program. First, taking into account the six blocks, 2000 replicas were resampled, with replacement, for analysis by the randomized complete block design (RCBD) and Papadakis (Papa) methods. In each method and analysis, the precision measurements (SA, VCe, VCg, VCg/VCe, LSD, and FDI) were obtained with the additivity, randomness, normality, and variance homogeneity assumptions. The 2000 results of each precision measurement were used to determine the mean value and the 0.025 (LL) and 0.975 (UL) percentiles as
being a bootstrap confidence interval estimate (α=0.95).
Ciência Rural, v.47, n.4, 2017. The 2000 resampling procedure was also performed in
the cases of five, four, three, and two blocks per trial,
and the mean, LL, and UL values were obtained for each precision measurement and number of replicates.
RESULTS AND DISCUSSION
Methods of analysis
In all trials and analysis methods, genotype
effects were significant (α<0.01). According to the
randomized complete block design (RCBD), analysis
relative efficiency is low in all trials relative to the
completely randomized design (CRD). Similarly,
efficiency in using triple lattice is low relative to RCBD (Table 1). Block effect was significant (α<0.05) in five of nine trials (55.0%) and significance did not result in greater relative efficiency. A study of soybean (226 trials) showed that the average relative efficiency in
block use was equal to 135% (range: 102.7-215.0%) when the number of genotypes is low (10 to 20), and
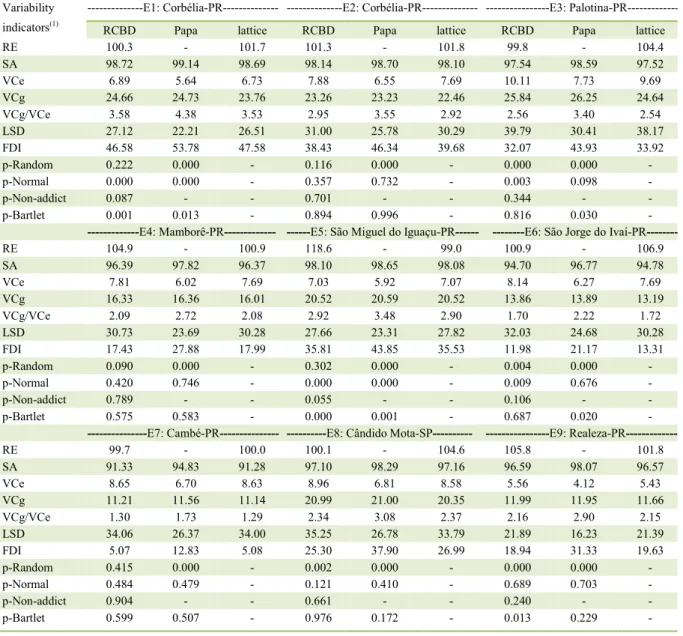
Table 1 - Variability indicators obtained using the randomized complete block design (RCBD), Papadakis (Papa) method, and triple lattice for nine environments (E) in Paraná (PR) and São Paulo (SP), Brazil, in the 2014/15 harvest.
Variability
indicators(1)
---E1: Corbélia-PR--- ---E2: Corbélia-PR--- ---E3:
Palotina-PR---RCBD Papa lattice RCBD Papa lattice RCBD Papa lattice
RE 100.3 - 101.7 101.3 - 101.8 99.8 - 104.4
SA 98.72 99.14 98.69 98.14 98.70 98.10 97.54 98.59 97.52
VCe 6.89 5.64 6.73 7.88 6.55 7.69 10.11 7.73 9.69
VCg 24.66 24.73 23.76 23.26 23.23 22.46 25.84 26.25 24.64
VCg/VCe 3.58 4.38 3.53 2.95 3.55 2.92 2.56 3.40 2.54
LSD 27.12 22.21 26.51 31.00 25.78 30.29 39.79 30.41 38.17
FDI 46.58 53.78 47.58 38.43 46.34 39.68 32.07 43.93 33.92
p-Random 0.222 0.000 - 0.116 0.000 - 0.000 0.000 -
p-Normal 0.000 0.000 - 0.357 0.732 - 0.003 0.098 -
p-Non-addict 0.087 - - 0.701 - - 0.344 - -
p-Bartlet 0.001 0.013 - 0.894 0.996 - 0.816 0.030 -
---E4: Mamborê-PR--- ---E5: São Miguel do Iguaçu-PR--- ---E6: São Jorge do Ivaí-PR
---RE 104.9 - 100.9 118.6 - 99.0 100.9 - 106.9
SA 96.39 97.82 96.37 98.10 98.65 98.08 94.70 96.77 94.78
VCe 7.81 6.02 7.69 7.03 5.92 7.07 8.14 6.27 7.69
VCg 16.33 16.36 16.01 20.52 20.59 20.52 13.86 13.89 13.19
VCg/VCe 2.09 2.72 2.08 2.92 3.48 2.90 1.70 2.22 1.72
LSD 30.73 23.69 30.28 27.66 23.31 27.82 32.03 24.68 30.28
FDI 17.43 27.88 17.99 35.81 43.85 35.53 11.98 21.17 13.31
p-Random 0.090 0.000 - 0.302 0.000 - 0.004 0.000 -
p-Normal 0.420 0.746 - 0.000 0.000 - 0.009 0.676 -
p-Non-addict 0.789 - - 0.055 - - 0.106 - -
p-Bartlet 0.575 0.583 - 0.000 0.001 - 0.687 0.020 -
---E7: Cambé-PR--- ---E8: Cândido Mota-SP--- ---E9: Realeza-PR
---RE 99.7 - 100.0 100.1 - 104.6 105.8 - 101.8
SA 91.33 94.83 91.28 97.10 98.29 97.16 96.59 98.07 96.57
VCe 8.65 6.70 8.63 8.96 6.81 8.58 5.56 4.12 5.43
VCg 11.21 11.56 11.14 20.99 21.00 20.35 11.99 11.95 11.66
VCg/VCe 1.30 1.73 1.29 2.34 3.08 2.37 2.16 2.90 2.15
LSD 34.06 26.37 34.00 35.25 26.78 33.79 21.89 16.23 21.39
FDI 5.07 12.83 5.08 25.30 37.90 26.99 18.94 31.33 19.63
p-Random 0.415 0.000 - 0.002 0.000 - 0.000 0.000 -
p-Normal 0.484 0.479 - 0.121 0.410 - 0.689 0.703 -
p-Non-addict 0.904 - - 0.661 - - 0.240 - -
p-Bartlet 0.599 0.507 - 0.976 0.172 - 0.013 0.229 -
(1) RE: relative efficiency; SA: selective accuracy; VCe: error variation coefficient; VCg: genetic variation coefficient; LSD: least significant
Ciência Rural, v.47, n.4, 2017.
the block effect was significant (29.0% of the trials) (STORCK et al., 2008). The value for relative efficiency
was equal to 127.0% in the evaluation of grain yield (100 soybean genotypes) using a triplicate triple lattice design (nine replicates) (BARONA et al., 2009). In a study with soybean yield data (25-60 genotypes) in lattice design (nine trials), the average relative
efficiency in the lattice design was 186% (range: 101-402%), and the variation coefficient (VC) was 12%.
The VC value was determined for the RCBD (17.5%) and Papadakis method (11.0%) with variation in the number of neighboring plots in the covariate estimate (VOLLMANN et al., 2000). Progenies of Eucalyptus (121) of two ages were analyzed in two different locations, according to the lattice design (11x11), with
three replicates, and the Papadakis method efficiency was observed only when the lattice was also efficient
(145%) (SOUZA et al., 2003). Thus, in this study, the precision gain due to the use of triple lattice was limited because high precision already existed in the analysis by use of the design in random complete blocks.
Taking into account the precision measurements (SA, VCg/VCe, LSD, and FDI), use of
the Papadakis method showed a higher efficiency (more
accurate) in all trials compared to the RCBD and triple lattice models. In the study of 226 trials by STORCK et al. (2008), LSD was reduced (from 41.5 to 30.6%) and FDI was increased (from 5.0 to 13.1) with use of the Papadakis method relative to RCBD. In this study, different values were obtained for LSD with the use of RCBD (31.1%) and Papadakis method (24.4%; 6.7% less). In addition, average values were also obtained for FDI using RCBD (25.7) and Papadakis method (35.4; 9.7 more units). Thus, despite the large number of genotypes assessed in this study, the results obtained for the two precision measures cited above were similar, indicating that the Papadakis method provides higher accuracy compared to RCBD and triple lattice.
Selective accuracy (SA) was very high (SA>90%; RESENDE & DUARTE, 2007) and similar
in all trials and analysis methods, ranging from 91.3% (RCBD; Cambé-PR) to 99.1% (Papa; Corbélia-PR). It is likely that the methodologies did not show difference, due to the high precision (low experimental error) in these trials, with a large number of genotypes. In a study of 216 soybean trials, with a variable number of genotypes (10-20), the SA values were very high (90%<SA) in 15.5% of the trials and high (70%<SA<90%) in 59% of trials (CARGNELUTTI FILHO et al., 2009). In the present study, all (100%) trials (and methods) presented very high SA values, and thus accuracy differences between analysis methods are small, and all of them belong to the same (very high) accuracy class.
Regarding assumptions, the additivity model was not rejected in the nine trials. Regarding analysis in RCBD, randomness (5), variance homogeneity (6), and normality (5) were observed in the trials. Regarding use of the Papadakis method, results for normality and homogeneity were similar. In addition, lack of error randomness was observed due to adjustment of plot values as a function of mean errors in the neighboring plots.
Adjustment in the average values (by the Papadakis method or lattice design) did not change their ordination (via Spearman correlation) and relationship between means (via Pearson correlation) not adjusted in the analysis with the RCBD model (data not shown). Taking into account the high number of genotypes and the very high accuracy (SA>90%) in this study, it seems reasonable to assume that there is no bias in the adjustment of means when the triple lattice design and Papadakis method are used. However, spatial analysis in a trial of 115 soybean genotypes, led to a different ordering of lines relative to the non-spatial analysis (DUARTE & VENCOVSKY, 2005).
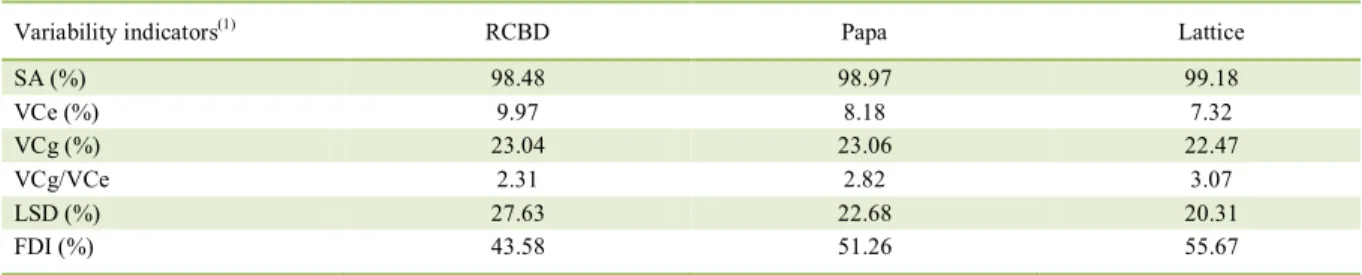
On average, the precision measurements (SA, LSD, and FDI), as obtained by analysis of the duplicate triple lattice design (six replicates), are higher than those obtained by the RCBD or Papadakis method in six replicates (Table 2). However, the differences are
Table 2 - Variability indicators obtained using the randomized complete block design (RCBD; six blocks), Papadakis method (Papa; six blocks), and duplicate triple lattice design in soybean trials conducted in the 2014/15 harvest.
Variability indicators(1) RCBD Papa Lattice
SA (%) 98.48 98.97 99.18
VCe (%) 9.97 8.18 7.32
VCg (%) 23.04 23.06 22.47
VCg/VCe 2.31 2.82 3.07
LSD (%) 27.63 22.68 20.31
FDI (%) 43.58 51.26 55.67
(1)
Ciência Rural, v.47, n.4, 2017. small and the method can be chosen by precaution, in
which efficiency of the analysis method depends on the
number of entries and spatial variation of the plots in the experimental area.
Number of replicates
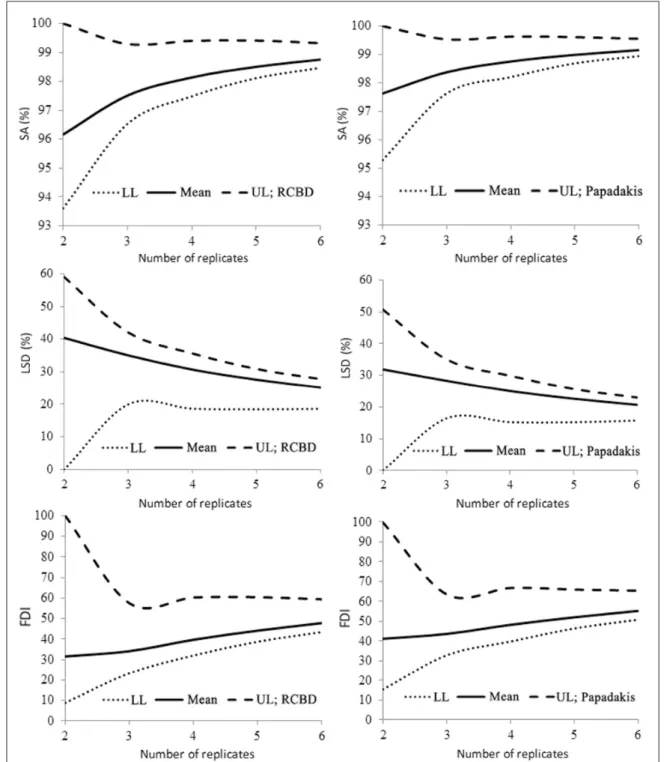
Influence of number of replicates on the
experimental precision, as measured by SA, LSD
and FDI is shown in figure 1. As can be seen, the
Figure 1 - Selective accuracy (SA), least significant difference (LSD) by the Tukey test (5%) in percentage of the mean, and variation in the Fasoulas differentiation index (FDI); mean, lower limit (LL), and upper limit (UL) of the confidence interval, by resampling (1-α=0.95) for different number of replicates, and using the randomized complete block design
Ciência Rural, v.47, n.4, 2017. accuracy gain is low from three replicates on, in
the analyses of both randomized complete block design (RCBD) and Papadakis method. If amplitude
of the confidence interval is considered in the
precision measurements of this study, difference between accuracy values obtained for two or three replicates was not observed. A possible reason is that accuracy is already high, and little can be gained by increasing the number of replicates and varying the method of analysis. In RCBD, estimates of SA and FDI were lower than those obtained by the Papadakis method for any number of replicates. In a study of 175 competition trials of irrigated rice in RCBD, with number of genotypes in the range of 5-36, SA was suitable to evaluate experimental
precision in the trials and use of more than five
replicates was of little contribution to precision gains (CARGNELUTTI FILHO et al., 2012). In another study with 101 maize yield trials, in RCBD, FDI was also suitable to classify the experimental precision (CARGNELUTTI FILHO & STORCK, 2007). In this study, it was observed that FDI values in RCBD are smaller than those obtained using the Papadakis method with any number of replicates.
A trial is considered very accurate if SA>90%. Such a high accuracy was obtained using
two replicates, due to the LL values of the confidence
interval for RCBD (93.6%) and Papadakis method (95.3%). Thus, use of only two repetitions can be recommended for trials containing 324 soybean genotypes, and the analysis can be performed using the RCBD or Papadakis method. Based on these results, however, it cannot be stated that the simple lattice method (two replicates) can be used, as this situation was not analyzed by resampling. Block resampling with replacement does not assures genotype distribution as recommended by the “simple lattice” method.
CONCLUSION
Papadakis method has more reliable experimental precision indicators when compared to the randomized complete block design and triple lattice method. For trials with 324 soybean genotypes, it is possible to use two replicates and analyze the data with the randomized complete block design or Papadakis method as a precaution to obtain selective accuracy above the range of high experimental precision.
REFERENCES
BARONA, M.A.A. et al. Epistasis for grain yield in soybeans.
Bragantia, v.68, n.2, p.313-318, 2009. Available from: <http://
www.scielo.br/pdf/brag/v68n2/04.pdf>. Accessed: Jun. 24, 2016. doi: 10.1590/S0006-87052009000200004.
BENIN, G. et al. Improving the precision of genotype selection in wheat performance trials. Crop Breeding and Applied Biotechnology, v.13, p.234-240, 2013. Available from: <http:// www.scielo.br/pdf/cbab/v13n4/a03v13n4.pdf>. Accessed: Jun. 24, 2016. doi: 10.1590/S1984-70332013000400003.
CARGNELUTTI FILHO, A. et al. Measurements of experimental precision and number of replicates in rice genotype trials. Pesquisa Agropecuária Brasileira, v.47, n.3, p.336-343, 2012. Available from: <http://www.scielo.br/pdf/pab/v47n3/04.pdf>. Accessed: Jun. 24, 2016. doi: 10.1590/S0100-204X2012000300004.
CARGNELUTTI FILHO, A.; STORCK, L. Evaluation statistics of the experimental precision in corn cultivar trials. Pesquisa Agropecuária Brasileira, v.42, n.1, p.17-24, 2007. Available from: <http://www.scielo.br/pdf/pab/v42n1/03.pdf>. Accessed: Jun. 24, 2016. doi: 10.1590/S0100-204X2007000100003.
CARGNELUTTI FILHO, A. et al. Measures of experimental precision in common bean and soybean genotype trials.
Pesquisa Agropecuária Brasileira, v.44, n.10, p.1225-1231, 2009. Available from: <http://www.scielo.br/pdf/pab/v44n10/ v44n10a03.pdf>. Accessed: Jun. 24, 2016. doi: 10.1590/S0100-204X2009001000003.
COSTA, J.R. et al. Neighborhood and spatial analysis in plant breeding. Pesquisa Agropecuária Brasileira, v.40, n.11, p.1073-1079, 2005. Available from: <http://www.scielo.br/pdf/pab/ v40n11/a04v4011.pdf>. Accessed: Jun. 24, 2016. doi: 10.1590/ S0100-204X2005001100004.
CRUZ, C.D. GENES - a software package for analysis in experimental statistics and quantitative genetics. Acta Scientiarum – Agronomy, v.35, n.3, p.271-276, 2013. Available from: <http://periodicos.uem.br/ojs/index.php/ActaSciAgron/ article/view/21251/pdf>. Accessed: Jun. 24, 2016. doi: 10.4025/ actasciagron.v35i3.21251.
DUARTE, J.B.; VENCOVSKY, R. Spatial statistical analysis and selection of genotypes in plant breeding. Pesquisa Agropecuária Brasileira, v.40, n.2, p.107-114, 2005. Available from: <http:// www.scielo.br/pdf/pab/v40n2/23816.pdf>. Accessed: Jun. 24, 2016. doi: 10.1590/S0100-204X2005000200002.
R DEVELOPMENT CORE TEAM. R: a language and environment for statistical computing. Vienna: R Foundation for Statistical Computing, 2015. Available from: <http://www.R-project.org/>. Accessed: Feb. 26, 2016.
RAMALHO, M.A.P. et al. Experimentation in genetics and plant breeding. Lavras: UFLA, 2000. 326p.
RESENDE, M.D.V.; DUARTE, J.B. Precision and quality control in variety trials. Pesquisa Agropecuária Tropical, v.37, n.3, p.182-194, 2007. Available from: <https://revistas.ufg.br/pat/ article/viewFile/1867/1773>. Accessed: Jun. 24, 2016.
Ciência Rural, v.47, n.4, 2017.
STEEL, R.G.D. et al. Principles and procedures of statistics: a biometrical approach. New York: McGraw Hill Book, 1997. 672p. STORCK, L. et al. The Papadakis method and the replications number in soybean experiments. Ciência Rural, v.39, n.4, p.977-982, 2009. Available from: <http://www.scielo.br/pdf/cr/v39n4/a133cr557.pdf>. Accessed: Jun. 24, 2016. doi: 10.1590/S0103-84782009005000027. STORCK, L. et al. DelPapa – Software tools for analyzing data for experiments in randomized block design using the Papadakis method. Ciência Rural, v.45, n.5, p.774-781, 2015. Available from: <http://www.scielo.br/pdf/cr/v45n5/0103-8478-cr-45-05-00774. pdf>. Accessed: Jun. 24, 2016. doi: 10.1590/0103-8478cr20131470. STORCK, L.; SILVA, M.S. Experimental precision in wheat cultivars trials using the Papadakis method. Ciência Rural, v.44,
n.3, p.407-413, 2014. Available from: <http://www.scielo.br/pdf/ cr/v44n3/a6314cr2012-1127.pdf>. Accessed: Jun. 24, 2016. doi: 10.1590/S0103-84782014000300004.
STORCK, L. et al. Use of the Papadakis method to improve soybean trial quality. Pesquisa Agropecuária Brasileira, v.43, n.5, p.581-587, 2008. Available from: <http://www.scielo.br/pdf/ pab/v43n5/a05v43n5.pdf>. Accessed: Jun. 24, 2016. doi: 10.1590/ S0100-204X2008000500005.
VOLLMANN, J. et al. Spatial field variations in soybean (Glycine