SIMULTANEOUS DETECTION AND TRACKING OF PEDESTRIAN FROM
PANORAMIC LASER SCANNING DATA
Wen Xiaoa,∗, Bruno Valletb, Konrad Schindlerc, Nicolas Paparoditisb
aSchool of Civil Engineering and Geosciences, Newcastle University, UK - wen.xiao@newcastle.ac.uk bUniversité Paris-Est, IGN, Lab MATIS, France - (bruno.vallet, nicolas.paparoditis)@ign.fr cPhotogrammetry and Remote Sensing, ETH Zürich, Switzerland - konrad.schindler@geod.baug.ethz.ch
Commission III, WG III/3
KEY WORDS:Moving object detection, object tracking, pedestrian flow estimation, Lidar
ABSTRACT:
Pedestrian traffic flow estimation is essential for public place design and construction planning. Traditional data collection by human investigation is tedious, inefficient and expensive. Panoramic laser scanners, e.g. Velodyne HDL-64E, which scan surroundings repetitively at a high frequency, have been increasingly used for 3D object tracking. In this paper, a simultaneous detection and tracking (SDAT) method is proposed for precise and automatic pedestrian trajectory recovery. First, the dynamic environment is detected using two different methods,Nearest-point andMax-distance. Then, all the points on moving objects are transferred into a space-time(x, y, t)coordinate system. The pedestrian detection and tracking amounts to assign the points belonging to pedestrians into continuous trajectories in space-time. We formulate the point assignment task as an energy function which incorporates the point evidence, trajectory number, pedestrian shape and motion. A low energy trajectory will well explain the point observations, and have plausible trajectory trend and length. The method inherently filters out points from other moving objects and false detections. The energy function is solved by a two-step optimization process: tracklet detection in a short temporal window; and global tracklet association through the whole time span. Results demonstrate that the proposed method can automatically recover the pedestrians trajectories with accurate positions and low false detections and mismatches.
1 INTRODUCTION
It is common that public places, e.g. squares and concourses, need to be renovated, expanded or redesigned. One of the main factors to be considered is the pedestrian traffic flow. Usually, field data for the flow estimation are collected by human visual counting. The process is expensive and inefficient. In this paper, we investigate the potential of using laser scanning techniques for automatic pedestrian trajectory estimation. The objective is to detect the moving pedestrians and recover their trajectories. Pedestrian, or in general, moving object detection and tracking has been studied in both computer vision and robotics for various applications, e.g. surveillance, autonomous driving. Here, we aim for large scale long term monitoring in order to study the general moving patterns. Accurate geo-located moving patterns can be incorporated into GIS platforms for precise agent-based modelling.
Moving object detection and tracking (MODAT) have been tra-ditionally studied using image sequences and video. Objects are detected in the camera reference frame or 2D world coordinate system (Milan et al., 2014). Stereo matching enables us to detect and reconstruct objects in 3D, then their 3D trajectories can be reconstructed (Schindler et al., 2010). Whereas the field of view (FOV) is still limited by the stereo cameras. Panoramic image stereo-based tracking is still not largely investigated (Koyasu et al., 2001). With the development of laser scanning technology, especially panoramic laser scanners (360◦horizontal FOV, e.g. Velodyne HDL-64E), 3D moving object detection and tracking using laser range data has become increasingly popular (Shack-leton et al., 2010, Kaestner et al., 2012, Moosmann and Stiller, 2013).
A panoramic laser scanner is usually composed of a number of ∗Corresponding author.
vertically configured laser sensors covering a wide enough verti-cal FOV (depending on the number of sensors). It rotates around the vertical axis such that it generates a panoramic view of the surroundings. The rotation frequency ranges from 6 to 15 Hz. Same as other types of laser scanners, the Velodyne range data are directly recorded in 3D in the form of 3D point clouds. The measurement distance ranges from 2 m to 100 m, and the range accuracy is about 2 cm. The Velodyne scanner constantly scans the full surroundings hence it is an ideal technique for MODAT, especially when the area of interest is located around the sensor (Moosmann and Stiller, 2013). It can be mounted on a mobile mapping system (MMS), together with optical cameras, for the purposes of environment perception, and simultaneous localiza-tion and mapping (SLAM) (Moosmann and Stiller, 2011).
A popular MODAT method is tracking-by-detection, where the moving objects are detected first in each frame, then the trajec-tories are reconstructed by associating plausible candidates (An-driluka et al., 2008, Wu and Nevatia, 2007). Objects are typically detected by extracting discriminative features from pixels or seg-ments generated from segmentation methods, then they are classi-fied into objects of interest. However, the detection results can be affected by many factors, such as occlusion, miss-classification. To avoid miss detections using classification, some try to track generic objects without knowing the specific classes, which, how-ever, can have limited applications (Kaestner et al., 2012). In both cases, the detection accuracy will limit the overall tracking per-formance.
and limited FOV, should be retained for better trajectory recov-ery. Instead of detecting the individual object, we detect its tra-jectory directly by assigning the point data to a tratra-jectory hypoth-esis. The data assignment is formalized as an energy function which incorporates the point evidence, trajectory number, pedes-trian shape and motion. First, points belonging to moving ob-jects are separated from the static environment/background (Sec-tion 3.1). Then pedestrians and their trajectories are detected si-multaneously from the moving points which include false alarms and points on other moving objects, e.g. cars (Section 3.2). Ex-periments are carried out on two datasets, one of which is publicly available. Both qualitative and quantitative results are illustrated (Section 4). Discussions (Section 5) are followed by the conclu-sion (Section 6) in the end.
2 RELATED WORK
MODAT is a classical topic in various research domains. Imagery is still the primary data source for object tracking in computer vi-sion, whereas laser scanning technology is, in general, getting more and more popular in robotics. Thus pedestrian tracking us-ing images in computer vision and usus-ing laser scannus-ing data are reviewed respectively.
2.1 Pedestrian tracking in computer vision
Object tracking using optical cameras has been studied in both camera reference frame (2D) and world coordinate system (2D and 3D), and it is applied to many applications, e.g. surveillance, collision prevention, driving assistance. The general pipeline is first to detect the moving object in each frame, then their fu-ture positions are predicted and updated for online tracking, or their complete trajectories are recovered by data fitting for offline tracking.
Tracking-by-detection is a popular strategy for multi-target track-ing. 3D tracking has been investigated by Schindler et al. (2010) who detect and track pedestrians from a moving stereo rig. First, pedestrians are detected from each stereo pair in 3D. Then trajec-tory candidates are generated by an Extended Kalman Filter tak-ing into account the object motion and appearance. An optimal subset of the trajectories are selected by maximizing a quadratic binary expression using multi-branch optimization (Schindler et al., 2006). Milan et al. (2014) track multi-targets by continuous energy minimization. The energy function linearly combines six terms: data association, appearance, motion, exclusivity, track persistence and regularization term. Six types of jump moves, namely grow, shrink, merge, split, add and remove, are used to minimize the energy function.
Tracking can be improved by preserving weak detections. Mi-lan et al. (2015) enhance the tracking-by-detection method by investigating low-level information from the video. They argue that important information have been ignored during the detec-tion process. Thus they propose to retain the ID informadetec-tion of each super-pixel in the entire sequence which help to bridge the trajectory gap caused by absence of detections and occlusions. A similar investigation of pixel-level segmentation has also been proven beneficial for pedestrian tracking by Aeschliman et al. (2010). They propose to use an implicit fine level segmenta-tion instead of a simple mask such as a rectangle or an ellipse. The segmentation and tracking are jointly solved in a probabilis-tic framework.
One major component of tracking is connecting objects’ pres-ences over time to reconstruct their trajectories, which is nor-mally referred to as data association. Instead of bipartite match-ing, Zamir et al. (2012) propose a tracker that associates object
detections globally taking into account both motion and appear-ance using clique graphs. Plausible association are taken as nodes for a global graph. Each node is weighted by the association cost, e.g. motion continuity, appearance consistency. Then the best trajectories are composed by the subgraph whose nodes have the minimal cost. The tracker has been improved by Dehghan et al. (2015).
In the same spirit as Milan et al. (2015) and Aeschliman et al. (2010), we preserve all the original acquired information with-out explicit object detection to prevent information loss. Graph clique is also chosen, in our case, for tracklet association because it guarantees one-to-one node connection. The optimal clique is governed by data explanation.
2.2 Pedestrian tracking using laser scanning data
MMSs are mostly using both cameras and laser scanners. Cam-eras provide richer information besides the 3D locations gener-ated from stereo matching. They are much cheaper than laser scanners, which, however, deliver more accurate 3D geometry. They are both used for SLAM and autonomous driving. Here we focus on object tracking using laser range data.
Moving object detection and tracking using a mobile laser scan-ner has been studied earlier on by Lindström and Eklundh (2001). A laser scanner is mounted on a moving robot. Points on the sin-gle moving object is detected by checking the violation of the static environment. Then points from each scan is tracked by matching with the nearest neighbour. Other approaches can also be found using 2D laser scanning data for pedestrian tracking (Schulz et al., 2003, Arras et al., 2008).
Indoor moving people tracking has been studied by shackleton et al. (2010) using a Velodyne laser scanner. A Classical tracking pipeline has been used. Points from each frame are segmented first, and then the segmented object hypotheses are classified so that moving people are identified. At last, the trajectories are esti-mated and verified by an extended Kalman filter. Reported results are promising, whereas the tested scene is rather simple. Clearly, the object detection step can be enhanced. Spinello et al. (2011) detect people in 3D using a bottom-up top-down approach. The results of a conventional classification method, i.e. voting based classification after segmentation (bottom-up), are improved by a predefined volume which represents the 3D features of people (top-down). The detection is compared with spin images and template-based method, and is reported to outperform them. The detected objects are then applied to a standard multi-hypothesis tracking (MHT) procedure (Reid, 1979). Detected tracks can also facilitate object recognition by track classification (Teichman et al., 2011, Himmelsbach and Wuensche, 2012).
Since we only need trajectories from pedestrians, the points on pedestrians have to be distinguished from those on static and other moving objects. One drawback using laser scanning points other than images is the lack of color information, i.e. appear-ance, which is important evidence for object discrimination. The point’s intensity attribute is, however, affected by various factors, e.g. object material, incidence angle, hence it is not consistent across time. Hosseiny-Alamdary and Yilmaz (2014) color the points by projecting them on to corresponding images. Whereas since the camera FOV is limited, only a part of points are used for tracking.
3 METHODOLOGY
Since only moving objects are of interest in our case, we first dis-tinguish them from the static background. First, the moving ob-jects are detected at point-level. Next, all the moving points are transferred into a space-time(x, y, t)coordinate system. Object tracking amounts to cluster all the points belong to the same ob-ject in such space time cube. Points belonging to the same trian are clustered regarding the shape and structure of a pedes-trian in(x, y, t)in a short temporal window. Since the pedestrian points are clustered over time, pedestrians are simultaneously de-tected and tracked from all the moving points. We formalize the simultaneous detection and tracking (SDAT) of pedestrian as an energy minimization problem, which is solved by a two-step op-timization process (Section 3.2).
3.1 Moving object detection
Two methods are proposed to detect points on moving objects. One straightforward method is to evaluate the number of nearest points. The laser scanner constantly scans the same locations, hence points will be accumulated on static objects over a period of time. However points on moving objects will locate along the moving trajectories. Note that these object instances are normally overlapped because of the high scanning frequency. So the num-ber of nearest point is assessed within a certain temporal window (Equation 1) during which the moving object should have moved out of its original occupied volume, meaning no overlapped in-stances are taken. Moreover, the same volume will most proba-bly be occupied again by other objects, so the target frame should be compared within a short temporal window from the time that a typical pedestrian has moved out of its original volume until a cer-tain time that the space is still assumed to be empty. The average speedspand sizesz(planimetric 2D diameter) of a pedestrian are assumed to be 1.5 m/s, 0.5 m respectively. Given the timet of current frame, the temporal windowT is as follows:
sz
sp <|T−t|< sz
sp+ ∆t (1)
in which∆tis the minimal time gap between two objects occu-pying the same space, e.g. 0.5 s. This method is referred to as Nearest-point.
Another method is based on the laser range distance. The laser beam is not supposed to pass through the static environment scene. Thus the furthest points of each of theilaser sensors over a cer-tain period are taken as the static environment. There will bei scanning circles and each circle is partitioned intojparts depend-ing on the proper angular resolution. Then the static environment is represented by a distance mapDmax∈Ri×j. Points between the laser center and the furthest reachable locations (Di×j <
Di×j
max) are on moving objects. This method is referred to as Max-Distance.
Now the movement of individual point is detected, meaning mov-ing objects are detected at point level. Next sections will discuss the clustering of individual points and the estimation of trajecto-ries for pedestrian tracking. It is worth mentioning that at this stage, points are labelled as moving or static, the object moving patterns can be visually interpreted from the moving points. A 2D density map/image can be generated by accumulating the moving points on to a horizontal 2D plane.
3.2 Simultaneous detection and tracking of pedestrian
The state-of-the-art tracking method, i.e. tracking by detection, has to detect the targets in each frame in the first place. Then the targets are associated across the time so that the full trajectory is recovered. In our case, moving objects’ points are detected, but are not yet clustered into structured objects. These points come from all types of moving objects. We aim to simultaneously de-tect the moving pedestrians and recover their moving trajectories. The moving points are translated into space-time(x, y, t) coordi-nate system. Then the detection and tracking are solved together as an energy minimization problem.
Notations To ease reading, the notations are introduced first for the problem formulation.
• X = {xi = (x, y, t)i},xi ∈ R3,i ∈ {1, ..., n}: then
points of detected moving objects.
• P(X)the set of partitions ofX, including points belonging to the same object:
P(X) ={{S1, ..., Sm}|Si6=∅and
[
Sj=X }
• tmin = miniti, tmax = maxitithe start and end times of
the acquisition.
• P : [tmin, tmax]→R3|S|a trajectory as a function of time computed from eachP(X).
• In this paper, we will work with trajectories interpolated piecewise through a set of control timest0=tmin< t1 < ... < tNc−1 < tNc =tmax. For practical reasons, we can
choose the control times as:
tc=tmin+Nc∆t ∆t=
tmax−tmin Nc
• A trajectoryP will thus be defined by a start and end time tminandtmaxand a set of control points{Pc}c=0...Nc:
P(t) = (tc+1−t)Pc+ (t−tc)Pc+1 ∆t
(2)
• A simple 2D pedestrian model will be given by a disk of ra-diusrcentred at the trajectory point. Based on this model, we define the (adimensional) distance from a point to a pedes-trian trajectory as:
D(xi, P) = max
dist((xi, yi), P(ti))
r −1,0
(3)
• Given a set{Pj}of trajectories, we callj= minD(
xi, Pj)
O Em
d din dout
E
Figure 1: Data attachment energy regarding the 2D point to tra-jectory distanced.
Global formalization We formalize the simultaneous detection and tracking problem as finding an unknown numberNtraj of
trajectoriesPjand an association of the points
xto these trajec-tories defined by a trajectory indexjifor each pointsi, with the
conventionj = 0for points not associated to a trajectory (out-liers). These unknowns will be determined by minimizing the following energy:
E(Pj, ji) =
X
i|ji>0
λoutD(xi, Pji) +λtrack
X
j
tmax−tmin
+λtrajNtraj+λrigid
X
j
X
c=1...Nc
||−−−−→Pc−1Pc−−−−−→PcPc+1||
(4)
This energy has following terms sequentially:
1. Adimensional data attachment term. r controls the radius size of pedestrian and the number of inlier points, andλout
(adimensional) penalizes outliers (points not associated with a trajectory).
2. Density term. λtrack(ins−1) gives the minimum rate of
inliers per second required to track an object. It defines the sensitivity of the detector, i.e. a higher value will favour clusters with high point densities, and a low value will allow to detect more clusters, especially those that are far from the laser center.
3. Model selection term. The data are to be explained by a minimum number of trajectories to penalize over complex-ity. A highλtraj will favour the connection of trajectory
pieces and discard trajectories associated with few points.
4. Smoothness term. It minimizes pedestrian acceleration. A highλrigidwill smooth the trajectories whereas a low one
will overfit them to the data.
Now the outliers can have extremely large energy if the 2D dis-tance to the trajectoryd=dist((xi, yi), P(ti))is large. So the
distance is truncated to be more robust. We define a maximum energyEmthat a point can have, an outer radiusroutbigger than
which the point is surely an outlier, and an inter radiusrinsmaller
than which the point is an inlier. The energy of a pointExiis
il-lustrated as in Figure 1.
E(xi) =
0 ifd≤rin,
Em(routd−r−inrin)2 else ifrin< d≤rout,
Em else.
(5)
The energy can be reformed as:
E(Pj) =X
i
(Exi−Em) +λtrack
X
j
tmax−tmin
+λtrajNtraj+λrigid
X
j
X
c=1...Nc
||−−−−→Pc−1Pc−
−−−−→ PcPc+1||
(6)
This gives a simple interpretation toλout in terms of maximum
distance of a point on a pedestrian to the pedestrian center.
3.3 Optimization
The problem is solved in two steps: (i) detect pedestrian track-lets by RANSAC (RANdom SAmple Consensus (Fischler and Bolles, 1981)) in each[tc, tc+1]time window; (ii) connect
de-tected tracklets by a clique graph.
3.3.1 RANSAC tracklet detection The first step is to extract trajectory segments, i.e. tracklets, of length∆t, corresponding to
the detection of all the points belonging to a pedestrian through-out this time window. For such a short time interval, e.g. 0.5 s, the trajectory can be approximated by a line segment follow-ing the interpolation of Equation 2. Notfollow-ingδtthe time for the
laser scanner to acquire the360◦frame, RANSAC is used to find tracklets with starting time in [tc, tc+δt] and ending time in
[tc+1, tc+1+δt]. Two pointsxaandxbare randomly selected as
seed points of the segment in each of these intervals, then the im-pact∆Eon the energy of adding this segmentPabis computed
as follows:
∆E(Pab) =X
i
(Exi−Em) +λtrack∆t (7)
neglecting the last two terms that determine the tracklect associ-ation in next step. Two endpoints of the tracklet are extrapolated by the segment seed points at the starting and ending time of the interval. The tracklet with lowest∆Eis added to the solution set, and the corresponding inliers are removed from the point cloud. This process is iterated until the lowest∆Egets positive, mean-ing addmean-ing the best tracklet does not reduce the energy any more.
3.3.2 Clique graph tracklet association Let us callPab c ,Pckl+1 the tracklets extracted within temporal windows∆tcand∆tc+1.
We will now connectPab
c tracklet withPckl+1. Because endpoints do not coincide exactly, they are connected by merging the end-pointsxb and xk of the two tracklets at their middle position
xbk= (xb+xk)/2. The corresponding energy variation is
com-puted from Equation 6 for each possible connection.
Each one of themtracklets fromPab
c is possibly connected with
all thentracklets fromPkl
c+1. And each connection will have its energy change∆E. Only the connections with∆E <0are
Table 1: Accuracy assessment of moving object detection at point level using different methods. Better values are in bold.
Method R% P% F1%
Max-Distance 96.2 20.9 34.3 Nearest-point 60.1 70.1 64.7
Now, the tracklets are connected successively. After a few con-nections, a semi-global optimization can be implemented to po-tentially connect tracklets that are not closely adjacent due to oc-clusions or under detections. Here, the connection candidates can be of a larger distance. Since in the first step the data are par-titioned into parts by a small temporal interval, the algorithm is inherent scalable. A long time-span dataset can be processed sep-arately in multi-thread and on many machines. The first step will extract the tracklets from each subset. Since a tracklet is only composed of two points (start and end) in space-time cube, com-plete trajectories can be recovered for a long time-span dataset even if itself does not fit in RAM.
4 EXPERIMENTS AND RESULTS
4.1 Moving object detection
The experimental data are acquired in Paris by a MMS called
Stereopolis(Paparoditis et al., 2012) using a HDL-64E Velodyne laser scanner, which is composed of 64 vertically distributed sen-sors. The scanner rotates around the vertical axis with a fre-quency around 10Hz. The vertical angular resolution is about 0.86◦, and the horizontal one, in our case, is 0.23◦.
To constantly monitor the place of interest, the MMS can be sta-tioned at certain observation points to scan the surroundings. Fig-ure 2 shows the static acquisition, in which points on moving pedestrians (red) are successfully detected using different meth-ods. The detection results are statistically evaluated against man-ually labelled ground truth (Table 1). Since the method detects points on moving objects, the results are evaluated at point level. The recall (R), precision (P) andF1score(2R×P/(R+P)) are assessed.
TheMax-distancemethod is simple and fast. However, false de-tections can be observed on penetrable objects, e.g. fences, trees, because these objects have points behind them along the rays. These falsely detected points can be considered as noise in the following process, and can be filtered out as they do not move over time.
According to the results in Table 1, theMax-Distance method is able to detected almost all the moving points, whereas it has very low precision. Because it is very sensitive to penetrable ob-jects, which are largely presented in the data. TheNearest-point method does not require the scanning geometry, i.e. the laser center locations. This means that the data acquisition can be ar-tificially limited to a reasonable range where the point density is high enough. Another advantage is that it is robust to pene-trable objects given a proper distance threshold. Nevertheless, false detections and under detections are inevitable, so the track-ing method should be robust to noise and a certain degree of data incompleteness.
These points on moving objects can be accumulated on an image which will illustrate the moving pattern and density of objects. It can be used for visual interpretation of the moving object traffic flow (Figure 3). The next step is to recover the individual trajec-tory of each pedestrian.
(a)
(b)
(c)
Figure 2: Moving object detection using laser scanning system, (a) original data during about 15 s, (b) Max-Distance, and (c) Nearest-point methods. The former is simple and fast, whereas the later is robust to penetrable objects, as seen in (c) there are much less false alarms (red) on fences and trees.
4.2 Pedestrian tracking
Figure 3: Moving object point accumulation image. Points are projected to an image showing the number of points in each pixel. Coloured from blue to green, to red as the pixel value increases.
end, the tracklets from different temporal windows are connected so that the overall trajectories are recovered (Figure 5(c)).
Figure 4: Detected moving objects shown in space-time coordi-nate system where(x, y, t)are in green, blue, red respectively. Dense point clusters are moving trajectories, and sparse points are false detections on street fences. Points are coloured from blue to black over time.
One of the advantages of the SDAT method is that all the points on moving objects are retained, even those that are partially scanned due to occlusion or limited scanning FOV. Figure 6 shows an ex-ample where significant less points are acquired on the moving objects that are close to the laser scanner (highlighted by a black rectangle). The trajectories are still recovered because these small amount of points convey enough evidence for the tracklet search-ing. However, as for tracking-by-detection method, these points will hardly be detected as pedestrians because they are only of a small portion of a whole people.
Figure 7 illustrates the pedestrian flow of the public place during 3 minutes. General trajectory patterns can be easily observed. Detailed and accurate information, e.g. pedestrian location, mov-ing direction, can be extracted from the results and used as input for accurate pedestrian flow simulations.
To evaluate our SDAT method, a benchmark ETH Zurich Poly-terrassedataset used by Spinello et al. (2011) and Kaestner et al. (2012) is adopted. Both work follow the detection-and-then-tracking convention. The difference is that the former specifi-cally detects pedestrian using a bottom-up top-down (BUTD) de-tector, whereas the latter detects all types of moving objects in general. The tracking results are quantitatively evaluated using the CLEAR MOT metrics (Bernardin and Stiefelhagen, 2008).
(a)
(b)
(c)
Figure 5: Moving object tracking. (a) original detected mov-ing points; (b) detected tracklets in partitioned temporal windows (tracklets are in dark blue, points in different temporal windows are coloured randomly); (c) connected final trajectories.
Figure 6: Example of trajectory recovery by points that are par-tially scanned on objects (highlighted in the black rectangle).
Three basic types of errors/values are determined for the esti-mated tracks against the ground truth:
•FN: The false negative ratio, i.e. the percentage of missing tracks that are supposed to exist regarding the ground truth.
•FP: The false positive ratio, i.e. the percentage of false alarms w.r.t the ground truth.
• MM: The number of mismatches in terms of track identity switches.
Two more indicators are also derived:
•MOTP: Multiple object tracking precision, i.e. the average Eu-clidean distance between the estimated track instances and the ground truth.
•MOTA: Multiple object tracking accuracy, i.e. the percentage of the number of correct track instances w.r.t the ground truth.
The MOTA can be computed by the three basic values:
M OT A= 1−PF N+F P+M M trackgroundtruth
Figure 7: Pedestrian flow in a public place. Pedestrian trajectories are in random colors, and the background is in black.
Table 2: Tracking methods comparison using the CLEAR MOT metrics. MOTA, FN, FP are in %. The best value of each indi-cator is in bold. BU and BUTD results are from Spinello et al. (2011), Genera result is from Kaestner et al. (2012).
Detector MOTP MOTA FN FP MM
BU <0.16m 23.1 18.7 57.1 11 BUTD <0.16m 89.1 2.6 7.6 20 General <0.14m 77.7 8.5 10.1 n/a SDAT <0.12m 88.4 5.3 5.8 5
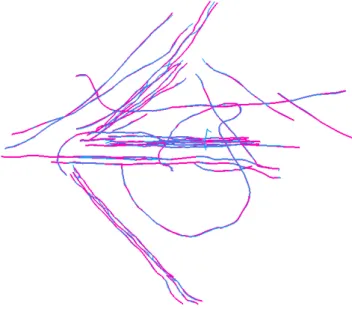
The evaluation results are listed in Table 2, together with other re-sults from comparative methods. Note that the data are truncated by a limited distance, meaning points that are far away are not recorded. Thus the max-distance static environment map is in-complete. Only the Nearest-point method is used in the first step to extract moving points. Figure 8 illustrates the detected tracks (cyan) and the ground truth (magenta). The comparison reveals that the SDAT method has the most accurate track positions and least mismatches. The FN ratio is slightly higher than the result of BUTD but is still acceptable. It is mainly caused by severe oc-clusion, e.g. target occluded longer than multiple temporal win-dows. The FP ratio is the lowest compared to others. We do not detect a single object but a group of presences of the object, so that single object false detections are avoided. Still a duplicated track is sometimes observed if the object is taking/carrying large accessories, e.g. a stroller, meaning a non-pedestrian object con-stantly showing a similar pattern to a pedestrian can be falsely detected.
5 DISCUSSIONS
Points on moving objects are detected firstly using two meth-ods. The maximum-distance moving object detection method is simple and fast. But it is specific to the static data acquisition mode and is more sensitive to penetrable objects. Most criti-cally, it requires the point recording behind moving objects. If there is no light/pulse backscattered to the sensor, the scanning
Figure 8: Comparison between the detected tracks (cyan) and the ground truth (magenta).
range from the sensor center to the furthest reachable location can no be determined. Then points on moving objects in mid-dle of the scanning range will be treated as the furthest reach-able points and therefore the static background. The nearest-point method, however, only takes point locations into account hence does not required further information, e.g. scanning geometry, furthest range. Points far from the laser scanner are normally very sparse and no reasonable features can be extracted, so they can be discarded to reduce the data size if necessary. The static environment is automatically extracted at this stage. Even though there still might be mobile objects, the sub-cleaned data can be used as basis for other purposes, e.g. database updating, road mapping, surface reconstruction, etc. Thus the moving object de-tection algorithm can serve as the pre-processing step for such applications.
Our SDAT algorithm takes all the detected moving points as in-put regardless false detections. The strengths are: (i) no need of segmentation for the detected moving points; (ii) no need of moving point detection refinement or pre-classification (pedes-trian or not); (iii) partially scanned objects are also retained, to be robust to moderate occlusions and under detections. However, the downside is that false alarms can be raised if a non-pedestrian object’s spatial distribution is constantly similar to a pedestrian’s. The only constraint is the number of points which lie inside of a pedestrian-sized 2D circle. Apparently, more comprehensive and discriminative features should be incorporated into the SDAT al-gorithm to cope with data with many other types of objects, e.g. cars, buses, so that the method can be used for more complex en-vironments. The Tannenstrasse data from Spinello et at. (2011) will be investigated in the future. One drawback of the method is it is time inefficient since the RANSAC step can take more than 10 minutes for a 2 seconds time interval. So it is not suitable for online tracking even the tracklets are associated progressively in an online fashion.
6 CONCLUSION
A pedestrian-oriented simultaneous detection and tracking (SDAT) algorithm is proposed and is successfully implemented using laser scanning data. Moving object points are extracted firstly using two different methods, Max-distance and Nearest-point. The ac-cumulated point density image/map can be used for qualitative vi-sual interpretation of the pedestrian flow. Quantitative estimation is achieved by reconstructing the 3D trajectories of pedestrians. The SDAT method takes all the moving points and estimates the trajectories that best explain the points. The tracking, segmen-tation and classification are solved simultaneously. The method inherently handles occlusions and under detections to certain de-grees. Results suggest that panoramic laser scanning data can be used for efficient and accurate pedestrian flow estimation.
Future work will focus on incorporating more discriminative fea-tures to further eliminate other objects, or introducing other shape models to track other types of objects.
REFERENCES
Aeschliman, C., Park, J. and Kak, A. C., 2010. A probabilistic framework for joint segmentation and tracking. In: IEEE Con-ference on Computer Vision and Pattern Recognition (CVPR), pp. 1371–1378.
Andriluka, M., Roth, S. and Schiele, B., 2008. People-tracking-by-detection and people-detection-by-tracking. In: IEEE Confer-ence on Computer Vision and Pattern Recognition, pp. 1–8.
Arras, K. O., Grzonka, S., Luber, M. and Burgard, W., 2008. Effi-cient people tracking in laser range data using a multi-hypothesis leg-tracker with adaptive occlusion probabilities. In: IEEE In-ternational Conference on Robotics and Automation, pp. 1710– 1715.
Bernardin, K. and Stiefelhagen, R., 2008. Evaluating multiple object tracking performance: the clear mot metrics. Journal on Image and Video Processing 2008, pp. 1–10.
Dehghan, A., Assari, S. M. and Shah, M., 2015. Gmmcp tracker: Globally optimal generalized maximum multi clique problem for multiple object tracking. In: IEEE Conference on Computer Vi-sion and Pattern Recognition (CVPR), Vol. 1, p. 2.
Fischler, M. A. and Bolles, R. C., 1981. Random sample consen-sus: a paradigm for model fitting with applications to image anal-ysis and automated cartography. Communications of the ACM 24(6), pp. 381–395.
Himmelsbach, M. and Wuensche, H.-J., 2012. Tracking and clas-sification of arbitrary objects with bottom-up/top-down detection. In: IEEE Intelligent Vehicles Symposium (IV), pp. 577–582.
HosseinyAlamdary, S. and Yilmaz, A., 2014. Merging trajectory and point clouds for 3d object tracking. In: Photogrammetric Computer Vision Symposium Tracking Challenge.
Kaestner, R., Maye, J., Pilat, Y. and Siegwart, R., 2012. Gen-erative object detection and tracking in 3d range data. In: IEEE International Conference on Robotics and Automation, pp. 3075– 3081.
Koyasu, H., Miura, J. and Shirai, Y., 2001. Real-time omnidirec-tional stereo for obstacle detection and tracking in dynamic envi-ronments. In: IEEE/RSJ International Conference on Intelligent Robots and Systems, Vol. 1, pp. 31–36.
Lindström, M. and Eklundh, J.-O., 2001. Detecting and tracking moving objects from a mobile platform using a laser range scan-ner. In: IEEE/RSJ International Conference on Intelligent Robots and Systems, Vol. 3, pp. 1364–1369.
Milan, A., Leal-Taixé, L., Schindler, K. and Reid, I., 2015. Joint tracking and segmentation of multiple targets. In: IEEE Con-ference on Computer Vision and Pattern Recognition, pp. 5397– 5406.
Milan, A., Roth, S. and Schindler, K., 2014. Continuous energy minimization for multitarget tracking. IEEE Transactions on Pat-tern Analysis and Machine Intelligence 36(1), pp. 58–72.
Moosmann, F. and Stiller, C., 2011. Velodyne slam. In: IEEE Intelligent Vehicles Symposium, pp. 393–398.
Moosmann, F. and Stiller, C., 2013. Joint self-localization and tracking of generic objects in 3d range data. In: IEEE Interna-tional Conference on Robotics and Automation, pp. 1146–1152.
Niskanen, S. and Östergård, P. R. J., 2003. Cliquer user’s guide, version 1.0. Technical report, Communications Labora-tory, Helsinki University of Technology, Espoo, Finland.
Paparoditis, N., Papelard, J., Cannelle, B., Devaux, A., Soheilian, B., David, N. and Houzay, E., 2012. Stereopolis ii: A multi-purpose and multi-sensor 3d mobile mapping system for street visualisation and 3d metrology. Revue Française de Photogram-métrie et de Télédétection 200, pp. 69–79.
Reid, D. B., 1979. An algorithm for tracking multiple targets. IEEE Transactions on Automatic Control 24(6), pp. 843–854.
Schindler, K., Ess, A., Leibe, B. and Van Gool, L., 2010. Auto-matic detection and tracking of pedestrians from a moving stereo rig. ISPRS Journal of Photogrammetry and Remote Sensing 65(6), pp. 523–537.
Schindler, K., James, U. and Wang, H., 2006. Perspective n-view multibody structure-and-motion through model selection. In: Eu-ropean Conference on Computer Vision (ECCV), pp. 606–619.
Schulz, D., Burgard, W., Fox, D. and Cremers, A. B., 2003. Peo-ple tracking with mobile robots using samPeo-ple-based joint prob-abilistic data association filters. The International Journal of Robotics Research 22(2), pp. 99–116.
Shackleton, J., VanVoorst, B. and Hesch, J., 2010. Tracking peo-ple with a 360-degree lidar. In: IEEE International Conference on Advanced Video and Signal Based Surveillance, pp. 420–426.
Spinello, L., Luber, M. and Arras, K. O., 2011. Tracking peo-ple in 3d using a bottom-up top-down detector. In: IEEE In-ternational Conference on Robotics and Automation (ICRA), pp. 1304–1310.
Teichman, A., Levinson, J. and Thrun, S., 2011. Towards 3d object recognition via classification of arbitrary object tracks. In: IEEE International Conference on Robotics and Automation (ICRA), pp. 4034–4041.
Vallet, B., Soheilian, B. and Brédif, M., 2014. Combinatorial clustering and its application to 3d polygonal traffic sign recon-struction from multiple images. In: ISPRS Annals of Photogram-metry, Remote Sensing and Spatial Information Sciences, Vol. 1, pp. 165–172.
Wu, B. and Nevatia, R., 2007. Detection and tracking of multiple, partially occluded humans by bayesian combination of edgelet based part detectors. International Journal of Computer Vision 75(2), pp. 247–266.