www.atmos-chem-phys.net/15/1795/2015/ doi:10.5194/acp-15-1795-2015
© Author(s) 2015. CC Attribution 3.0 License.
Polycyclic aromatic hydrocarbons, polychlorinated biphenyls, and
chlorinated pesticides in background air in central Europe –
investigating parameters affecting wet scavenging of polycyclic
aromatic hydrocarbons
P. Shahpoury1, G. Lammel1,2, A. Holubová Šmejkalová3,4, J. Klánová2, P. Pˇribylová2, and M. Vá ˇna3,4 1Max Planck Institute for Chemistry, Mainz, Germany
2Research Centre for Toxic Compounds in the Environment, Masaryk University, Brno, Czech Republic 3Czech Hydrometeorological Institute, Košetice, Czech Republic
4Global Change Research Centre, Academy of Sciences of the Czech Republic, Prague, Czech Republic
Correspondence to:G. Lammel ([email protected]) and P. Shahpoury ([email protected])
Received: 13 September 2014 – Published in Atmos. Chem. Phys. Discuss.: 28 October 2014 Revised: 25 December 2014 – Accepted: 6 January 2015 – Published: 19 February 2015
Abstract. Concentrations of polycyclic aromatic hydrocar-bons (PAHs), polychlorinated biphenyls (PCBs), and chlo-rinated pesticides (CPs) were measured in air and precip-itation at a background site in central Europe. PPAH concentrations in air and rainwater ranged from 0.7 to 327.9 ng m−3and below limit of quantification (< LOQ) to
2.1×10³ng L−1. The concentrations of PCBs and CPs in
rainwater were < LOQ.PPCB andPCP concentrations in air ranged from < LOQ to 44.6 and < LOQ to 351.7 pg m−3,
respectively. The potential relationships between PAH wet scavenging and particulate matter and rainwater properties were investigated. The concentrations of ionic species in par-ticulate matter and rainwater were significantly correlated, highlighting the importance of particle scavenging process. Overall, higher scavenging efficiencies were found for rel-atively less volatile PAHs, underlining the effect of analyte gas-particle partitioning on scavenging process. The particu-late matter removal by rain, and consequently PAH wet scav-enging, was more effective when the concentrations of ionic species were high. In addition, the elemental and organic car-bon contents of the particulate matter were found to influence the PAH scavenging.
1 Introduction
Poten-tial variability in scavenging efficiencies has also been sug-gested between rain events originated from warm and cold clouds (Bidleman, 1988). A number of studies observed vari-ations in scavenging efficiencies of SOCs between different precipitation events (Offenberg and Baker, 2002; Agrell et al., 2002; Liu et al., 2013; Kaupp and McLachlan, 2000; McLachlan and Sellström, 2009; Atlas and Giam, 1988). To this date, studies have mainly focused on determining the rel-ative importance of SOC gas and particle scavenging pro-cesses. However, to the best of our knowledge, no compre-hensive study has been conducted to understand the causes behind the variability in scavenging efficiencies. Therefore, in this study we aimed at filling this gap by investigating the relationships between a set of aerosol and rainwater proper-ties and SOC scavenging. The present study was conducted at a background site in central Europe, as a follow up to a pre-viously published research (Škrdlíková et al., 2011) in which PAH scavenging efficiencies were determined at that site. The specific objectives of the present study were to (1) mea-sure the concentrations of PAHs, PCBs, and CPs in air and rainwater samples, (2) estimate wet depositional fluxes of target compounds in the study area, (3) determine wet scav-enging efficiencies and scavenged mass fractions of the ana-lytes, and (4) investigate the potential relationships between analyte scavenging and meteorological parameters as well as aerosol and rain characteristics. PAHs, PCBs, and CPs were selected because they are widespread atmospheric contam-inants and have been found in air at background locations across Europe (Dvorská et al., 2009; Gioia et al., 2007; Roots et al., 2010; Halse et al., 2011). In addition, these chemicals can persist in the environment due to their resistance to pho-tolytic, chemical, and biological degradation (Yolsal et al., 2014).
2 Experimental 2.1 Sampling site
The sampling was conducted at the Košetice observatory lo-cated in an open land about 70 km southeast of Prague in the Czech Republic (Fig. S1 in the Supplement). The observa-tory is classified as a European background site (Dvorská et al., 2008). It is managed by the Czech Hydrometeorologi-cal Institute (CHMI) and is part of the European Monitoring and Evaluation Program. The area is covered with snow 2–3 months per year with the mean annual temperature and pre-cipitation of 7.1◦C and 625 mm. The potential source of
pol-lution in the region is the nearby highway (∼7 km west of
the observatory) connecting Prague to Brno. In addition, due to having dominant westerly winds, atmospherically trans-ported contaminants from the industrial and urban areas of the Czech Republic, notably Prague, may contribute to the pollution in the area.
2.2 Sampling procedure
Rainwater and air samples were collected during the period of December 2011 to January 2014 (Table S1 in the Sup-plement). A total of 231 rain samples were collected using an automatic precipitation sampler (Baghira, Czech Repub-lic) equipped with a 1 m2stainless steel collection funnel, a lid, and a 5 L glass collection bottle. The opening and clos-ing of the lid is triggered by a precipitation sensor mounted on the sampler. During sampling, rain drains from the fun-nel and accumulates in the collection bottle. The collected sample volumes were between 0.5 and 1 L, depending on the amount of rainfall for each event. Larger or smaller volumes were discarded – the latter was not deemed to provide enough analyte mass for trace analysis.
Air samples were collected on quartz fiber filters (QFF) (Grade QM-A, 10.1 cm inner diameter (ID), Whatman, UK) and in polyurethane foam (PUF) plugs (5.5 cm ID, 5 cm height, Organika, Poland) using a Graseby Andersen PS-1 high-volume sampler (GA, USA) with a flow rate of 17 m3h−1. For each sampling period, two consecutive PUF plugs and one filter paper were deployed. A total of 162 gas and particulate phase air samples were collected during the period of study. Nevertheless, only samples from 54 events were considered for determining scavenging parameters be-cause only these were followed by rain events. The collec-tion of these samples started between 6 and 35 h prior to the onset of rain (predicted by CHMI) and stopped when rainfall started (Table S2). This sampling approach was cho-sen in order to sample rainwater from the same air mass as that of PM. In addition, PM has been suggested to be re-moved from a traveling air parcel by up to 8 and 23 % in the first 24 and 72 h after the onset of rain, respectively (Wiman et al., 1990; Škrdlíková et al., 2011). This means that pro-longing the air sampling beyond the onset of rain would po-tentially lead to underestimating contaminant concentrations in air and, therefore, overestimating scavenging efficiencies and washed-out mass fractions. In addition, relative humid-ity substantially increases during rainfall and this would po-tentially affect gas-particle partitioning of SOCs in the air leading to underestimation or overestimation of gaseous and particulate fraction of contaminants.
Field blanks for air samples were prepared at the site fol-lowing the standard protocol for mounting QFF and PUF plugs onto the sampler without turning on the sampler. No field blanks were generated for rain samples.
2.3 Meteorological and other supporting data
SO2−
4 , NO−3, and NH+4), elemental carbon (EC), and or-ganic carbon (OC) contents – were obtained from CHMI (Table S3). Aerosol number size distribution data, used for calculating the aerosol surface concentrations, was obtained from the Academy of Sciences of the Czech Republic. An-alyte physico-chemical properties were obtained from Esti-mation Programs Interface Suite 4.11 (USEPA, 2012). The weather charts used to determine the occurrence of frontal passage over the study site were obtained from Berliner Wet-terkarte (BWK, 2013).
2.4 Chemical analysis and quality control
QFF and PUF samples were extracted with dichloromethane using an automatic extraction system (Büchi B-811, Switzer-land). PUF plugs (n=2) related to each sampling period
were extracted together. Field blanks were extracted along with each set of 10 samples. The extracts were concen-trated under a gentle stream of nitrogen in ambient temper-ature and fractionated using a silica column for PAHs and a sulfuric acid modified silica column for PCBs and CPs. The method performance was tested prior to sample analy-sis and no degradation of target analytes due to acid treat-ment was detected. Analytes in rainwater were extracted us-ing solid-phase extraction (C18 Speedisks, Bakerbond, the Netherlands). The analytes were later eluted using 40 mL of (1:1) dichloromethane:n-hexane, concentrated under a gen-tle stream of nitrogen, and passed through a glass column packed with anhydrous sodium sulfate (1 cm ID, 3 cm height) to remove residual water. Prior to extraction, all air and rainwater samples and blanks were spiked with a solution containing d8-naphthalene, d10-phenanthrene, d12-perylene, PCB 30, and PCB 185, which were used as recovery stan-dards.
Samples were analyzed for 26 parent PAHs (i.e., naphthalene (NAP), acenaphthylene (ACY), ace-naphthene (ACE), fluorene (FLN), phenanthrene (PHE), anthracene (ANT), fluoranthene (FLT), pyrene (PYR), benzo(a)anthracene (BAA), chrysene (CHR), benzo(b)fluoranthene (BBF), benzo(k)fluoranthene (BKF), benzo(a)pyrene (BAP), indeno(123−cd)pyrene (IPY), dibenz(a, h)anthracene (DHA), benzo(g, h, i)perylene (BPE), benzo(b)fluorene (BFN), benzo(g, h, i)fluoranthene (BGF), cyclopenta(c, d)pyrene (CPP), triphenylene (TPH), benzo(j )fluoranthene (BJF), benzo(e)pyrene (BEP), perylene (PER), dibenz(a, c)anthracene (DCA), an-thanthrene (ATT), coronene (COR)), one heterocyclic PAH (i.e., benzonaphthothiophene (BNT)), and one alkylated PAH (i.e., retene (RET)) using a Hewlett-Packard gas chromatograph (GC 6890) interfaced to a Hewlett-Packard mass selective detector (MS 5973). Seven PCBs (i.e., PCB 28, PCB 52, PCB 101, PCB 118, PCB 138, PCB 153, and PCB 180) and 13 CPs, namely α -hexachlorocyclohexane (HCH), β-HCH, γ-HCH, δ-HCH, ε-HCH, o, p′-dichlorodiphenyldichloroethylene (DDE),
p, p′-DDE, o, p′-dichlorodiphenyldichloroethane (DDD), p, p′-DDD, o, p′-dichlorodiphenyltrichloroethane (DDT), p, p′-DDT, pentachlorobenzene (PeCB), hexachlorobenzene
(HCB), were analyzed using an Agilent GC (7890) coupled with an Agilent Triple Quadrupole MS/MS (7000B). All analytes were separated on a J&W Scientific capillary column (HP-5ms, 0.25 mm ID, 0.25 µm film thickness). d14 -p-Terphenyl and PCB 121 were used as internal standards for PAH and PCB/CP analysis, respectively. The analytical method recoveries for PAHs and PCBs/CPs ranged from 72 to 102 % and 88 to 100 %, respectively. The measured analyte concentrations were not recovery corrected.
Limits of quantification (LOQ) for analytes were calcu-lated based on instrument detection limits, which in turn are determined using 3 times the chromatogram baseline noise level. The median LOQs for individual PAHs and PCBs/CPs in air samples were 0.006 and 0.0005 ng m−3,
re-spectively. The median LOQs in rainwater samples were 0.05 and 0.45 ng L−1, respectively. LOQ values were used in cases where analyte concentrations in field blanks were < LOQ. The mean concentrations of analytes in five field blanks were subtracted from those in the corresponding samples. The concentrations that were lower than the mean+3 standard
deviations of those in field blanks were considered < LOQ and were substituted with LOQ/2 for calculation of averages. Analysis of ionic species in rainwater was done using a Hewlett-Packard capillary electrophoresis system (HP 3D CE). Measurements were performed using an uncoated silica capillary column (75 µm ID, 70 cm length). The applied sep-aration voltage was−10 kV with hydrodynamic injection of
50 mbar, 20 s′. Analytes were detected indirectly at 254 nm
wavelength. The electrolyte was composed of 5 mM sodium chromate and boric acid (pH 8.3) and 0.5 mM cetyltrimethy-lammonium bromide. Quantification was performed using individual calibration curves. Each quantification was per-formed three times and mean values were used.
2.5 Calculations and data analysis
Analyte particulate mass fractions,θ (unitless), were calcu-lated using Eq. (1),
θ=Cip/(Cig+Cip), (1) whereCipis analyte (i)air concentration (ng m−3)in
partic-ulate phase andCigis that in gas phase. Daily wet deposition fluxes,Fwet(ng m−2), were determined using Eq. (2),
Fwet=Cir×P , (2)
whereCiris analyte concentration in rainwater (ng L−1)and P is the rain volume received per collection area (L m−2)in each sampling day. Seasonal fluxes were calculated by sum-ming the daily fluxes in each season. Total scavenging ratios, Wt(unitless), were calculated using Eq. (3),
Wt= Cir×10
3
where multiplication by 103 accounts for conversion from ng L−1to ng m−3. The mass fraction of the total analyte
bur-den in air washed out by below- and in-cloud scavenging,εt (unitless), is calculated according to Škrdlíková et al. (2011) using Eq. (4),
εt= br
ba =
Cir×P
(Cig+Cip)×h, (4) wherebrandba are analyte burdens (ng m−2)in rainwater and air, respectively, and h(m) is the height of the air col-umn subject to precipitation, which corresponds to the cloud height from which precipitation originates.
3 Results and Discussion
3.1 Concentrations and distribution of analytes 3.1.1 Concentrations in air
NAP was targeted for analysis but it did not pass our qual-ity control criteria and, therefore, is not discussed here-after. In addition, only analytes that were detected in > 10 % of the samples are discussed herein (Tables 1, 2). PPAH (i.e., the sum of 27 PAHs) concentrations in gas phase ranged from 0.6 to 138.6 (mean±standard deviation (SD):
11.3±15.7) ng m−3 (Table 1). PAHs with molecular mass
< 228 Da, namely ACY, ACE, FLN, PHE, ANT, FLT, and PYR, were predominant in gas phase and, on average, ac-counted for 93 % of thePPAH concentrations. PHE, FLN, and FLT showed the highest mean contributions accounting for 42, 24, and 12 % of thePPAH gaseous concentrations, respectively. BKF, BAP, IPY, DHA, BPE, BNT, CPP, BJF, BEP, PER, DCA, ATT, and COR were detected in < 10 % of the gaseous samples (n=162) (Table 1). The PPAH
concentrations in the particulate phase ranged from 0.1 to 189.3 (mean±SD: 9.3±21.2) ng m−3 (Table 1). In sum,
PAHs with molecular mass > 228 Da were predominant in particulate phase and, on average, contributed to 67 % of the PPAH particulate concentrations. However, FLT and PYR showed the highest individual contributions and, on average, accounted for 13 and 11 % of the PPAH concentrations, respectively. The sum of the concentrations of gas and par-ticulate phase PAHs ranged from 0.7 to 327.9 ng m−3, with
the mean±SD being 20.6±35.9 ng m−3. The PAH
concen-tration ranges in gas and particulate phase are noticeably higher than those measured by Škrdlíková et al. (2011) (i.e., 0.9–34.6 and 0.1–16.8 ng m−3, respectively) for samples
col-lected from the same site during the 2007–2008 period, but are slightly lower than those reported by Holoubek et al. (2007) for the period between 1996 and 2005 (i.e., 0.4– 208 and 0.1–359 ng m−3, respectively).
Except for p, p′-DDE, the targeted chlorinated com-pounds were mainly detected in gas phase (i.e., < 10 % in par-ticulate phase) (Table 2). The concentrations ofp, p′-DDE
in particulate phase ranged from < LOQ to 6.8 (mean±SD:
0.4±0.7) pg m−3. In gas phase, β-HCH, δ-HCH, ε-HCH, ando, p′-DDD were detected in < 10 % of all samples (n=
162). The concentrations in gas phase ranged from < LOQ to 43.5 (mean±SD: 8.1±7.2) pg m−3 for PPCBs (i.e.,
the sum of the concentrations of PCBs 28, 52, 101, 118, 138, 153, and 180), < LOQ to 73.8 (11.0±11.6) pg m−3for
PHCHs (i.e., the sum of the concentrations of
a- and γ -HCH), < LOQ to 104.3 (23.2±19.8) pg m−3 for PDDTs
(i.e., the sum of the concentrations ofo, p′-DDE,p, p′-DDE, p, p′-DDD,o, p′-DDT, andp, p′-DDT) and < LOQ to 332.3 (96.1±42.0) pg m−3forPCBs (i.e., the sum of the
concen-trations of PeCB and HCB) (Table 2). On average, PCB 28 (40 %),γ-HCH (56 %),p, p′-DDE (83 %), and HCB (90 %) predominated PPCB, PHCH, PDDT, and PCB con-centrations, respectively. The sum of the concentrations of gas and particulate phase PCBs and CPs ranged from < LOQ to 44.6 and < LOQ to 351.7 pg m−3, respectively. The
mea-sured concentrations in the present study are considerably lower than those reported by Holoubek et al. (2007) for the samples collected from the same location between 1996 and 2005 (i.e., from < LOQ to 390 pg m−3 forPPCBs, < LOQ to 771 pg m−3for PHCHs, 1 to 207 pg m−3for PDDTs, and < LOQ to 831 pg m−3for HCB). As production and use of these compounds are banned in Europe, the relatively low concentrations in the present study could indicate emission due to volatilization from contaminated soil around Košetice (Fig. S1). This argument is supported by significant corre-lations found between the ambient temperature at the sam-pling site and the measured concentrations of PCB 28 (r=
0.70, P <0.05, n=162), γ-HCH (r=0.74, P <0.05), and p, p′-DDE (r=0.71, P <0.05). Despite having the
high-est mean concentration among the other chlorinated ana-lytes, relatively small correlation was found between the concentrations of HCB and ambient temperature changes (r=0.25). This could be due to the fact that this compound has different source pathways compared to all other chlori-nated chemicals investigated in this study. Although banned, HCB could potentially be released to the environment as an unintended byproduct of organic solvent and aluminum man-ufacturing and waste burning (EPER, 2014). In addition, this compound is present in some pesticide formulations, such as chlorothalonil, which is currently registered for use in Eu-rope.
3.1.2 Concentrations in rain
PPAH concentrations in rainwater ranged from < LOQ to 2.1×10³(mean±SD: 173.3±256.1) ng L−1(Table 3),
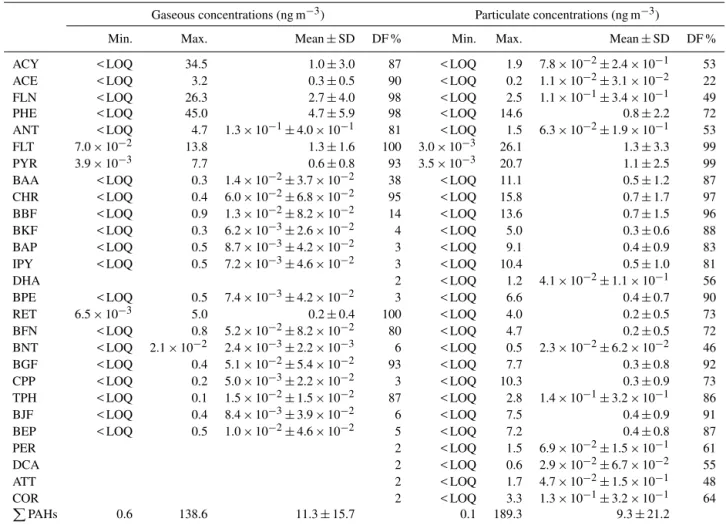
Table 1.PAH concentrations and detection frequencies (DF) in air(n=162).
Gaseous concentrations (ng m−3) Particulate concentrations (ng m−3)
Min. Max. Mean±SD DF % Min. Max. Mean±SD DF %
ACY < LOQ 34.5 1.0±3.0 87 < LOQ 1.9 7.8×10⁻²±2.4×10⁻¹ 53
ACE < LOQ 3.2 0.3±0.5 90 < LOQ 0.2 1.1×10⁻²±3.1×10⁻² 22
FLN < LOQ 26.3 2.7±4.0 98 < LOQ 2.5 1.1×10⁻¹±3.4×10⁻¹ 49
PHE < LOQ 45.0 4.7±5.9 98 < LOQ 14.6 0.8±2.2 72
ANT < LOQ 4.7 1.3×10⁻¹±4.0×10⁻¹ 81 < LOQ 1.5 6.3×10⁻²±1.9×10⁻¹ 53
FLT 7.0×10⁻² 13.8 1.3±1.6 100 3.0×10⁻³ 26.1 1.3±3.3 99
PYR 3.9×10⁻³ 7.7 0.6±0.8 93 3.5×10⁻³ 20.7 1.1±2.5 99
BAA < LOQ 0.3 1.4×10⁻²±3.7×10⁻² 38 < LOQ 11.1 0.5±1.2 87
CHR < LOQ 0.4 6.0×10⁻²±6.8×10⁻² 95 < LOQ 15.8 0.7±1.7 97
BBF < LOQ 0.9 1.3×10⁻²±8.2×10⁻² 14 < LOQ 13.6 0.7±1.5 96
BKF < LOQ 0.3 6.2×10⁻³±2.6×10⁻² 4 < LOQ 5.0 0.3±0.6 88
BAP < LOQ 0.5 8.7×10⁻³±4.2×10⁻² 3 < LOQ 9.1 0.4±0.9 83
IPY < LOQ 0.5 7.2×10⁻³±4.6×10⁻² 3 < LOQ 10.4 0.5±1.0 81
DHA 2 < LOQ 1.2 4.1×10⁻²±1.1×10⁻¹ 56
BPE < LOQ 0.5 7.4×10⁻³±4.2×10⁻² 3 < LOQ 6.6 0.4±0.7 90
RET 6.5×10⁻³ 5.0 0.2±0.4 100 < LOQ 4.0 0.2±0.5 73
BFN < LOQ 0.8 5.2×10⁻²±8.2×10⁻² 80 < LOQ 4.7 0.2±0.5 72
BNT < LOQ 2.1×10⁻² 2.4×10⁻³±2.2×10⁻³ 6 < LOQ 0.5 2.3×10⁻²±6.2×10⁻² 46
BGF < LOQ 0.4 5.1×10⁻²±5.4×10⁻² 93 < LOQ 7.7 0.3±0.8 92
CPP < LOQ 0.2 5.0×10⁻³±2.2×10⁻² 3 < LOQ 10.3 0.3±0.9 73
TPH < LOQ 0.1 1.5×10⁻²±1.5×10⁻² 87 < LOQ 2.8 1.4×10⁻¹±3.2×10⁻¹ 86
BJF < LOQ 0.4 8.4×10⁻³±3.9×10⁻² 6 < LOQ 7.5 0.4±0.9 91
BEP < LOQ 0.5 1.0×10⁻²±4.6×10⁻² 5 < LOQ 7.2 0.4±0.8 87
PER 2 < LOQ 1.5 6.9×10⁻²±1.5×10⁻¹ 61
DCA 2 < LOQ 0.6 2.9×10⁻²±6.7×10⁻² 55
ATT 2 < LOQ 1.7 4.7×10⁻²±1.5×10⁻¹ 48
COR 2 < LOQ 3.3 1.3×10⁻¹±3.2×10⁻¹ 64
PPAHs 0.6 138.6 11.3±15.7 0.1 189.3 9.3±21.2
SD: standard deviation; < LOQ: below limit of quantification;PPAHs: the sum of the concentrations of individual PAHs with DF > 10 % in either gas or particulate phase. Concentration ranges and means are only reported for analytes with DF > 2 %.
to 485.9 ng L−1) but noticeably lower than that measured
by Holoubek et al. (2007) (i.e., from 2.4 to 6310 ng L−1). The concentrations of PCBs and CPs, targeted for analysis in rainwater samples, were < LOQs and, therefore, are not discussed hereafter.
3.2 Wet deposition fluxes P
PAH daily wet deposition fluxes ranged from < LOQ to 5.5×10³(mean±SD: 632.9±900.1) ng m−2 (Table 4).
PPAH seasonal fluxes were noticeably higher during win-ter and spring compared to summer and autumn (Fig. 1), which is in agreement with previous observations in Eu-rope (Kiss et al., 2001; Škrdlíková et al., 2011). Seasonal changes in SOC fluxes could be due to different factors, such as variations in atmospheric concentrations, precipi-tation amounts (providing that atmospheric concentrations do not change drastically between seasons), and SOC gas-particle partitioning behavior. The increase in PAH fluxes during winter and spring cannot be explained by changes in precipitation amounts, as indicated in Fig. 1. However,
at-mospheric concentrations of PAHs were noticeably higher in winter than they were in other seasons (Fig. 1), in agree-ment with a previously published study in Europe (Lam-mel et al., 2011). This may be due to higher emission rate, lower boundary layer mixing height (Birgül et al., 2011), and lower concentrations of OH radicals in winter (Hal-sall et al., 2001). This may partly explain the higher fluxes seen during winter periods. Finally, lower temperatures in winter could potentially shift partitioning of the more tem-perature sensitive SOCs towards particulate phase, and par-ticle scavenging, as opposed to gas scavenging, was sug-gested to be the dominant wet scavenging mechanism for the removal of PAHs from the atmosphere (Bidleman, 1988; Poster and Baker, 1996; Offenberg and Baker, 2002). In the present study, significant negative regressions were found between near-ground temperature and θ for a number of PAHs including PYR (r2=0.72, P <0.05, n=150), FLT
(r2=0.69, n=155), RET (r2=0.75, n=156), and TPH
(r2=0.73, n=162) (Table S4), which could provide further
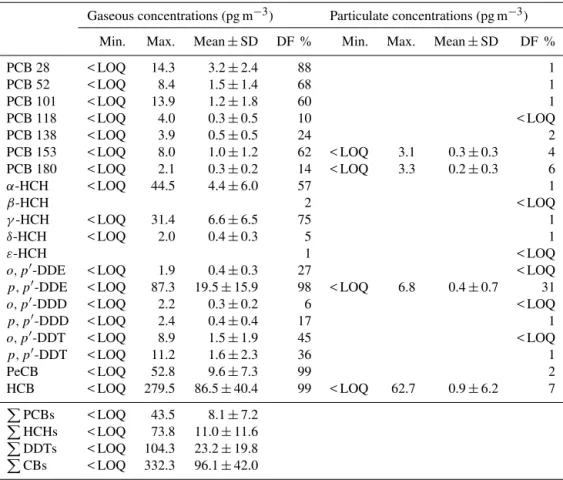
Table 2.PCB and CP concentrations and detection frequencies (DF) in air (n=162).
Gaseous concentrations (pg m−3) Particulate concentrations (pg m−3)
Min. Max. Mean±SD DF % Min. Max. Mean±SD DF %
PCB 28 < LOQ 14.3 3.2±2.4 88 1 PCB 52 < LOQ 8.4 1.5±1.4 68 1 PCB 101 < LOQ 13.9 1.2±1.8 60 1 PCB 118 < LOQ 4.0 0.3±0.5 10 < LOQ PCB 138 < LOQ 3.9 0.5±0.5 24 2 PCB 153 < LOQ 8.0 1.0±1.2 62 < LOQ 3.1 0.3±0.3 4 PCB 180 < LOQ 2.1 0.3±0.2 14 < LOQ 3.3 0.2±0.3 6
α-HCH < LOQ 44.5 4.4±6.0 57 1
β-HCH 2 < LOQ
γ-HCH < LOQ 31.4 6.6±6.5 75 1
δ-HCH < LOQ 2.0 0.4±0.3 5 1
ε-HCH 1 < LOQ
o, p′-DDE < LOQ 1.9 0.4±0.3 27 < LOQ
p, p′-DDE < LOQ 87.3 19.5±15.9 98 < LOQ 6.8 0.4±0.7 31
o, p′-DDD < LOQ 2.2 0.3±0.2 6 < LOQ
p, p′-DDD < LOQ 2.4 0.4±0.4 17 1
o, p′-DDT < LOQ 8.9 1.5±1.9 45 < LOQ
p, p′-DDT < LOQ 11.2 1.6±2.3 36 1 PeCB < LOQ 52.8 9.6±7.3 99 2 HCB < LOQ 279.5 86.5±40.4 99 < LOQ 62.7 0.9±6.2 7 PPCBs < LOQ 43.5 8.1
±7.2 PHCHs < LOQ 73.8 11.0
±11.6 PDDTs < LOQ 104.3 23.2
±19.8 PCBs < LOQ 332.3 96.1
±42.0
SD: standard deviation; < LOQ: below limit of quantification;PPCBs : the sum of the concentrations of PCBs 28, 52, 101, 118, 138, 153, and 180;PHCHs: the sum of the concentrations ofα- andγ-HCH;PDDTs: the sum of the concentrations of
o, p′-DDE,p, p′-DDE,p, p′-DDD,o, p′-DDT, andp, p′-DDT;PCBs: the sum of the concentrations of PeCB and HCB. Note that only analytes with DF> 10 % in either gas or particulate phase were considered for calculating the sums. Concentration ranges and means are only reported for analytes with DF > 2 %.
3.3 Scavenging ratios
Scavenging ratios were only determined for those events with air and rainwater sampled from the same air mass (n=54).
The rejection criterion was that frontal passage didnotoccur
over the site prior (±1 h uncertainty) to the onset of rain.
Out of 54 pair samples, only 32 met the above-mentioned criterion (Table S2) and, hence, Wt ratios were determined for 32 rain events.
The relative importance of gas and particle scavenging can be calculated theoretically usingWt and gas scavenging ra-tio obtained through the dimensionless Henry’s law constant (Offenberg and Baker, 2002; Poster and Baker, 1996). How-ever, this approach was avoided in the present study due to the fact that the equilibrium partitioning of SOCs between gas phase and raindrops, and consequently gas scavenging ratios, is greatly affected by temperature, which may change drastically from cloud to ground level. This process is non-linear and a representative temperature is unknown. This means that Henry’s law constants, which are corrected using ground temperatures, may not necessarily represent the true
gas scavenging ratios related to falling raindrops. One should also note that theoretical gas scavenging ratios for SOCs in gas phase, being the inverse of their Henry’s law constants, may not entirely reflect the underlying mechanism of the compound removal from the atmosphere. For instance, PAHs with higher vapor pressure normally show higher Henry’s law constants, as can be seen from experimental data (Bam-ford et al., 1999). This would result in relatively lower gas scavenging ratios for gaseous PAHs with higher vapor pres-sure and solubility.
In the present study, the concentrations of ionic species (i.e., the sum of SO2−
4 and NO−3) in PM and those in ad-jacent rainwater samples were significantly correlated (r=
0.71, P <0.05, n=23). This indicates the efficient removal
of PM by rainfall and highlights the importance of particle scavenging in the present study. In general,Wtratios for in-dividual PAHs ranged from 0 (in cases where concentrations in rainwater were < LOQ) to 3.5×10⁵, with the exception of
FLT for whichWt ranged between 3.7×10³ and 1.3×10⁶
0
10000 20000 30000 40000
ng m
-2
∑ PAH Fwet
2012 2013
0 50 100 150 200 250 300 350
mm
Precipitation
0 10 20 30 40 50 60 70
D.J.F. M.A.M. J.J.A. S.O.N.
ng m
-3
∑ PAH air concentrations
Figure 1. PPAH seasonal fluxes (Fwet), precipitation amounts, and PPAH median air concentrations in winter (D.J.F.), spring (M.A.M.), summer (J.J.A.), and autumn (S.O.N.) at Košetice.
namely ACY, ACE, FLN, ANT, and PHE, were up to 104, whereas the values for the rest of PAHs (logKoa> 8.70) were up to 106, but mainly dominated by the values close to 105 (Table 5). Taking into account that SOCs are more efficiently removed from the atmosphere by particle scavenging, the current results may imply that increase in affinity of individ-ual PAHs towards organic phase would overall lead to higher scavenging efficiencies. This, together with other parameters that affect analyte gas-particle partitioning, namely temper-ature, aerosol surface area and chemical composition (e.g., EC and OC contents) (Junge, 1977; Pankow, 1987; Bidle-man, 1988), and factors that affect particle removal rate in-cluding rain intensity, aerosol and raindrop size and collision efficiency (Mircea et al., 2000; Poster and Baker, 1996; Slinn et al., 1978), may contribute to the observed variability in measured scavenging ratios.
Table 3.PAH concentrations and detection frequencies (DF) in rainwater (n=231).
Concentrations (ng L−1)
Min. Max. Mean±SD DF %
ACY < LOQ 23.7 2.1±2.8 67 ACE < LOQ 7.0 1.0±1.2 54 FLN < LOQ 41.6 6.0±5.8 99 PHE < LOQ 268.0 23.5±29.2 99 ANT < LOQ 41.2 1.1±3.2 56 FLT < LOQ 1.1×10³ 61.4±144.6 99 PYR < LOQ 282.5 17.7±27.0 91 BAA < LOQ 76.9 3.1±6.7 63 CHR < LOQ 141.8 9.1±14.9 75 BBF < LOQ 85.2 6.5±13.0 69 BKF < LOQ 42.3 2.8±4.8 63 BAP < LOQ 50.0 2.3±4.9 55 IPY < LOQ 58.2 3.6±7.1 60 DHA < LOQ 3.9 0.3±0.4 25 BPE < LOQ 50.9 3.6±6.5 59 RET < LOQ 44.0 3.1±4.6 73 BFN < LOQ 67.2 3.1±6.0 62 BNT < LOQ 6.7 0.5±0.7 43 BGF < LOQ 70.8 4.9±7.7 70 CPP < LOQ 17.4 1.1±2.2 48 TPH < LOQ 44.2 3.5±5.4 67 BJF < LOQ 63.0 5.6±9.7 64 BEP < LOQ 60.0 4.8±7.6 73 PER < LOQ 7.8 0.5±0.9 39 DCA < LOQ 7.7 0.4±0.7 27 ATT < LOQ 8.0 0.3±0.7 18 COR < LOQ 22.1 1.5±2.9 52 PPAHs < LOQ 2.1
×103 173.3±256.1
SD: standard deviation; < LOQ: below limit of quantification;PPAHs: the sum of the concentrations of 27 individual PAHs listed on the table.
Since chlorinated compounds in the present study were mainly detected in gas phase in the air (Table 2), it is likely that their removal from the atmosphere was determined by gas scavenging. The fact that concentrations of these ana-lytes in rainwater were below quantification limits may pro-vide further epro-vidence for this argument, as the magnitude of gas scavenging is negligible.
The upper- and lower-bound scavenged mass fractions of target analytes corresponding to cloud base and top heights were determined for 32 events, except in one case for which cloud top height was not available (Table S2). PPAH upper-bound scavenged mass fractions ranged from 1.2×10⁻³ to 0.8 (median: 5.3×10⁻²), whereas lower-bound mass fractions were between 5.2×10⁻⁴and 0.1
Table 4.PAH daily wet deposition fluxes (Fwet).
Fwet(ng m−2)
Min. Max. Mean±SD
ACY < LOQ 94.8 8.4±14.0 ACE < LOQ 76.1 4.3±8.8 FLN < LOQ 305.3 29.8±43.7 PHE < LOQ 816.8 102.1±133.1 ANT < LOQ 332.4 4.4±22.6 FLT < LOQ 4.0×10³ 204.1±413.0 PYR < LOQ 753.7 66.6±106.0 BAA < LOQ 182.7 10.6±23.1 CHR < LOQ 407.5 34.0±60.6 BBF < LOQ 569.9 21.5±51.4 BKF < LOQ 165.7 9.8±19.0 BAP < LOQ 180.5 7.1±17.9 IPY < LOQ 178.3 12.2±25.9 DHA < LOQ 13.5 0.6±1.8 BPE < LOQ 161.2 12.1±24.5 RET < LOQ 234.3 12.7±24.3 BFN < LOQ 163.5 11.6±23.0 BNT < LOQ 18.1 1.3±2.7 BGF < LOQ 240.6 18.4±31.7 CPP < LOQ 94.5 3.4±9.8 TPH < LOQ 104.1 12.4±20.0 BJF < LOQ 374.2 20.6±43.4 BEP < LOQ 249.1 16.8±29.8 PER < LOQ 34.7 1.4±3.6 DCA < LOQ 16.7 0.8±2.3 ATT < LOQ 21.3 0.7±2.5 COR < LOQ 66.5 5.0±10.5 PPAHs < LOQ 5.5
×103 632.9±900.1
SD: standard deviation; < LOQ: below limit of quantification.
small number of events considered in that study (n=10). It
should be noted that scavenged mass fractions were calcu-lated assuming that analyte concentrations near ground rep-resented those within the air column up to cloud top – i.e., assuming perfect mixing throughout the column. The true scavenged mass fractions could potentially be higher due to a negative vertical concentration gradient (Škrdlíková et al., 2011).
3.4 Factors affecting the scavenging ratios
As can be seen from Tables 5 and S3,Wtratios forPPAHs in the present study ranged from 2.4×10³ to 2.3×10⁵,
with noticeable variability between the events (mean±SD:
1.7×10⁴±3.8×10⁴). As discussed earlier, different pa-rameters could contribute to the variability seen in scav-enging ratios. In this section, we investigate potential rela-tionships between PAH scavenging efficiencies and precipi-tation intensity, near-ground temperature, the concentrations of PM2.5, PM10, PM ionic species (i.e., the sum of the
con-centrations of SO2−
4 , NO−3, and NH+4), EC and OC, PM
surface area, and rainwater ionic species (i.e., the sum of SO2−
4 , NO−3, and Cl−). As can be seen from Table S3, the highestPPAHWt was found for the samples collected on 14 April 2012. The ratio was nearly 2 orders of magnitude higher compared to that obtained for another event with sim-ilar precipitation type and ambient temperature (i.e., 11–12 October 2012). Apart from the concentrations of PM10 and ionic species in PM and rainwater, the rest of the parame-ters were somewhat similar for these two events (Table S3). The concentrations of PM10as well as those for ionic species in PM and rainwater for the former event were 1.4, 1.8, and 11 times the values found for the latter event. This obser-vation suggests that PM removal by rain, and consequently wet scavenging of PAHs that are sorbed to PM, is enhanced in conditions where PM contains high quantities of soluble species. This argument is supported by considerably higher scavenging ratios found for particulate PAHs (a factor of 50 on average) in the former event. This difference was much smaller for gaseous species (a factor of 5 on average).
In order to explore the relative importance of the above-mentioned parameters in relation to scavenging ratios, cor-relation analysis was performed between these variables. Among all parameters, aerosol surface area concentration was only available for 2012. In addition, aerosol EC and OC contents could only be obtained for 15 rain events out of 32, as they were recorded once every 6 days (Ta-ble S3). Owing to the fact that EC and OC have high im-portance in SOC gas-particle partitioning (Lohmann and Lammel, 2004), and in order to enhance the comparabil-ity of results, for all other parameters, correlation analy-sis was only performed for the corresponding rain events. The results showed that the concentrations of rainwater ionic species were significantly correlated withPPAH scaveng-ing ratios (r=0.70, P <0.05, n=15), whereas weak
corre-lations were found for all other parameters, except the ra-tio of PM ionic species/PM10, for which a moderate cor-relation was found (r=0.34, P >0.05). However, when the data related to 14 April 2012 (with exceptionally highWt ratio) was excluded from the analysis, the suggested im-portance of rainwater and PM ionic species decreased (r=
0.14 and 0.07, respectively, P >0.05, n=14). This
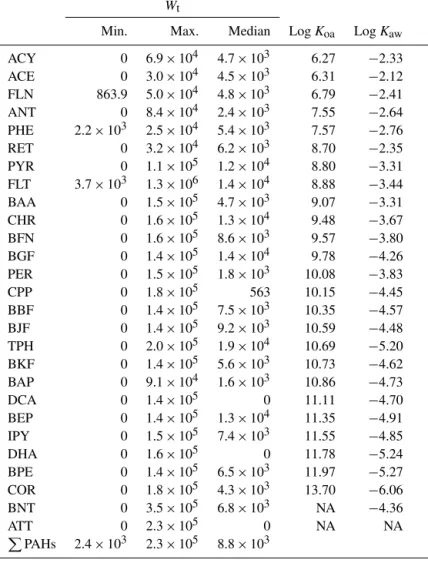
mod-Table 5.PAH scavenging ratios (Wt).
Wt
Min. Max. Median LogKoa LogKaw
ACY 0 6.9×10⁴ 4.7×10³ 6.27 −2.33 ACE 0 3.0×10⁴ 4.5×10³ 6.31 −2.12 FLN 863.9 5.0×10⁴ 4.8×10³ 6.79 −2.41 ANT 0 8.4×10⁴ 2.4×10³ 7.55 −2.64 PHE 2.2×10³ 2.5×10⁴ 5.4×10³ 7.57 −2.76 RET 0 3.2×10⁴ 6.2×10³ 8.70 −2.35 PYR 0 1.1×10⁵ 1.2×10⁴ 8.80 −3.31 FLT 3.7×10³ 1.3×10⁶ 1.4×10⁴ 8.88 −3.44 BAA 0 1.5×10⁵ 4.7×10³ 9.07 −3.31 CHR 0 1.6×10⁵ 1.3×10⁴ 9.48 −3.67 BFN 0 1.6×10⁵ 8.6×10³ 9.57 −3.80 BGF 0 1.4×10⁵ 1.4×10⁴ 9.78 −4.26 PER 0 1.5×10⁵ 1.8×10³ 10.08 −3.83 CPP 0 1.8×10⁵ 563 10.15 −4.45 BBF 0 1.4×10⁵ 7.5×10³ 10.35 −4.57 BJF 0 1.4×10⁵ 9.2×10³ 10.59 −4.48 TPH 0 2.0×10⁵ 1.9×10⁴ 10.69 −5.20 BKF 0 1.4×10⁵ 5.6×10³ 10.73 −4.62 BAP 0 9.1×10⁴ 1.6×10³ 10.86 −4.73 DCA 0 1.4×10⁵ 0 11.11 −4.70 BEP 0 1.4×10⁵ 1.3×10⁴ 11.35 −4.91 IPY 0 1.5×10⁵ 7.4×10³ 11.55 −4.85 DHA 0 1.6×10⁵ 0 11.78 −5.24 BPE 0 1.4×10⁵ 6.5×10³ 11.97 −5.27 COR 0 1.8×10⁵ 4.3×10³ 13.70 −6.06 BNT 0 3.5×10⁵ 6.8×10³ NA −4.36 ATT 0 2.3×10⁵ 0 NA NA PPAHs 2.4
×103 2.3×10⁵ 8.8×10³
Koa: analyte octanol–air partitioning coefficient;Kaw: analyte air–water partitioning coefficient. For ease of interpretation, analytes are sorted based on their logKoavalues. LogKoaand logKawvalues were obtained from Estimation Programs Interface Suite 4.11 (USEPA, 2012); zero value indicates an event in which analyte concentration in rainwater was < LOQ; NA: not available.
erate to high particulate mass fractions, namely PYR (mean θ=0.40), CHR (meanθ=0.74), and BBF (meanθ=0.97), were 0.38, 0.20, and 0.33 (n=10), whereas the coefficients
for correlation with OC/PM10 ratios were 0.51, 0.53, and 0.03, respectively. Despite not having statistical significance, the results may suggest that the aerosol OC content was more effective than EC for wet scavenging of PYR and CHR. It should be noted that precipitation type (i.e., snow vs. rain) was only available for 8 events out of 15. These were mainly identified as rainfall (Table S3), which ruled out the poten-tial impact of precipitation type on scavenging efficiencies. The lack of significant linear relationships between scaveng-ing ratios and aerosol and rainwater properties indicates that the process is not controlled by a single factor but rather by a combination of parameters. The findings of the present study highlight the need for incorporating other PM components,
such as EC and OC, in air pollution models for more accu-rate estimation of particulate PAH scavenging.
4 Conclusions
be more efficient in cases where the concentrations of ionic species in PM are high. In addition, the high affinity of PAHs towards EC and OC were found to be reflected in the scav-enging efficiency. In most model applications which study PAHs, particulates are scavenged either as in conventional air pollution modeling – i.e., accounting for PM ionic composi-tion, but no other PM components (parameterization based on Köhler theory or empirical approaches based on cloud droplet number) (Abdul-Razzak and Ghan, 2000; Gong et al., 2003) – or with insoluble aerosols or aerosol modes (Sehili and Lammel, 2007; Friedman and Selin, 2012). Future stud-ies would need to focus on in-depth analysis of PM chemical composition with the aim to include OC and EC in the pa-rameterizations of particulate PAH wet deposition.
The Supplement related to this article is available online at doi:10.5194/acp-15-1795-2015-supplement.
Acknowledgements. We thank Miroslava Bittová and Jan Kuta (Masaryk University) for ion analyses, Jaroslav Pekarek (CHMI) for providing meteorological data, and Vladimir Zdimal (Institute for Chemical Process Fundamentals, the Academy of Sciences of the Czech Republic) for providing aerosol number–size distribution data. This research was supported by the Granting Agency of the Czech Republic (GACR project no. P503/11/1230) and has been cofunded by the European Social Fund and the state budget of the Czech Republic. The research infrastructure (i.e., RECETOX) has been supported by the Czech Ministry of Education (LO1214 and LM2011028).
The service charges for this open access publication have been covered by the Max Planck Society.
Edited by: B. Ervens
References
Abdul-Razzak, H. and Ghan, S. J.: A parameterization of aerosol activation 2. Multiple aerosol types, J. Geophys. Res.-Atmos., 105, 6837–6844, 2000.
Agrell, C., Larsson, P., Okla, L., and Agrell, J.: PCB congeners in precipitation, wash out ratios and depositional fluxes within the Baltic Sea region, Europe, Atmos. Environ., 36, 371–383, 2002. Atlas, E. and Giam, C. S.: Ambient concentration and precipita-tion scavenging of atmospheric organic pollutants, Water Air Soil Pollut., 38, 19–36, 1988.
Bamford, H. A., Poster, D. L., and Baker, J. E.: Temperature depen-dence of Henry’s law constants of thirteen polycyclic aromatic hydrocarbons between 4◦C and 31◦C, Environ. Toxicol. Chem.,
18, 1905–1912, 1999.
Bidleman, T. F.: Atmospheric processes, Environ. Sci. Technol., 22, 361–367, 1988.
Birgül, A., Tasdemir, Y., and Cindoruk, S. S.: Atmospheric wet and dry deposition of polycyclic aromatic hydrocarbons (PAHs) de-termined using a modified sampler, Atmos. Res., 101, 341–353, 2011.
Blais, J. M.: Biogeochemistry of persistent bioaccumulative toxi-cants: Processes affecting the transport of contaminants to re-mote areas, Can. J. Fish. Aquat. Sci., 62, 236–243, 2005. BWK: Verein Berliner Wetterkarte, e.V. (Ed.), www.
berliner-wetterkarte.de (last access: 16 February 2014), 2013.
Dvorská, A., Lammel, G., Klánová, J., and Holoubek, I.: Košetice, Czech Republic – ten years of air pollution monitoring and four years of evaluating the origin of persistent organic pollutants, En-viron. Pollut., 156, 403–408, 2008.
Dvorská, A., Lammel, G., and Holoubek, I.: Recent trends of persis-tent organic pollutants in air in central Europe – Air monitoring in combination with air mass trajectory statistics as a tool to study the effectivity of regional chemical policy, Atmos. Environ., 43, 1280–1287, 2009.
EPER: European Pollutant Emission Register, http://www.eea.europa.eu/data-and-maps/data/
eper-the-european-pollutant-emission-register-4 (last access: 4 March 2014), 2014.
Friedman, C. L. and Selin, N. E.: Long-range atmospheric transport of polycyclic aromatic hydrocarbons: A global 3-D model analy-sis including evaluation of arctic sources, Environ. Sci. Technol., 46, 9501–9510, 2012.
Gioia, R., Sweetman, A. J., and Jones, K. C.: Coupling passive air sampling with emission estimates and chemical fate modeling for persistent organic pollutants (POPs): A feasibility study for northern Europe, Environ. Sci. Technol., 41, 2165–2171, 2007. Gong, S. L., Barrie, L. A., Blanchet, J. P., von Salzen, K., Lohmann,
U., Lesins, G., Spacek, L., Zhang, L. M., Girard, E., Lin, H., Leaitch, R., Leighton, H., Chylek, P., and Huang, P.: Canadian Aerosol Module: A size-segregated simulation of atmospheric aerosol processes for climate and air quality models 1. Module development, J. Geophys. Res.-Atmos., 108, AAC 1–AAC 3-16, 2003.
Grimalt, J. O., Fernandez, P., Berdie, L., Vilanova, R. M., Catalan, J., Psenner, R., Hofer, R., Appleby, P. G., Rosseland, B. O., Lien, L., Massabuau, J. C., and Battarbee, R. W.: Selective trapping of organochlorine compounds in mountain lakes of temperate areas, Environ. Sci. Technol., 35, 2690–2697, 2001.
Hageman, K. J., Simonich, S. L., Campbell, D. H., Wilson, G. R., and Landers, D. H.: Atmospheric deposition of current-use and historic-use pesticides in snow at National Parks in the Western United States, Environ. Sci. Technol., 40, 3174–3180, 2006. Halsall, C. J., Sweetman, A. J., Barrie, L. A., and Jones, K. C.:
Modelling the behaviour of PAHs during atmospheric transport from the UK to the Arctic, Atmos. Environ., 35, 255–267, 2001. Halse, A. K., Schlabach, M., Eckhardt, S., Sweetman, A., Jones, K. C., and Breivik, K.: Spatial variability of POPs in Eu-ropean background air, Atmos. Chem. Phys., 11, 1549–1564, doi:10.5194/acp-11-1549-2011, 2011.
IGRA: Integrated Global Radiosonde Archive, ftp://ftp.ncdc.noaa. gov/pub/data/igra (last access: 23 February 2014), 2014. Junge, C. E.: Fate of Pollutants in the Air and Water Environments,
edited by: Suffett, I. H., John Wiley and Sons, New York, 7–25, 1977.
Kaupp, H. and McLachlan, M. S.: Distribution of polychlorinated dibenzo-P-dioxins and dibenzofurans (PCDD/Fs) and polycyclic aromatic hydrocarbons (PAHs) within the full size range of at-mospheric particles, Atmos. Environ., 34, 73–83, 2000. Kiss, G., Varga-Puchony, Z., Tolnai, B., Varga, B., Gelencsér, A.,
Krivácsy, Z., and Hlavay, J.: The seasonal changes in the con-centration of polycyclic aromatic hydrocarbons in precipitation and aerosol near Lake Balaton, Hungary, Environ. Pollut., 114, 55–61, 2001.
Lammel, G., Novák, J., Landlová, L., Dvorská, A., Klánová, J., ˇCupr, P., Kohoutek, J., Reimer, E., and Škrdlíková, L.: Sources and Distributions of Polycyclic Aromatic Hydrocarbons and Toxicity of Polluted Atmosphere Aerosols, in: Urban Airborne Particulate Matter, edited by: Zereini, F. and Wiseman, C. L. S., Environmental Science and Engineering, Springer Berlin Heidel-berg, 39–62, 2011.
Ligocki, M. P., Leuenberger, C., and Pankow, J. F.: Trace organic compounds in rain. III. Particle scavenging of neutral organic compounds, Atmos. Environ., 19, 1619–1626, 1985.
Liu, F., Xu, Y., Liu, J., Liu, D., Li, J., Zhang, G., Li, X., Zou, S., and Lai, S.: Atmospheric deposition of polycyclic aromatic hy-drocarbons (PAHs) to a coastal site of Hong Kong, South China, Atmos. Environ., 69, 265–272, 2013.
Lohmann, R. and Lammel, G.: Adsorptive and Absorptive Con-tributions to the Gas-Particle Partitioning of Polycyclic Aro-matic Hydrocarbons: State of Knowledge and Recommended Parametrization for Modeling, Environ. Sci. Technol., 38, 3793– 3803, 2004.
McLachlan, M. S. and Sellström, U.: Precipitation scavenging of particle-bound contaminants – A case study of PCDD/Fs, Atmos. Environ., 43, 6084–6090, 2009.
Mircea, M., Stefan, S., and Fuzzi, S.: Precipitation scavenging co-efficient: influence of measured aerosol and raindrop size distri-butions, Atmos. Environ., 34, 5169–5174, 2000.
Offenberg, J. H. and Baker, J. E.: Precipitation Scavenging of Poly-chlorinated Biphenyls and Polycyclic Aromatic Hydrocarbons along an Urban to Over-water Transect, Environ. Sci. Technol., 36, 3763–3771, 2002.
Pankow, J. F.: Review and comparative analysis of the theories on partitioning between the gas and aerosol particulate phases in the atmosphere, Atmos. Environ., 21, 2275–2283, 1987.
Poster, D. L. and Baker, J. E.: Influence of Submicron Particles on Hydrophobic Organic Contaminants in Precipitation. 2. Scaveng-ing of Polycyclic Aromatic Hydrocarbons by Rain, Environ. Sci. Technol., 30, 349–354, 1996.
Roots, O., Roose, A., Kull, A., Holoubek, I., ˇCupr, P., and Klánová, J.: Distribution pattern of PCBs, HCB and PeCB using passive air and soil sampling in Estonia, Environ. Sci. Pollut. Res., 17, 740–749, 2010.
Sehili, A. M. and Lammel, G.: Global fate and distribution of poly-cyclic aromatic hydrocarbons emitted from Europe and Russia, Atmos. Environ., 41, 8301–8315, 2007.
Škrdlíková, L., Landlová, L., Klánová, J., and Lammel, G.: Wet deposition and scavenging efficiency of gaseous and particulate phase polycyclic aromatic compounds at a central European sub-urban site, Atmos. Environ., 45, 4305–4312, 2011.
Slinn, W. G. N., Hasse, L., Hicks, B. B., Hogan, A. W., Lal, D., Liss, P. S., Munnich, K. O., Sehmel, G. A., and Vittori, O.: Some aspects of the transfer of atmospheric trace constituents past the air-sea interface, Atmos. Environ., 12, 2055–2087, 1978. USEPA: United States Environmental Protection Agency,
Estima-tion Programs Interface Suite™for Microsoft®Windows, v 4.11, United States Environmental Protection Agency, Washington, DC, USA, 2012.
van Ry, D. A., Gigliotti, C. L., Glenn, Nelson, E. D., Totten, L. A., and Eisenreich, S. J.: Wet Deposition of Polychlorinated Biphenyls in Urban and Background Areas of the Mid-Atlantic States, Environ. Sci. Technol., 36, 3201–3209, 2002.
Wiman, B. L. B., Unsworth, M. H., Lindberg, S. E., Bergkvist, B., Jaenicke, R., and Hansson, H. C.: Perspectives on aerosol depo-sition to natural surfaces: interactions between aerosol residence times, removal processes, the biosphere and global environmen-tal change, J. Aerosol Sci., 21, 313–338, 1990.