www.atmos-chem-phys.net/16/15801/2016/ doi:10.5194/acp-16-15801-2016
© Author(s) 2016. CC Attribution 3.0 License.
Integrated studies of a regional ozone pollution synthetically
affected by subtropical high and typhoon system in the Yangtze
River Delta region, China
Lei Shu, Min Xie, Tijian Wang, Da Gao, Pulong Chen, Yong Han, Shu Li, Bingliang Zhuang, and Mengmeng Li School of Atmospheric Sciences, CMA-NJU Joint Laboratory for Climate Prediction Studies, Jiangsu Collaborative Innovation Center for Climate Change, Nanjing University, Nanjing 210023, China
Correspondence to:Min Xie ([email protected]) and Tijian Wang ([email protected]) Received: 5 July 2016 – Published in Atmos. Chem. Phys. Discuss.: 1 August 2016
Revised: 19 November 2016 – Accepted: 9 December 2016 – Published: 23 December 2016
Abstract. Severe high ozone (O3) episodes usually have
close relations to synoptic systems. A regional continuous O3
pollution episode was detected over the Yangtze River Delta (YRD) region in China during 7–12 August 2013, in which the O3concentrations in more than half of the cities exceeded
the national air quality standard. The maximum hourly con-centration of O3reached 167.1 ppb. By means of the
obser-vational analysis and the numerical simulation, the character-istics and the essential impact factors of the typical regional O3pollution are comprehensively investigated. The
observa-tional analysis shows that the atmospheric subsidence domi-nated by the western Pacific subtropical high plays a crucial role in the formation of high-level O3. The favorable weather
conditions, such as extremely high temperature, low relative humidity and weak wind speed, caused by the abnormally strong subtropical high are responsible for the trapping and the chemical production of O3in the boundary layer. In
ad-dition, when the YRD cities are at the front of Typhoon Utor, the periphery circulation of typhoon system can enhance the downward airflows and cause worse air quality. However, when the typhoon system weakens the subtropical high, the prevailing southeasterly surface wind leads to the mitigation of the O3 pollution. The integrated process rate (IPR)
anal-ysis incorporated in the Community Multi-scale Air Quality (CMAQ) model is applied to further illustrate the combined influence of subtropical high and typhoon system in this O3
episode. The results show that the vertical diffusion (VDIF) and the gas-phase chemistry (CHEM) are two major contrib-utors to O3formation. During the episode, the contributions
of VDIF and CHEM to O3 maintain the high values over
the YRD region. On 10–12 August, the cities close to the
sea are apparently affected by the typhoon system, with the contribution of VDIF increasing to 28.45 ppb h−1in Shang-hai and 19.76 ppb h−1 in Hangzhou. In contrast, the cities far away from the sea can hardly be affected by the periph-ery circulation of typhoon system. When the typhoon system significantly weakens the subtropical high, the contribution values of all individual processes decrease to a low level in all YRD cities. These results provide an insight for the O3
pollution synthetically impacted by the western Pacific sub-tropical high and the sub-tropical cyclone system.
1 Introduction
Ground-level ozone (O3) is a secondary air pollutant
gen-erated by a series of complicated photochemical reactions involving nitrogen oxides (NOx) and hydrocarbons (HC)
(Crutzen, 1973; Sillman, 1999; Jenkin et al., 2000; T. J. Wang et al., 2006; Xie et al., 2014, 2016b). Severe O3 pollution
events usually occur in the presence of sunlight and under fa-vorable meteorological conditions, with the abundance of O3
precursors (NOxand HC) (T. J. Wang et al., 2006). This O3
pollution in troposphere can deteriorate the air quality and thereby cause adverse effects on human health and vegeta-tion (Feng et al., 2003; Fann and Risley, 2013; Landry et al., 2013). Consequently, the formation mechanism and the in-tegrated prevention of O3pollution are of great concern in
suf-fering from high levels of O3 pollution. Especially in the
most economically vibrant and densely populated areas, such as the Yangtze River Delta (YRD) region, the Pearl River Delta (PRD) region and the Beijing–Tianjin–Hebei (BTH) area, severe O3pollution episodes have frequently occurred
(Lam et al., 2005; T. J. Wang et al., 2006; An et al., 2007; Chan and Yao, 2008; Duan et al., 2008; Jiang et al., 2008; Zhang et al., 2008; Guo et al., 2009; Shao et al., 2009; Ma et al., 2012), and the background air pollutant concentrations have steadily increased (Chan and Yao, 2008; Zhang et al., 2008; Tang et al., 2009; T. Wang et al., 2009; Ma et al., 2012; Liu et al., 2013). Many studies on the O3pollution, including
satellite data analyses, field experiments and model simula-tions, have been carried out over China in order to investi-gate the temporal and spatial characteristics of surface pho-tochemical pollution (Lu and Wang, 2006; H. X. Wang et al., 2006; Tu et al., 2007; Zhang et al., 2007, 2008; Geng et al., 2008; Tang et al., 2008, 2009; Chen et al., 2009; Han et al., 2011; Ding et al., 2013; Xie et al., 2016b), nonlinear photo-chemistry of O3and its precursors (Lam et al., 2005; Ran et
al., 2009; Liu et al., 2010; Li et al., 2011; Xie et al., 2014), interactions between O3and aerosols (Lou et al., 2014; Shi et
al., 2015), the effects of urbanization on O3formation (Wang
et al., 2007; X. M. Wang et al., 2009; Liao et al., 2015; Li et al., 2016; Xie et al., 2016a; Zhu et al., 2015) and other essen-tial impact factors (Jiang et al., 2012; Li et al., 2012; Wei et al., 2012; Liu et al., 2013; Gao et al., 2016).
The YRD region is a highly developed area of urbaniza-tion and industrializaurbaniza-tion. With the accelerated economic de-velopment and remarkable increase in energy consumption, the photochemical smog with high levels of O3concentration
is becoming more and more prominent and frequent, tending to have significant regional pollution characteristics. (Chan and Yao, 2008; Ma et al., 2012; Li et al., 2012). Being lo-cated on the southeastern coast of China, YRD features a typ-ical subtroptyp-ical monsoon climate and is strongly affected by the western Pacific subtropical high in summer. Thus, high O3 concentrations are usually observed in late spring and
summer by in situ monitoring (Ding et al., 2013; Xie et al., 2016b). Severe high O3episodes usually have close relations
to synoptic systems (Huang et al., 2005, 2006; T. J. Wang et al., 2006; Jiang et al., 2008; Cheng et al., 2014; Hung and Lo, 2015). Horizontal and vertical transport processes from upwind O3-rich air masses as well as poor atmospheric
dif-fusion conditions can lead to the accumulation of surface O3
concentrations and aggravation of the photochemical pollu-tion (T. J. Wang et al., 2006). In previous studies on high O3pollution in the YRD region, some researchers have
dis-cussed this issue. For example, Jiang et al. (2012) investi-gated the spring O3formation over East China and suggested
that O3concentrations over the YRD region were transported
and diffused from surrounding areas. Li et al. (2012) pre-sented quantitative analysis on atmospheric processes affect-ing O3concentrations in the typical YRD cities during a
sum-mertime regional high O3episode and found that the
maxi-mum concentration of photochemical pollutants was usually related to the process of transportation. Gao et al. (2016) evaluated the O3 concentration during a frequent shifting
wind period and revealed that vertical mixing played an im-portant positive role in the formation of surface O3.
How-ever, these investigations only focused on the O3formation
mechanism for one megacity (such as Shanghai, Nanjing and Hangzhou) or just a single station. Up to now, studies on the process analysis of high ozone episodes over the YRD are quite limited (Li et al., 2012). So, more studies should pay attention to the typical weather systems and the exact forma-tion mechanism of the regional O3pollution in this region.
During 7–12 August 2013, there was a typical regional O3
pollution episode in the YRD region, which might be syn-thetically influenced by the western Pacific subtropical high and Typhoon Utor. To better understand the important factors impacting O3formation from the regional scale, we
investi-gated the exact roles of these two typical weather systems in this pollution episode by using observational analysis and numerical simulations. The observational analysis was per-formed to identify the temporal and spatial characteristics of the episode. The WRF/CMAQ modeling system, which con-sists of the Weather Research and Forecasting model (WRF) and the Community Multi-scale Air Quality (CMAQ) model, was used to reveal the exact formation mechanism. With the aid of the integrated process rate (IPR) analysis coupled in CMAQ, the qualitative and the quantitative analysis on the contributions of individual atmospheric processes were con-ducted as well. In this paper, brief descriptions of observa-tional data and model configurations are shown in Sect. 2. A detailed observational analysis of air quality and meteorolog-ical conditions is given in Sect. 3. The evaluation of model performance and the formation mechanism of O3 explored
by IPR technique are presented in Sect. 4. Finally, a sum-mary of main findings is given in Sect. 5.
2 Methodology
2.1 Observed meteorological and chemical data The air quality observational data are used to identify the regional characteristics of the O3 episode in August 2013.
Fifteen cities are selected as the representative research ob-jects to better reflect the status of O3 pollution over the
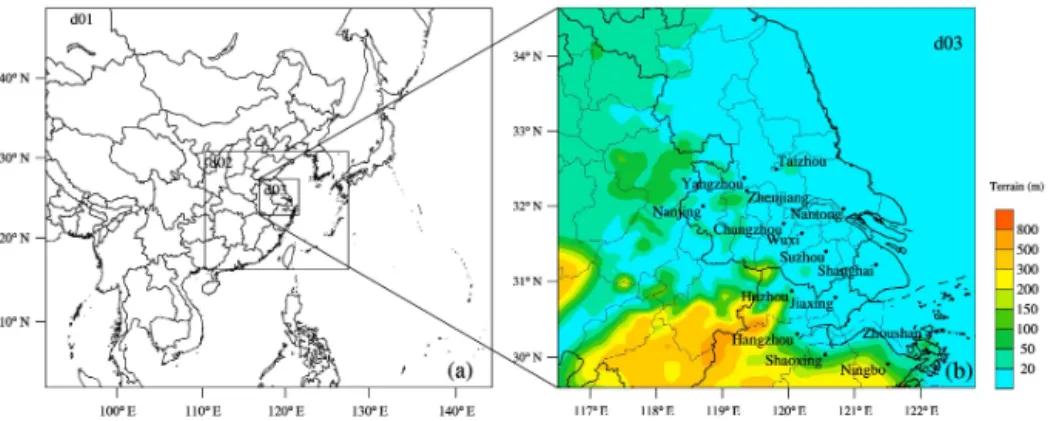
YRD region. The locations of these cities are shown in Fig. 1b, which contains Shanghai, eight cities in Jiangsu province (Changzhou, Nanjing, Nantong, Suzhou, Taizhou, Wuxi, Yangzhou and Zhenjiang) and six cities in Zhejiang province (Hangzhou, Huzhou, Jiaxing, Ningbo, Shaoxing and Zhoushan). The in situ monitoring data for the hourly concentrations of O3, CO, NO2, SO2, PM2.5 and PM10
na-Figure 1.Domain settings, including(a)the three nested modeling domains and(b)the nested domain 3 (d03) with the terrain elevations and the locations of 15 main cities in the YRD region.
tional standards (State Environmental Protection Adminis-tration of China, 2006). The hourly pollutant concenAdminis-tration for a city is calculated as the average of the pollutant concen-trations from several national monitoring sites in that city, which can better characterize the pollution level of the city. In order to identify invalid or lacking data, a checking proce-dure for these data is performed following the work of Chi-queto and Silva (2010). Finally, only less than 0.2 % of the primary data are ignored in the calculation. Moreover, the ob-served data of total volatile organic carbons (TVOC) during 4–10 August at an urban site in Shanghai (SAES, 31.17◦N, 121.43◦E) are also used. They are provided by Shanghai Academy of Environmental Sciences. The sampling height is about 15 m, and individual VOC species are continuously measured every 30 min by two online high performance gas chromatograph with flame ionization detector (GC-FID) sys-tems (Chromato-sud airmoVOC C2-C6 no. 5250308 and air-moVOC C6-C12 no. 2260308, France). The details for mea-surement and QA/QC can refer to Wang et al. (2013).
The weather charts and the observed surface meteorolog-ical records are used to analyze the synoptic systems during the episode. The weather charts for East Asia are accessible from the Korea Meteorological Administration. The hourly meteorological data at the observation sites of SH (31.40◦N, 121.46◦E) located in Shanghai, HZ (30.23◦N, 120.16◦E) in Hangzhou and NJ (32.00◦N, 118.80◦E) in Nanjing can be obtained from the University of Wyoming, where 2 m air temperature, 2 m relative humidity, 10 m wind speed and 10 m wind direction are available.
Meteorological and air quality observation data are also used to validate the reliability of simulations in this study. Comparisons of the modeling results with the observation data are performed in Shanghai, Nanjing and Hangzhou. Shanghai is the most populous city in China as well as a global financial and transportation center. Located to the northwest of Shanghai, Nanjing is the capital of the province of Jiangsu and the second largest commercial center in East China. Hangzhou is the capital of the province of Zhejiang
and located to the southwest of Shanghai. These cities are the provincial capitals and the typical metropolis in the YRD region. They are highly urbanized and industrialized, and all suffer from severe O3pollution.
2.2 Model description and configurations
In this study, WRF/CMAQ, which consists of WRF model version 3.4.1 and CMAQ model version 4.7.1, is applied to simulate the high O3 episode over the YRD region in
Au-gust 2013. Developed at the National Center for Atmospheric Research (NCAR), WRF is a new generation of mesoscale weather forecast model and assimilation system. Numerous applications have proven that it shows a good performance in all kinds of weather forecasts and has broad application prospects in China (Jiang et al., 2008, 2012; X. M. Wang et al., 2009; Liu et al., 2013; Xie et al., 2014, 2016a; Liao et al., 2014, 2015; Li et al., 2016; Zhu et al., 2015). WRF pro-vides offline meteorological fields as the input for the chem-ical transport model CMAQ. CMAQ is a third-generation regional air quality model developed by the Environmen-tal Protection Agency of USA (USEPA). A set of up-to-date compatible modules and control equations for the at-mosphere is incorporated in the model, which can fully con-sider atmospheric complicated physical processes, chemical processes and the relative contribution of different species (Byun and Schere, 2006; Foley et al., 2010). CMAQ has been widely applied in China and proven to be a reliable tool in simulating air quality from city scale to mesoscale (Li et al., 2012; Wei et al., 2012; Liu et al., 2013; Zhu et al., 2015).
The simulation run is conducted from 08:00 (local stan-dard time, LST) on 2 August to 08:00 (LST) on 16 Au-gust 2013, in which the first 48 h is taken as the spin-up time. Three one-way nested domains are used in WRF with a Lam-bert conformal map projection. The domain setting is shown in Fig. 1. The outermost domain (domain 1, d01) covers the most areas of East Asia and South Asia, with the horizontal grids of 88×75 and the grid spacing of 81 km. The nested
Table 1.The grid settings and the physical options for WRF in this study.
Items Options
Dimensions (x,y) (88, 75), (85, 70), (70, 64) Grid spacing (km) 81, 27, 9
Microphysics WRF Single-Moment 5-class scheme (Hong et al., 2004) Longwave radiation RRTM scheme (Mlawer et al., 1997)
Shortwave radiation Goddard scheme (Kim and Wang, 2011)
Surface layer Moni–Obukhov scheme (Monin and Obukhov, 1954) Land-surface layer Noah land-surface model (Chen and Dudhia, 2001) Planetary boundary layer YSU scheme (Hong et al., 2006)
Cumulus parameterization Grell–Devenyi ensemble scheme (Grell and Devenyi, 2002)
horizontal grids of 85×70 and the grid spacing of 27 km. The
finest domain (domain 3, d03) covers the core areas of the YRD region, with the grid system of 70×64 and the
resolu-tion of 9 km. For all domains, there are 23 vertical sigma lay-ers from the surface to the top pressure of 100 hPa, with about 10 layers in the planetary boundary layer. The detailed con-figuration options for the dynamic parameterization in WRF are summarized in Table 1. Additionally, the SLAB scheme that does not consider urban canopy parameters is adopted to model the urban effect. In order to reflect the rapid urban ex-pansion in the YRD region, the default United States Geolog-ical Survey (USGS) land-use archives are updated by adding the present urban land-use conditions from 500 m Moderate Resolution Imaging Spectroradiometer (MODIS) data, based on the work of Liao et al. (2014, 2015). The initial meteoro-logical fields and boundary conditions are from 1◦resolution global reanalysis data provided by National Center for Envi-ronmental Prediction (NCEP). The boundary conditions are forced every 6 h.
With respect to the air quality model, CMAQ uses the same vertical levels and the similar three nested domains as those adopted in the meteorological simulation, whereas the CMAQ domains are one grid smaller than the WRF domains. The Meteorology Chemistry Interface Processor (MCIP) is used to convert WRF outputs to the input meteoro-logical files needed by CMAQ. The Carbon Bond 05 chem-ical mechanism (CB05) (Yarwood et al., 2005) is chosen for gas-phase chemistry (CHEM), and the fourth-generation CMAQ aerosol module (Byun and Schere, 2006) is adopted for aerosol chemistry. The initial and outmost boundary con-ditions are obtained from the Model for Ozone and Re-lated Chemical Tracers version 4 (MOZART-4) (Emmons et al., 2010), while those for the two nested inner domains are extracted from the immediate concentration files of their parent domains. The anthropogenic emissions are mainly from the 2012 Multi-resolution Emission Inventory for China (MEIC) with 0.25◦
×0.25◦resolution, which is re-projected
for the grids of China in both domains. For the grids out-side of China, the inventory developed for the Intercontinen-tal Chemical Transport Experiment-Phase B (INTEX-B) by Zhang et al. (2009) is used. The natural O3precursor
emis-sions are calculated by the natural emission model developed by Xie et al. (2007, 2009, 2014), including NO from soil, VOCs from vegetation and CH4 from rice paddies and
ter-restrial plants. The biomass burning emissions are acquired from the work of Xie et al. (2014, 2016a).
2.3 IPR analysis method
The CMAQ modeling system contains process analysis mod-ule (PROCAN), which consists of the IPR analysis and the integrated reaction rate (IRR) analysis (Byun and Schere, 2006). IPR has the capability of calculating the hourly con-tributions of individual physical processes and the net effect of chemical reaction compared to the overall concentrations and thereby can determine the quantitative contribution of each process in a specific grid cell. The atmospheric pro-cesses considered in IPR include the horizontal advection (HADV), the vertical advection (ZADV), the horizontal dif-fusion (HDIF), the vertical difdif-fusion (VDIF), the emissions (EMIS), the dry deposition (DDEP), the cloud processes with the aqueous chemistry (CLDS), the aerosol processes (AERO) and CHEM. IPR has been widely applied to investi-gate the regional photochemical pollution and has proven to be an effective tool to show the relative importance of every process and provide a fundamental interpretation (Gonçalves et al., 2009; Li et al., 2012; Liu et al., 2013; Zhu et al., 2015). In this paper, the period from 4 to 15 August is selected for the IPR analysis. With the aid of IPR, we assess the roles of the individual physical and chemical processes involved in O3formation over the YRD region and further present those
in the typical cities (Shanghai, Nanjing and Hangzhou).
2.4 Evaluation method
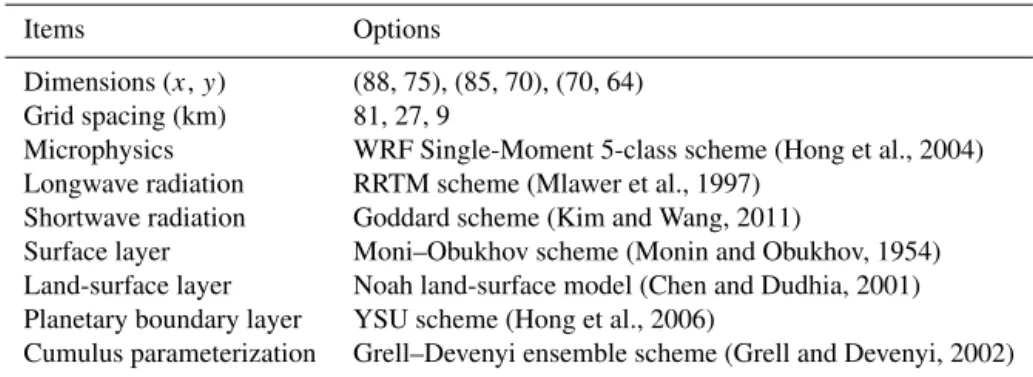
Figure 2.The time series of the observed O3concentrations in 15 typical cities from 4 to 15 August 2013 over the YRD region, which can
be divided into three areas:(a)the Southeast Coast Region (SCR), including Shanghai, Suzhou, Shaoxing, Jiaxing, Ningbo and Zhoushan;
(b)the Central Inland Region (CIR), including Wuxi, Changzhou, Nantong, Hangzhou and Huzhou;(c)the Northwest Inland Region (NIR), including Nanjing, Zhenjiang, Taizhou and Yangzhou. The gray solid lines in(a),(b)and(c)represent the national standard for the hourly O3concentration, which is 200 µg m−3.
values are calculated as follows:
R=
N
P
i=1
(Si−S)(Oi−O)
s
N
P
i=1
(Si−S)2
s
N
P
i=1
(Oi−O)
, (1)
NMB=
N
P
i=1
(Si−Oi) N
P
i=1 Oi
×100 %, (2)
RMSE=
"
1 N
N
X
i=1
(Si−Oi)2
#12
, (3)
whereSi andOi represent the simulated and the observed
value, respectively.N means the total number of valid data. Generally, the model performance is acceptable if the values of NMB and RMSE are close to 0 and that ofRis close to 1.
3 Characteristics of the continuous ozone episode 3.1 Basic characteristic of the regional ozone episode in
August 2013
Figure 2 shows the temporal variation of the hourly O3
con-centrations observed in 15 typical cities over the YRD re-gion from 00:00 (universal time coordinated, UTC) 4 Au-gust to 23:00 (UTC) 15 AuAu-gust in 2013. Obviously, from 7 to 12 August, high O3 concentrations over 93.5 ppb
(ap-proximately equal to the hourly national air quality stan-dard of 200 µg m−3) have been frequently recorded in 13
cities, which means O3 concentrations in most cities over
the YRD region exceed the national air quality standard. So, this high O3 pollution episode is a typical regional O3
pol-lution episode that can affect the people and the ecosystem in a large area. In general, for each city, there is a remark-able continuous growth in O3 concentrations before the O3
episode, followed by the lasting heavy O3pollution period.
Though the O3concentrations in Shaoxing and Nanjing meet
the national O3standard, their time series still show the
sim-ilar tendency to those of the other cities in the same region. The excessive level of O3occurring in Huzhou, Jiaxing,
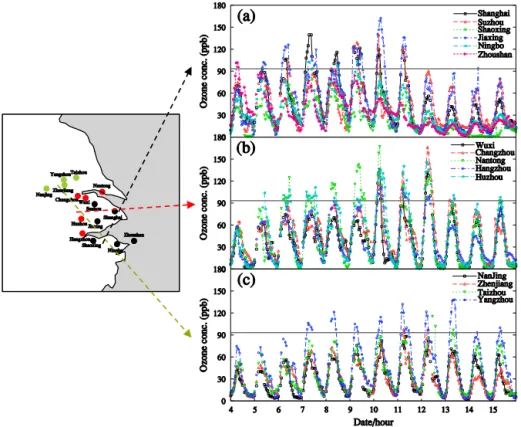
consec-Table 2.The maximum and average concentrations of O3and NO2observed in 15 cities during 7–12 August 2013 (ppb).
Sites O3 NO2
Max Mean Max Mean
Southeast Coast Region (CSR) Shanghai 139.5 55.1 35.1 15.6 Suzhou 139.1 50.9 50.6 19.7 Jiaxing 162.4 61.1 52.1 17.1 Ningbo 113.4 41.9 31.2 12.4 Shaoxing 82.6 31.9 27.8 12.7 Zhoushan 93.6 35.5 27.3 7.8
Central Inland Region (CIR) Hangzhou 111.5 48.6 30.2 16.7 Huzhou 145.6 57.2 43.8 20.8 Wuxi 135.8 43.2 39.9 18.8 Changzhou 166.1 55.7 58.4 24.5 Nantong 167.1 56.0 48.2 20.9
Northwest Inland Region (NIR) Nanjing 88.2 34.1 41.4 21.9 Yangzhou 132.1 54.1 36.0 17.1 Zhenjiang 97.5 37.7 38.5 20.1 Taizhou 115.3 40.5 18.5 7.7
utive days, reflecting the regional continuous characteristics of this O3pollution episode.
According to the temporal variation characteristics of O3
illustrated in Fig. 2, the abovementioned 15 typical YRD cities can be classified into three categories: (1) the cities in the Southeast Coastal Region (SCR), including Shang-hai, Suzhou, Jiaxing, Ningbo, Shaoxing and Zhoushan; (2) the cities in the Central Inland Region (CIR), includ-ing Hangzhou, Huzhou, Wuxi, Changzhou and Nantong; and (3) the cities in the Northwest Inland Region (NIR), includ-ing Nanjinclud-ing, Yangzhou, Zhenjiang and Taizhou. The classi-fication is primarily on basis of the observational facts that the maximum O3concentrations occur on 10–11, 12 and 13
August and begin to synchronously decrease on 12, 13 and 14 August in SCR, CIR and NIR, respectively. As shown in Fig. 2, in the SCR, Zhoushan firstly exceeds the national O3 standard on 4 August, followed by Jiaxing, Shanghai,
Suzhou and Ningbo. The peak hourly O3 concentration of
SCR occurs in Jiaxing on 10 August, with the value up to 162.4 ppb. In the CIR, Huzhou is the first city exceeding the national O3standard, followed by the order of Nantong,
Changzhou, Wuxi and Hangzhou. The high-level O3
pollu-tion in Huzhou lasts from 5 to 13 August. In Nantong and Changzhou, the maximum hourly O3concentration reaches
167.1 ppb on 10 August and 166.1 ppb on 12 August, respec-tively. As for the NIR, Yangzhou, Zhenjiang and Taizhou successively exceed the national O3standard. It is also
note-worthy that the date when O3concentration exceeds the
na-tional air quality standard in coastal region is ahead of that in inland regions, as is the date of O3decrease. The
differ-ent start time of O3decreasing in different regions might be
related to the strong southeast wind in accordance with the
movement of Typhoon Utor, which is discussed in Sect. 3.2 in detail.
Table 2 presents the maximum and the average concen-trations of O3and NO2in 15 YRD cities during 7–12
Au-gust 2013. It illustrates that the mean concentrations of NO2
in different YRD cities range from 7.7 to 24.5 ppb during the O3 episode, indicating the heterogeneity of the spatial
distribution of O3 precursor emissions. For O3, the
high-est hourly concentration (167.1 ppb) occurs in Nantong, fol-lowed by 166.1 ppb in Changzhou and 162.4 ppb in Jiaxing. These values are all nearly 2 times the national air quality standard. It seems that O3 concentrations are higher in the
cities around Shanghai, where the concentrations of O3
pre-cursors are more adequate as well. High concentrations of O3and its precursors imply that there may be stronger
pho-tochemical reactions.
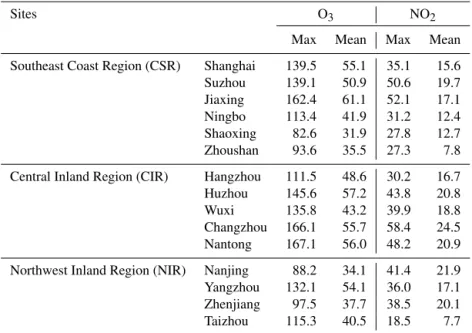
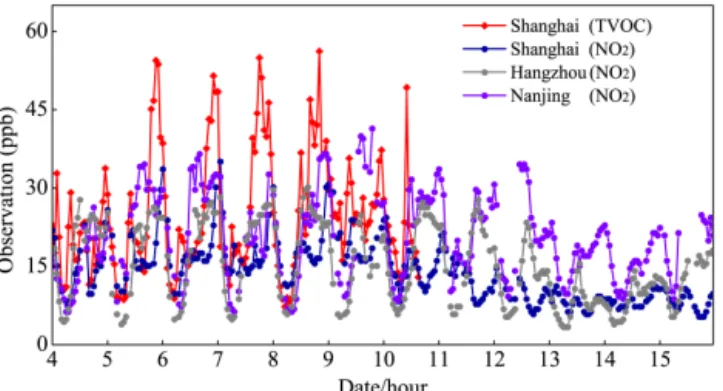
Figure 3 demonstrates the hourly variations of the observed NO2 concentrations in Shanghai, Nanjing and
Hangzhou from 4 to 15 August 2013 and the time series of TVOC observed at SAES in Shanghai from 4 to 10 Au-gust 2013. Obviously, there are two peaks in the diurnal cy-cles of NO2 and VOC at all sites, which should be related
to the rush hours in cities. The photolysis of NO2dominates
O3–VOC–NOxchemistry after 08:00 and thereby makes the
concentrations of precursors (NO2 and VOC) begin to
de-crease. Thus, the related reactions form O3and increase its
concentration until about 14:00. These diurnal variations of O3 and its precursors follow the typical patterns in the
pol-luted areas and reflect the close relationships between O3,
VOC and NOx(Wang et al., 2013; Xie et al., 2016b).
More-over, the daily variations of NO2and VOC show good
agree-ment with those of O3. For VOC, the concentration in
Figure 3.Temporal variations of the observed NO2concentrations
at Shanghai, Nanjing and Hangzhou stations from 4 to 15 August 2013 and the observed TVOC concentration at SAES (31.17◦N, 121.43◦E) in Shanghai from 4 to 10 August 2013.
with the over-standard O3concentrations since then (Fig. 2).
For NO2, the higher values occur from 6 to 11 August in all
cities, but the concentrations start to decrease on 12, 13 and 14 August in Shanghai, Hangzhou and Nanjing, respectively. It seems that the changes of O3precursors (NO2and VOC)
are also affected by the movement of Typhoon Utor.
3.2 Meteorological condition and its effect
Favorable weather conditions have large impacts on the for-mation of severe O3 pollution (Huang et al., 2005, 2006;
T. J. Wang et al., 2006; Jiang et al., 2008; Cheng et al., 2014; Hung and Lo, 2015). High-level O3episodes often take place
in hot seasons, when the meteorological conditions with high temperature and strong solar radiation are beneficial to the photochemical reactions of O3(Lam et al., 2005). Figure 4
shows the variations of the surface meteorological parame-ters that are related to this photochemical pollution episode during 4–15 August, including 2 m air temperature, 2 m rel-ative humidity, 10 m wind speed and 10 m wind direction at the meteorological sites in Shanghai (SH) of SCR, Hangzhou (HZ) of CIR and Nanjing (NJ) of NIR.
As shown in Fig. 4a, the hot weather at SH, HZ and NJ exists for nearly a week from 7 to 12 August, with the hourly maximum temperature reaching the value over 40◦C. Mean-while, the variations of 2 m relative humidity show the neg-ative correlation with those of 2 m air temperature. The min-imum 2 m relative humidity at SH and HZ occur on 9 and 10 August respectively, with the value below 75 %. These minimum values are also lower than the values before and after the O3episode, suggesting that high-level O3episodes
usually occur under the weather conditions with high temper-ature and low humidity. The value of 2 m relative humidity at NJ is relatively higher than those at SH and HZ and remains more stable. These extremely hot and dry weather conditions at SH, HZ and NJ are successively relieved on 12, 13 and 15 August, which coincides well with the reduction of
sur-face O3concentrations in Shanghai, Hangzhou and Nanjing
(Fig. 2). With respect to the observed surface wind (Fig. 4b), the 10 m wind speed at SH and HZ is comparatively lower during the period of the O3episode, while it is suddenly
in-tensified after 12 August. Meanwhile, the wind direction is fluctuating from 7 to 12 August, while it maintains south-easterly wind after 12 August as well. The growth of wind speed is more distinct at SH, with the maximum value of approximately 10 m s−1. The wind speed at NJ has an
obvi-ously diurnal variation from 4 to 8 August, and the minimum value occurs on 10 August.
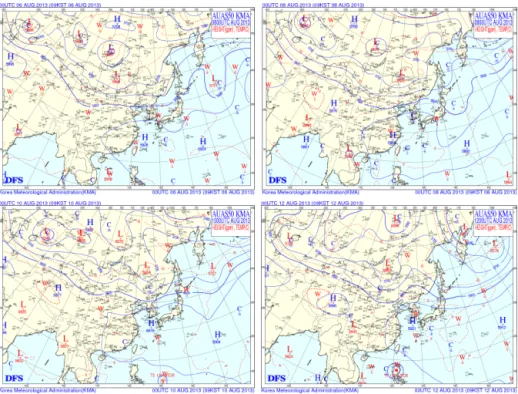
Figure 5 displays the weather charts for the 500 hPa layer over East Asia at 00:00 (UTC) on 6, 8, 10 and 12 August 2013, which can illustrate the main synoptic patterns causing the O3pollution. Obviously, during the period of the selected
O3 episode, the whole YRD region is under the control of
the strong western Pacific subtropical high, which is stronger and extends much farther west than normal. The anomaly of the subtropical high might be the direct and leading cause of the abnormally high temperature shown in Fig. 4a (Peng et al., 2014). The intensity of the subtropical high is usually characterized by the area index, defined as the total number of grid points that have geopotential heights of 588 decame-ters or greater in the region of 110–180◦E and northward of 10◦N. As shown in Fig. 5, the 5880-m area covers most of southeast China, and the high pressure center (5920-m area) is located in the southeastern coastal areas as well as the sur-rounding sea areas, which means the subtropical high is very intensive. This high pressure strengthens and remains over the YRD region for several days (from 6 to 12 August), im-plying that the air subsides to the ground. The downward air acts as a dome capping the atmosphere and helps to trap heat as well as air pollutants at the surface. Without the lift of air, there is little convection and therefore little cumulus clouds or rains. The end result is a continual accumulating of solar radiation and heat on the ground, which may greatly enhance the photochemical reactions between the abundant built-up air pollutants.
Figure 4.Temporal variations of the main meteorological parameters at Shanghai, Hangzhou and Nanjing meteorological stations during 4–15 August 2013, including(a)2 m air temperature (the red solid line) and 2 m relative humidity (the green solid line) and(b)10 m wind speed (the gray solid line) and 10 m wind direction (the blue scatter points).
Figure 5.Weather charts at the 500 hPa layer over the East Asia at 00:00 (UTC) on(a)6 August,(b)8 August,(c)10 August and(d)12 Au-gust 2013 (from Korea Meteorological Administration).
peripheral circulation. So, the typhoon system can cause the local weather around the site with high temperature, low hu-midity, strong solar radiation and small wind for a short time, before it is close enough to bring winds and rains. All these changes of meteorological conditions can help to form the severe continuous O3 pollution (Jiang et al., 2008). In this
O3 episode, the YRD region may be influenced by the
pe-ripheral circulation of Typhoon Utor as well. Especially on 10–11 August, the downward airflow in the troposphere is significantly strengthened (shown in Fig. 7), which may en-hance the buildup of heat and air pollutants and thereby result in worse air quality, shown in Fig. 2.
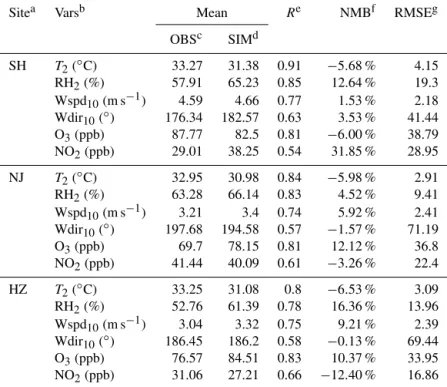
Table 3.Comparisons between the simulations and the observations at Shanghai, Nanjing and Hangzhou stations during 4–15 August 2013.
Sitea Varsb Mean Re NMBf RMSEg
OBSc SIMd
SH T2(◦C) 33.27 31.38 0.91 −5.68 % 4.15 RH2(%) 57.91 65.23 0.85 12.64 % 19.3
Wspd10(m s−1) 4.59 4.66 0.77 1.53 % 2.18
Wdir10(◦) 176.34 182.57 0.63 3.53 % 41.44
O3(ppb) 87.77 82.5 0.81 −6.00 % 38.79 NO2(ppb) 29.01 38.25 0.54 31.85 % 28.95
NJ T2(◦C) 32.95 30.98 0.84 −5.98 % 2.91 RH2(%) 63.28 66.14 0.83 4.52 % 9.41
Wspd10(m s−1) 3.21 3.4 0.74 5.92 % 2.41 Wdir10(◦) 197.68 194.58 0.57 −1.57 % 71.19 O3(ppb) 69.7 78.15 0.81 12.12 % 36.8
NO2(ppb) 41.44 40.09 0.61 −3.26 % 22.4
HZ T2(◦C) 33.25 31.08 0.8 −6.53 % 3.09 RH2(%) 52.76 61.39 0.78 16.36 % 13.96
Wspd10(m s−1) 3.04 3.32 0.75 9.21 % 2.39
Wdir10(◦) 186.45 186.2 0.58 −0.13 % 69.44 O3(ppb) 76.57 84.51 0.83 10.37 % 33.95
NO2(ppb) 31.06 27.21 0.66 −12.40 % 16.86
aSite indicates the city where the observation sites locate, including Shanghai (SH), Nanjing (NJ) and
Hangzhou (HZ).bVars indicates the variables under validation, including 2 m air temperature (T 2), 2 m
relative humidity (RH2), 10 m wind speed (Wspd10), 10 m wind direction (Wdir10), ozone (O3)and nitrogen dioxide (NO2). The words between the parentheses behind variables indicate the unit.cOBS
indicates the observation data.dSIM indicates the simulation results from WRF/CMAQ.eRindicates the correlation coefficients, with statistically significant at 95 % confident level.fNMB indicates the normalized mean bias.gRMSE indicates the root-mean-square error.
gradually becomes the prevailing southeasterly or southerly wind (Fig. 5d), with the highest wind speed up to 6–10 m s−1
in Shanghai (Fig. 4). The strengthened wind can bring the clean marine air from ocean to inland and thereby effec-tively mitigate the O3 pollution. Meantime, Typhoon Utor
also gradually affects the position and strength of the west-ern Pacific subtropical high. As the typhoon continuously approaches and finally lands on Guangdong, the high pres-sure system is forced to retreat easterly and move north-wards. When the high pressure center completely moves to the oceans, the YRD region is totally under the control of the typhoon system. In the end, the hot weather is relieved and the O3pollution is mitigated. The coastal cities in CSR
are closer to the typhoon system, so they are firstly influ-enced during this period. Thus, the wind at SH in CSR firstly changes, followed by HZ in CIR and NJ in NIR. In the same way, 2 m air temperature and O3concentrations also
succes-sively decrease from southeast (SH in CSR) to northwest (NJ in NIR) owing to the scavenging effect.
4 Modeling results and discussions 4.1 Evaluation of model performance
To evaluate the simulation performance, the hourly modeling results during the period of 4–15 August 2013 are compared with the observation records. Table 3 presents the perfor-mance statistics, including the values ofR, the NMB and the RMSE, which are all calculated for 2 m air temperature (T2),
2 m relative humidity (RH2), 10 m wind speed (Wspd10),
10 m wind direction (Wdir10), surface O3concentrations and
surface NO2concentrations in SH, NJ and HZ.
As indicated in Table 3, the simulated results of surface air temperature and relative humidity from WRF show good agreement with the observations. The highest correlation co-efficient ofT2 is found to be 0.91 at SH, followed by 0.84
at NJ and 0.80 at HZ (statistically significant at 95 % con-fident level). The corresponding correlation coefficients for RH2 are 0.85, 0.83 and 0.78, respectively. The values of
RMSE for T2at SH, NJ and HZ are 4.15, 2.91 and 3.09◦C
and those for RH2are 19.3, 9.41 and 13.96 %, respectively.
Our simulation underestimatesT2and overestimates RH2to
some certain extent, with the values of NMB forT2 at SH,
NJ and HZ being−5.68,−5.98 and−6.53 % and those for
attributed to the uncertainty caused by the SLAB scheme, which can underestimate temperature in summer (Liao et al., 2014). However, according to the relevant studies (Li et al., 2012; Liao et al., 2015; Xie et al., 2016a), this level of over-or underestimation is still acceptable. The wind components are closely related to the transport processes. As shown in Table 3, our modeling results of wind speed and direction ba-sically reflect the characteristics of wind fields. For Wspd10,
Ris 0.77 at SH, 0.74 at NJ and 0.75 at HZ. Though the values of NMB (1.53, 5.92 and 9.21 %) and RMSE (2.18, 2.41 and 2.39) display that the simulated wind speeds are a little over-estimated, the biases are still reasonable and acceptable. For Wdir10, the simulated values also fit the observation records
well, with the R values of 0.63 at SH, 0.57 at NJ and 0.58 at HZ. Comparing the mean values from SIM and OBS, we can find that WRF model generally simulates the prevailing wind direction during this period. In summary, the above-mentioned performance statistics numbers illustrate that the WRF simulation can reflect the major characteristics of me-teorological conditions of this O3 episode, and the
meteo-rological outputs can be used in the pollutant concentration simulation.
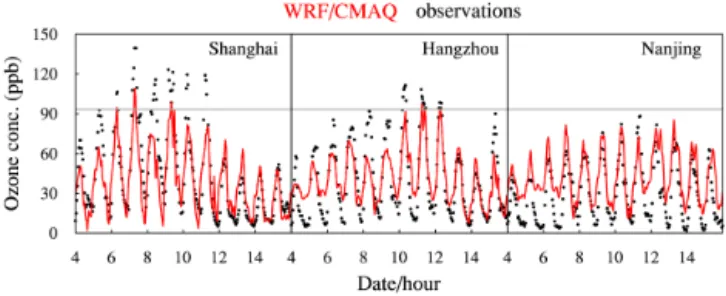
Figure 6 shows the comparisons between the modeling re-sults from CMAQ and the observed hourly concentrations of O3in Shanghai, Nanjing and Hangzhou during 4–15 August
2013. Obviously, the observations and the simulated results present reasonable agreement at each site, with the correla-tion coefficients of 0.81 to 0.83, NMB of−6 to 12.12 % and
RMSE of 33.95 to 38.79 ppb. Moreover, the simulation also reproduces the diurnal variation of O3, which shows that the
concentration reaches its maximum at around noontime and gradually decreases to its minimum after midnight. With re-spect to the O3 precursor, comparisons of NO2
concentra-tions between simulation results and observaconcentra-tions show that the correlation coefficient at each city is about 0.6 (given in Table 3), which further proves that the process of O3
for-mation is captured reasonable well over the YRD region and throughout the episode. However, CMAQ overestimates NO2
and underestimates O3in Shanghai, while it underestimates
NO2and overestimates O3in Nanjing and Hangzhou. These
biases of O3and NO2should mainly be attributed to the
un-certainties in emissions of O3precursors (NOx and VOCs)
(Li et al., 2012; Liao et al., 2015; Xie et al., 2016). Be-cause of the VOC-sensitive O3chemistry in the daytime and
NOx titration at night in the YRD region (Xie et al., 2014),
higher estimation of NOx emission in Shanghai may lead to
higher NO2and lower O3predictions, while lower NOx
esti-mations in Nanjing and Hangzhou may result in lower NO2
and higher O3modeling results. The undervalued NO2and
overvalued O3in Nanjing and Hangzhou can also be related
to the overestimations in WS10 and the negative biases in
T2. Moreover, the uncertainties in nonlinear chemical
reac-tions coupled in CMAQ may also have important effects on model predictions. For example, the modeling results cannot catch the low O3 values observed at night in Nanjing and
Figure 6.Hourly variations of the observed and the simulated O3
concentrations in Shanghai, Nanjing and Hangzhou during 4 to 15 August 2013. The red solid lines show the modeling results, the black dot lines give the observations, and the solid gray lines repre-sent the national standard for the hourly O3concentration, which is
200 µg m−3.
Hangzhou (Fig. 6), implying there may be some imperfec-tions in the nocturnal chemistry of CMAQ. Nevertheless, the performance of CMAQ model is comparable to the other ap-plications (Gonçalves et al., 2009; Li et al., 2012; Zhu et al., 2015). Compared to these previous related studies, the sim-ulation in this study attains an acceptable and satisfactory result. Thus, the consistency of simulation and observation demonstrates that the modeling results are capable of captur-ing and reproduccaptur-ing the characteristics and changes of pho-tochemical pollutants and can be used to provide valuable insights into the governing processes of this O3episode.
4.2 Characteristics of the vertical airflows
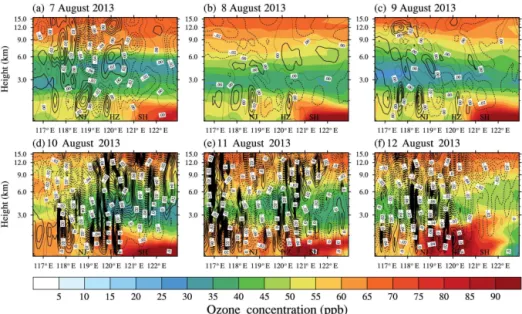
Figure 7 presents the daytime vertical wind velocity as well as the vertical distribution of O3concentrations from 116.5
to 122.9◦E along the latitude of 31.40◦N (where Shanghai is located) during 7–12 August 2013. The simulation results clearly illustrate that there are strong downward airflows over the YRD region during the period of the regional high-level O3 pollution, which can be attributed to the fact that these
areas are under the control of the subtropical high and the sinking airflow is predominant (as discussed in Sect. 3.2).
From 7 to 9 August 2013, except for the aforementioned regional sinking airflows, there are still some local thermal circulations continually occurring at the lower atmospheric layers (<2 km) along the vertical cross section of HZ–NJ. These circulations are related to urban heat islands. Usually high pressures are accompanied by more stagnant and fair dry weather, so the upward and the downward flows caused by urban-breeze circulations can easily appear in the urban areas. For the vertical distribution of O3, its high
Figure 7.Simulated daytime vertical wind velocity and vertical distribution of O3concentrations from 116.5 to 122.9◦E along the latitude
of 31.40◦N (where Shanghai is located) during 7 to 12 August 2013. The marks of SH, HZ and NJ point out the longitudes of Shanghai, Hangzhou and Nanjing, respectively. The dotted lines show the negative wind speeds and represent downward airflow, while the solid lines show the positive wind speeds and zero vertical velocity. The interval is 0.01 m s−1.
the subtropical high, such as high air temperature, stronger solar radiation and less water vapor, the chemical reactions between the built-up air pollutants can be enhanced to form the high-level O3pollution. Additionally, Fig. 7a–c also show
that there are maximum O3concentrations (>90 ppb)
occur-ring near the surface in and around SH. This phenomenon should be explained by the fact that the coastal city (SH) is firstly affected by Typhoon Utor.
From 10 to 12 August, with the approaching of Typhoon Utor, the vertical air movements over the YRD region are not restricted at the lower atmosphere anymore. As shown in Fig. 7d–f, there are stronger downward airflows from the sur-face to the top of troposphere. As discussed in Sect. 3.2, the YRD cities are at the front of the moving typhoon system, so the peripheral circulation of Typhoon Utor may enhance the sinking of atmosphere, which can lead to higher air temper-ature, lower humidity and stronger solar radiation. Affected by the enhanced downward air movement as well as the rel-evant changes of meteorological conditions, O3
concentra-tions over the YRD region maintain a high pollution level, with the O3 concentrations over 60 ppb below the height of
1.5 km (Fig. 7d–f). Furthermore, the high value center of O3 concentrations (>90 ppb) moves westwards during 10–
12 August, implying that the peripheral circulation of Ty-phoon Utor can drive the air from the coastal areas to the inland areas.
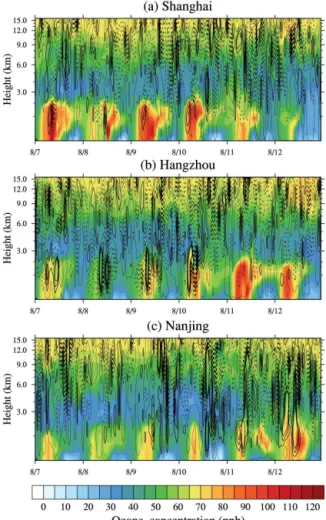
The vertical changes of wind velocity and O3
concentra-tions above Shanghai, Hangzhou and Nanjing are further illustrated in Fig. 8. Similarly, the atmospheric subsidence can also be found in the troposphere (usually occur at more than 1 km above the surface) during the period of high-level
O3 pollution. With respect to Shanghai, affected by the
ex-tremely high temperature, more active photochemical reac-tions lead to higher O3 concentrations in the whole
atmo-spheric boundary layer. The downward airflows induced by the subtropical high trap and enhance the accumulation of surface O3as time passes. Thus, high O3concentrations are
formed below 2 km above the urban areas of Shanghai, and the high concentration centers occur near the surface below 500 m. It is interesting that O3concentration on 8 August is
comparatively lower, which can be seen in Fig. 2 as well. This phenomenon can be explained by the fact that the tran-sient upward airflow occurs at above 300 m over Shanghai and inhibits the accumulation of the O3pollution at the
sur-face (shown in Fig. 8a). Additionally, Fig. 8a also presents the possible effects of Typhoon Utor on the formation of O3.
On 10 August, when the typhoon system approaches the east-ern coastal areas of China, the sinking air above Shanghai is apparently strengthened and thereby enhances the intensity of O3pollution as well as the scope of the pollution.
How-ever, after 12 August, when Typhoon Utor changes the wind and even impacts the subtropical high, high temperature is alleviated and the built-up O3is transported to other places.
Thus, the pollution is mitigated. As to Hangzhou (Fig. 8b), from 7 to 9 August, owing to weaker photochemical reac-tions, lower O3 concentrations than those in Shanghai are
found in the boundary layer. However, the O3
Au-Figure 8. Temporal variations of the vertical wind velocity and the vertical distribution of O3concentrations above(a)Shanghai, (b)Hangzhou and(c)Nanjing from 7 to 12 August 2013. The dot-ted lines show the negative wind speeds and represent the down-ward airflows, while the solid lines show the positive wind speeds and zero vertical velocity. The interval is 0.005 m s−1.
gust. However, for Nanjing, the O3 concentration does not
exceed the national O3standard during 7–12 August (Figs. 2
and 8), which should be attributed to the fact that Nanjing is far away from the coastal areas and thereby hardly affected by the downward flow in the typhoon periphery. Though the O3concentration in Nanjing increases on 12 August, it
should mainly be caused by the local photochemical reac-tions because the vertical movement below 2 km above Nan-jing is dominated by upward airflows.
It also should be mentioned that the near-surface vertical velocities around these cities are much lower than those at higher altitudes (Fig. 8). Especially in the planetary bound-ary layer (<1 km), lots of zero-velocity lines appear near the ground. This phenomenon may be related to the upward air-flow caused by urban heat islands. Thus, the maximum cen-ters of O3occur near the surface below 500 m, and the
ver-tical diffusion process plays a more important role in the
ac-cumulation of surface O3. The essential role of the vertical
diffusion process in the O3episode is similar to that reported
by Zhu et al. (2015).
4.3 Process analysis for ozone formation 4.3.1 Typical cities in the YRD region
Figure 9 shows the daytime mean contributions of different atmospheric processes to the formation of O3in SH, NJ and
HZ at the first modeling layer from 4 to 15 August 2013. As shown in the figure, for all cities during this period, the major contributors to high O3concentrations include the VDIF, the
DDEP, the CHEM and the total advection (TADV). TADV is the sum of the HADV and the ZADV. In this study, HADV and ZADV are considered together as TADV because they are inevitably linked as the inseparable parts of air circula-tion. As discussed in Sect. 3.2, the strong sinking air causes slow wind on the ground and little clouds in the sky, so the contributions of HDIF and CLDS are quite small during this episode.
In the first layer of the urban areas of Shanghai (Fig. 9a), the averaged contributions from the VDIF, the CHEM, the TADV and the DDEP during the daytime of 4–15 August are 9.95, 10.10, −11.74 and −7.28 ppb h−1, respectively.
Ob-viously, VDIF and CHEM exhibit significant positive con-tributions to O3during most days, while TADV and DDEP
mainly show the consumption contributions. The sinking air caused by the weather system discussed in Sect. 3.2 can trap heat and air pollutants on the ground and make VDIF be the most import source of surface O3. Meanwhile, the
hotter and dryer weather with more sunshine, above 40◦C and comparatively low relative humidity (shown in Fig. 4), which is related to the sinking air, can enhance the pho-tochemical reactions. Thus, CHEM can form more O3 on
the ground. Compared with the time series of CHEM and DDEP in which there are no obvious fluctuations, the val-ues of VDIF and TADV significantly change with the time, with the daytime mean contributions varying from 3.99 to 28.45 ppb h−1for VDIF and from
−2.56 to−28.13 ppb h−1
for TADV. These time variations should be related to the changes of vertical air movement. For example, the value of VDIF on 8 August is only 3.99 ppb h−1, which can be
attributed to the local transient upward airflow over Shang-hai (shown in Fig. 8a). On 10 August, however, VDIF can contribute 28.45 ppb O3h−1, which may be related to the
enhanced downward air movement caused by the periph-eral circulation of Typhoon Utor. Moreover, during the high-level O3episode from 7 to 12 August, the mean values for
VDIF, CHEM, TADV and DDEP are 13.41, 11.21, −8.37
and−14.74 ppb h−1. However, after 12 August, the mean
contributions of VDIF, CHEM, TADV and DDEP decrease to 5.35, 9.53,−5.52 and−10.85 ppb h−1. These reductions
Figure 9. Variations of the daytime mean values for the contri-butions of individual processes to O3 formation in(a)Shanghai,
(b)Hangzhou and(c)Nanjing from 4 to 15 August 2013 at the sur-face layer. The contributors include the total advection (TADV), the horizontal diffusion (HDIF), the vertical diffusion (VDIF), the gas-phase chemistry (CHEM), the dry deposition (DDEP) and the cloud processes with the aqueous chemistry (CLDS).
(Fig. 5d). By quantifying the relative importance of each pro-cess to O3formation, the IPR analysis provides a
fundamen-tal explanation for the synthetical influence of the high pres-sure and the typhoon system, which has been discussed in Sects. 3.2 and 4.1, and further illustrates the exact mecha-nism.
Figure 9b presents the result of IPR analysis for Hangzhou. During 4–15 August, VDIF and CHEM are the major source of surface O3with the average contribution of 5.36 ppb h−1
for VDIF and 10.97 ppb h−1 for CHEM, while TADV and DDEP are two important sinks for O3with the average
con-tribution of−9.63 ppb h−1for TADV and−5.14 ppb h−1for
DDEP. Synthetically impacted by western Pacific subtropical high and Typhoon Utor, the mean contributions during the O3
episode (from 7 to 12 August) for VDIF, CHEM, TADV and
DDEP increase to 7.21, 12.61,−11.51 and−5.92 ppb h−1,
respectively. The highest VDIF contribution occurs on 10– 11 August, and the over-standard of O3 concentration
ap-pears on 10–12 August as well, which may be attributed to the effect of typhoon’s peripheral circulation, implying Ty-phoon Utor also plays an essential role in the formation of O3 pollution in Hangzhou. After Typhoon Utor approaches
close enough to Hangzhou, the wind direction is mainly dom-inated by the southeast wind (Fig. 4b), and the mean values of VDIF, CHEM, TADV and DDEP finally decrease to 4.84, 10.08, −8.92 and −4.78 ppb h−1, respectively. In a word,
Hangzhou is located close to Shanghai, so the temporal vari-ations of VDIF, CHEM, TADV and DDEP in Hangzhou are similar to those in Shanghai.
However, the similar variation pattern of VDIF, CHEM, TADV and DDEP occurring in Shanghai and Hangzhou does not appear in Nanjing. As shown in Fig. 9c, the mean contri-butions of VDIF, CHEM, TADV and DDEP to surface O3in
Nanjing are 11.31, 9.55−1.34 and−17.57 ppb h−1 during
the whole period, while the values during 7–12 August are 10.32, 10.70,−0.99 and−18.42 ppb h−1. There are no
ap-parent fluctuations or sudden increases of these contributors during the period from 4 to 15 August or the O3
concen-tration (Fig. 2), temperature and relative humidity (Fig. 4a), implying Nanjing is generally under the control of the west-ern Pacific subtropical high and can hardly be affected by the typhoon system. As a typical city in the northwest inland area of the YRD region (NIR), Nanjing is located far away from the sea, which means it may not be easily affected by the peripheral circulation of the typhoon system.
Additionally, at the altitude of 500 and 1500 m above Shanghai, Nanjing and Hangzhou (not shown), CHEM is also the major contributor to O3 formation, with the
val-ues a litter lower than those at the surface, suggesting that there are strong photochemical reactions in the whole bound-ary layer of these YRD cities. In contrast, VDIF has an op-posite effect in the middle of the boundary layer, with the negative contributions for O3 of −3.26 ppb h−1 in
Shang-hai,−2.37 ppb h−1in Hangzhou and−3.21 ppb h−1in
Nan-jing, respectively (not shown). The loss of O3at higher
at-mospheric level caused by VDIF further proves the essential role of the downward vertical movement in this O3episode.
4.3.2 Spatial distribution of the contributors for the O3
episode over the YRD region
Figure 10 demonstrates the spatial distribution of the day-time mean contributions of main processes (VDIF, CHEM, DDEP and TADV) to the ozone formation at the lowest mod-eling layer in domain 3 during this high-level O3 episode.
The modeling results from 7 to 12 August are averaged to provide the mean values.
ar-Figure 10.The daytime mean contributions of main processes to O3formation over the YRD region, including(a)vertical diffusion (VDIF), (b)gas chemistry (CHEM),(c)dry deposition (DDEP) and(d)total advection (TADV). The values are averaged from 7 to 12 August 2013.
eas during the high-level O3 episode. The contributions of
VDIF in domain 3 (Fig. 10a) range from 5 to 25 ppb h−1, with the high values (>20 ppb h−1) occurring in the south-east coastal areas. For CHEM (Fig. 10b), the contributions vary within the range of 0–15 ppb h−1, with the high
val-ues over 10 ppb h−1appearing in and around the big cities.
As discussed above, these regional positive contributions of VDIF and CHEM over domain 3 should be related to the facts that the whole region is under the control of the western Pacific subtropical high. With respect to the higher contribu-tions of CHEM in the urban areas, they should be attributed to the spatial distribution of the emissions of O3precursors,
which is also higher in the cities. Furthermore, higher air temperature in the cities related to the urban heat island may enhance the chemical reactions and form more O3 in these
areas as well.
For DDEP, it is the main critical factor of the consump-tion of O3, with the negative contributions varying from 0 to −25 ppb h−1over the modeling domain 3 (Fig. 10c). Small
values usually occur on the water, which may be related to less air pollution over rivers, lakes and oceans. High values can be found on land, especially in the southeast coastal ar-eas. For the contributions of TADV, the values in domain 3 range from −10 to 10 ppb h−1, with the positive
contri-butions generally occurring on land and the negative ones appearing on the water (Fig. 10d). The maximum positive
contributions of TADV are usually found along the boundary between the land and the water, which should be explained by the facts that the land–sea breeze circulations can play an important role in the redistribution of the formed O3. On
ac-count of the high-pressure system and resulting sinking air-flows in the YRD region, the background wind is relatively weak in comparison to the local atmospheric circulation, thus the sea breeze can easily bring more generated O3 to the
seashore.
From the discussion in Sects. 3 and 4.2, it can be deduced that typhoon Utor plays an important role in the formation of ozone over the YRD region during 10–12 August. To clearly clarify the effect of the typhoon system in this O3pollution
episode, we firstly average the modeling results of VDIF, CHEM, DDEP and TADV during 10–12 August to show their contributions to O3formation when the typhoon system
plays an important role. Secondly, the modeling results of these processes from 7 to 9 August are also averaged to pro-vide their contributions when only the subtropical high domi-nates the episode. Finally, the differences of the contributions of VDIF, CHEM, DDEP and TADV between the period of 7– 9 and 10–12 August are calculated to reveal the role of the typhoon system in this severe high O3episode (Fig. 11). As
Figure 11.The difference of daytime mean contributions of main processes to O3formation over the YRD region between the period of 10–
12 and 7–9 August, including(a)vertical diffusion (VDIF),(b)gas chemistry (CHEM),(c)dry deposition (DDEP) and(d)total advection (TADV).
increment values (>30 ppb h−1) occurring in the SCR and CIR, implying that SCR and CIR can be largely affected by the peripheral subsidence airflows of the typhoon system. As to the contributions of CHEM, the increases caused by the typhoon system are 0–5 ppb h−1 over the YRD region, and the higher increment also appears in the coastal areas (Fig. 11b). For DDEP, influenced by typhoon Utor, its neg-ative contributions decrease by up to−20 ppb h−1, with the
largest reduction along the coastline (Fig. 11c). For TADV, with the approaching of typhoon Utor, the contributions of TADV particularly decrease by 0–20 ppb h−1, especially in
the SCR (Fig. 11d).
In all, during this high-level O3 pollution episode, more
active photochemical reactions and the vertical diffusion play a significant role in the accumulation of surface O3over the
YRD region. The major driving factor should be the west-ern Pacific subtropical high. Moreover, the changes in the contributions of VDIF, CHEM, DDEP and TADV between 7–9 and 10–12 August exhibit a similar spatial pattern with the high values mostly concentrating in the southeast coastal areas (Fig. 12), implying the Typhoon Utor also plays a col-laborative effect.
5 Conclusions
In this study, the characteristics and the essential impact fac-tors of a typical regional continuous O3 pollution over the
YRD region are investigated by means of observational anal-ysis and numerical simulation. The episode lasted for nearly a week from 7 to 12 August 2013, with the O3concentration
exceeding the national air quality standard in more than half of the cities over the YRD region. The analysis of weather systems and the modeling results from WRF/CMAQ all il-lustrate that the continuous strong western Pacific subtropical high is the leading factor of the abnormally high temperature weather and the heavy O3pollution by inducing more sinking
air to trap heat as well as air pollutants at the surface. Mean-while, the development of this episode is closely related to the movement of Typhoon Utor as well. The temporal vari-ations of the vertical wind velocity and O3 concentrations
show that when the YRD region is at the front of moving typhoon system, the downward airflow is enhanced in the boundary layer with fine weather, and thereby the air pol-lutants are trapped and accumulated near the surface. More-over, in the last stage of the O3episode, the activity of
of Typhoon Utor contributes to the mitigation of the O3
pol-lution.
The IPR analysis implemented in CMAQ is specially car-ried out to quantify the relative contributions of individual processes and give a fundamental explanation. During the high-level O3episode from 7 to 12 August, the VDIF and
the CHEM exhibit significant positive contributions to sur-face O3 over the YRD region, with the high values over
20 ppb h−1 for VDIF and over 10 ppb h−1for CHEM. The
DDEP is the major sink of surface O3, while the TADV can
give the positive contribution on land and the negative con-tribution on the water. Moreover, on 10–12 August, the YRD region is apparently affected by the periphery circulation of Typhoon Utor, with the contributions of VDIF over the YRD region increasing by 0–15 ppb h−1, the contributions
of CHEM increasing by 0–5 ppb h−1and the contributions of DDEP and TADV decreasing. Especially in the coastal cities, such as Shanghai and Hangzhou, the effects of the typhoon system are more obvious. In contrast, the cities in the north-west inland area of the YRD region, which are far away from the sea, can hardly be affected by the typhoon system. In the end, when the typhoon system significantly weakens the high pressure system, the contributions of VDIF, CHEM, TADV and DDEP decrease to a low level in all cities.
The WRF/CMAQ modeling system shows a relatively good performance in simulation of the O3episode, with the
simulated meteorological conditions and air pollutant con-centrations basically in agreement with the observations in most YRD cities. Our results in this study can provide an in-sight for the formation mechanism of regional O3pollution
in East Asia and help to forecast the O3pollution
synthet-ically impacted by the western Pacific subtropical high and the tropical cyclone system.
6 Data availability
The air quality monitoring records are available at http://106. 37.208.233:20035. The weather charts are accessible at http: //www.kma.go.kr/chn/weather/images/analysischart.jsp. The meteorological data are available at http://weather.uwyo.edu/ wyoming/.
Acknowledgements. This study was supported by the National Natural Science Foundation of China (41475122, 91544230, 41575145, 41621005), the National Special Fund for Environmen-tal Protection Research in the Public Interest (201409008) and EU 7th Framework Marie Curie Actions IRSES project REQUA (PIRSES-GA-2013-612671). The authors would like to thank Hongli Wang from Shanghai Academy of Environmental Sciences for providing VOCs observation data, Xiaoxun Xie for preliminary data processing and the anonymous reviewers for their constructive and precious comments on this paper.
Edited by: J. Chen
Reviewed by: three anonymous referees
References
An, X., Zhu, T., Wang, Z., Li, C., and Wang, Y.: A modeling anal-ysis of a heavy air pollution episode occurred in Beijing, At-mos. Chem. Phys., 7, 3103–3114, doi:10.5194/acp-7-3103-2007, 2007.
Byun, D. and Schere, K. L.: Review of the governing equations, computational algorithms, and other components of the models-3 Community Multiscale Air Quality (CMAQ) modeling system, Appl. Mech. Rev., 59, 51–77, doi:10.1115/1.2128636, 2006. Chan, C. K. and Yao, X.: Air pollution in mega cities in China,
Atmos. Environ., 42, 1–42, doi:10.1016/j.atmosenv.2007.09.003, 2008.
Chen, D., Zhou, B., Beirle, S., Chen, L. M., and Wagner, T.: Tropospheric NO2 column densities deduced from zenith-sky
DOAS measurements in Shanghai, China, and their applica-tion to satellite validaapplica-tion, Atmos. Chem. Phys., 9, 3641–3662, doi:10.5194/acp-9-3641-2009, 2009.
Chen, F. and Dudhia, J.: Coupling an advanced land surface-hydrology model with the Penn State-NCAR MM5 mod-eling system, Part I: Model implementation and sensitiv-ity, Mon. Weather Rev., 129, 569–585, doi:10.1175/1520-0493(2001)129<0569:Caalsh>2.0.Co;2, 2001.
Cheng, W. L., Lai, L. W., Den, W., Wu, M. T., Hsueh, C. A., Lin, P. L., Pai, C. L., and Yan, Y. L.: The relationship between ty-phoons’ peripheral circulation and ground-level ozone concen-trations in central Taiwan, Environ. Monit. Assess., 186, 791– 804, doi:10.1007/s10661-013-3417-7, 2014.
Chiqueto, J. and Silva, M. E. S.: São Paulo “Surface Ozone Layer” and the atmosphere: characteristics of tropospheric ozone con-centrations in the city and how the atmosphere influences them, VDM Verlag Dr. Muller, Saarbrücken, 2010.
Crutzen, P.: A discussion of the chemistry of some minor con-stituents in the stratosphere and troposphere, Pure Appl. Geo-phys., 106, 1385–1399, 1973.
Ding, A. J., Fu, C. B., Yang, X. Q., Sun, J. N., Zheng, L. F., Xie, Y. N., Herrmann, E., Nie, W., Petäjä, T., Kerminen, V.-M., and Kulmala, M.: Ozone and fine particle in the western Yangtze River Delta: an overview of 1 yr data at the SORPES station, Atmos. Chem. Phys., 13, 5813–5830, doi:10.5194/acp-13-5813-2013, 2013.
Duan, J. C., Tan, J. H., Yang, L., Wu, S., and Hao, J. M.: Concen-tration, sources and ozone formation potential of volatile organic compounds (VOCs) during ozone episode in Beijing, Atmos. Res., 88, 25–35, doi:10.1016/j.atmosres.2007.09.004, 2008. Emmons, L. K., Walters, S., Hess, P. G., Lamarque, J.-F., Pfister,
G. G., Fillmore, D., Granier, C., Guenther, A., Kinnison, D., Laepple, T., Orlando, J., Tie, X., Tyndall, G., Wiedinmyer, C., Baughcum, S. L., and Kloster, S.: Description and evaluation of the Model for Ozone and Related chemical Tracers, version 4 (MOZART-4), Geosci. Model Dev., 3, 43–67, doi:10.5194/gmd-3-43-2010, 2010.
Fann, N. and Risley, D.: The public health context for PM2.5
and ozone air quality trends, Air Qual. Atmos. Hlth., 6, 1–11, doi:10.1007/s11869-010-0125-0, 2013.
Foley, K. M., Roselle, S. J., Appel, K. W., Bhave, P. V., Pleim, J. E., Otte, T. L., Mathur, R., Sarwar, G., Young, J. O., Gilliam, R. C., Nolte, C. G., Kelly, J. T., Gilliland, A. B., and Bash, J. O.: Incremental testing of the Community Multiscale Air Quality (CMAQ) modeling system version 4.7, Geosci. Model Dev., 3, 205–226, doi:10.5194/gmd-3-205-2010, 2010.
Gao, J. H., Bin, Z., Xiao, H., Kang, H. Q., Hou, X. W., and Shao, P.: A case study of surface ozone source apportionment during a high concentration episode, under frequent shifting wind con-ditions over the Yangtze River Delta, China, Sci. Total Environ., 544, 853–863, doi:10.1016/j.scitotenv.2015.12.039, 2016. Geng, F. H., Tie, X. X., Xu, J. M., Zhou, G. Q., Peng, L., Gao, W.,
Tang, X., and Zhao, C. S.: Characterizations of ozone, NOx, and
VOCs measured in Shanghai, China, Atmos. Environ., 42, 6873– 6883, doi:10.1016/j.atmosenv.2008.05.045, 2008.
Gonçalves, M., Jiménez-Guerrero, P., and Baldasano, J. M.: Con-tribution of atmospheric processes affecting the dynamics of air pollution in South-Western Europe during a typical summer-time photochemical episode, Atmos. Chem. Phys., 9, 849–864, doi:10.5194/acp-9-849-2009, 2009.
Grell, G. A. and Devenyi, D.: A generalized approach to pa-rameterizing convection combining ensemble and data as-similation techniques, Geophys. Res. Lett., 29, 169310, doi:10.1029/2002GL015311, 2002.
Guo, H., Jiang, F., Cheng, H. R., Simpson, I. J., Wang, X. M., Ding, A. J., Wang, T. J., Saunders, S. M., Wang, T., Lam, S. H. M., Blake, D. R., Zhang, Y. L., and Xie, M.: Concurrent observa-tions of air pollutants at two sites in the Pearl River Delta and the implication of regional transport, Atmos. Chem. Phys., 9, 7343– 7360, doi:10.5194/acp-9-7343-2009, 2009.
Han, S. Q., Bian, H., Feng, Y. C., Liu, A. X., Li, X. J., Zeng, F., and Zhang, X. L.: Analysis of the Relationship between O3, NO
and NO2in Tianjin, China, Aerosol Air Qual. Res., 11, 128–139, doi:10.4209/aaqr.2010.07.0055, 2011.
Hong, S. Y., Dudhia, J., and Chen, S. H.: A revised approach to ice microphysical processes for the bulk parameterization of clouds and precipitation, Mon. Weather Rev, 132, 103– 120, doi:10.1175/1520-0493(2004)132<0103:Aratim>2.0.Co;2, 2004.
Hong, S. Y., Noh, Y., and Dudhia, J.: A new vertical diffusion pack-age with an explicit treatment of entrainment processes, Mon. Weather Rev., 134, 2318–2341, doi:10.1175/Mwr3199.1, 2006. Huang, J. P., Fung, J. C. H., Lau, A. K. H., and Qin, Y.:
Numer-ical simulation and process analysis of typhoon-related ozone episodes in Hong Kong, J. Geophys. Res.-Atmos., 110, D05301, doi:10.1029/2004jd004914, 2005.
Huang, J. P., Fung, J. C. H., and Lau, A. K. H.: Integrated pro-cesses analysis and systematic meteorological classification of ozone episodes in Hong Kong, J. Geophys. Res.-Atmos., 111, D20309, doi:10.1029/2005jd007012, 2006.
Hung, C. H. and Lo, K. C.: Relationships between Ambient Ozone Concentration Changes in Southwestern Taiwan and Invasion Tracks of Tropical Typhoons, Adv. Meteorol., 2015, 402976, doi:10.1155/2015/402976, 2015.
Jenkin, M. E. and Clemitshaw, K. C.: Ozone and other secondary photochemical pollutants: chemical processes governing their formation in the planetary boundary layer, Atmos. Environ., 34, 2499–2527, doi:10.1016/S1352-2310(99)00478-1, 2000.
Jiang, F., Wang, T. J., Wang, T. T., Xie, M., and Zhao, H.: Numeri-cal modeling of a continuous photochemiNumeri-cal pollution episode in Hong Kong using WRF-chem, Atmos. Environ., 42, 8717–8727, doi:10.1016/j.atmosenv.2008.08.034, 2008.
Jiang, F., Zhou, P., Liu, Q., Wang, T. J., Zhuang, B. L., and Wang, X. Y.: Modeling tropospheric ozone formation over East China in springtime, J. Atmos. Chem., 69, 303–319, doi:10.1007/s10874-012-9244-3, 2012.
Kim, H. J. and Wang, B.: Sensitivity of the WRF Model Simulation of the East Asian Summer Monsoon in 1993 to Shortwave Radi-ation Schemes and Ozone Absorption, Asia-Pac. J. Atmos. Sci., 47, 167–180, doi:10.1007/s13143-011-0006-y, 2011.
Lam, K. S., Wang, T. J., Wu, C. L., and Li, Y. S.: Study on an ozone episode in hot season in Hong Kong and transboundary air pol-lution over Pearl River Delta region of China, Atmos. Environ., 39, 1967–1977, doi:10.1016/j.atmosenv.2004.11.023, 2005. Landry, J. S., Neilson, E. T., Kurz, W. A., and Percy, K. E.: The
impact of tropospheric ozone on landscape-level merchantable biomass and ecosystem carbon in Canadian forests, Eur. J. Forest Res., 132, 71–81, doi:10.1007/s10342-012-0656-z, 2013. Li, L., Chen, C. H., Huang, C., Huang, H. Y., Zhang, G. F., Wang,
Y. J., Chen, M. H., Wang, H. L., Chen, Y. R., Streets, D. G., and Fu, J. M.: Ozone sensitivity analysis with the MM5-CMAQ modeling system for Shanghai, J. Environ. Sci.-China, 23, 1150– 1157, doi:10.1016/S1001-0742(10)60527-X, 2011.
Li, L., Chen, C. H., Huang, C., Huang, H. Y., Zhang, G. F., Wang, Y. J., Wang, H. L., Lou, S. R., Qiao, L. P., Zhou, M., Chen, M. H., Chen, Y. R., Streets, D. G., Fu, J. S., and Jang, C. J.: Process analysis of regional ozone formation over the Yangtze River Delta, China using the Community Multi-scale Air Qual-ity modeling system, Atmos. Chem. Phys., 12, 10971–10987, doi:10.5194/acp-12-10971-2012, 2012.
Li, M. M., Song, Y., Huang, X., Li, J. F., Mao, Y., Zhu, T., Cai, X. H., and Liu, B.: Improving mesoscale modeling us-ing satellite-derived land surface parameters in the Pearl River Delta region, China, J. Geophys. Res.-Atmos., 119, 6325–6346, doi:10.1002/2014JD021871, 2014.
Li, M. M., Song, Y., Mao, Z. C., Liu, M. X., and Huang, X.: Impacts of thermal circulations induced by urbanization on ozone forma-tion in the Pearl River Delta region, China, Atmos. Environ., 127, 382–392, doi:10.1016/j.atmosenv.2015.10.075, 2016.
Liao, J. B., Wang, T. J., Wang, X. M., Xie, M., Jiang, Z. Q., Huang, X. X., and Zhu, J. L.: Impacts of different urban canopy schemes in WRF/Chem on regional climate and air quality in Yangtze River Delta, China, Atmos. Res., 145, 226–243, doi:10.1016/j.atmosres.2014.04.005, 2014.
Liao, J. B., Wang, T. J., Jiang, Z. Q., Zhuang, B. L., Xie, M., Yin, C. Q., Wang, X. M., Zhu, J. L., Fu, Y., and Zhang, Y.: WRF/Chem modeling of the impacts of urban expansion on regional climate and air pollutants in Yangtze River Delta, China, Atmos. Envi-ron., 106, 204–214, doi:10.1016/j.atmosenv.2015.01.059, 2015. Liu, Q., Lam, K. S., Jiang, F., Wang, T. J., Xie, M., Zhuang, B.
L., and Jiang, X. Y.: A numerical study of the impact of cli-mate and emission changes on surface ozone over South China in autumn time in 2000–2050, Atmos. Environ., 76, 227–237, doi:10.1016/j.atmosenv.2013.01.030, 2013.