This work is licensed under a Creative Commons Attribution 4.0 International License.
Croat. Chem. Acta2016, 89(1), 17–24 Published online: June 1, 2016
DOI: 10.5562/cca2733
QSAR Study on Caffeine Derivatives Docked on
Poly(A)RNA Polymerase Protein Cid1
Teodora E. Harsa,1,* Alexandra M. Harsa,1 Beata Szefler,2 Mircea V. Diudea1
1 Faculty of Chemistry and Chemical Engineering, Babes-Bolyai University, 400028 Cluj, Romania
2 Department of Physical Chemistry, Collegium Medicum, Nicolaus Copernicus University, Kurpińskiego 5, 85-950, Bydgoszcz, Poland
* Corresponding author’s e-mail address: harsa.teodoraelena@yahoo.com
RECEIVED: September 7, 2015 REVISED: November 17, 2015 ACCEPTED: December 7, 2015
Abstract: Caffeine is the most commonly ingested alkylxantine and is recognized as a psycho-stimulant. It improves some aspects of cognitive performance, however it reduces the cerebral blood flow both in animals and humans. In this paper a QSAR study on caffeine derivatives, docked on the Poly(A)RNA polymerase protein cid1, is reported. A set of forty caffeine derivatives, downloaded from PubChem, was modeled, within the hypermolecule strategy; the predicted activity was LD50 and prediction was done on similarity clusters with the leaders chosen as the best docked ligands on the Poly(A)RNA polymerase protein cid1. It was concluded that LD50 of the studied caffeines is not influenced by their binding to the target protein.
Keywords: caffeine, AUTODOCK Vina, binding affinity, docking, poly(A)RNA polymerase protein cid1.
INTRODUCTION
AFFEINE (1,3,7-trimethylxanthine) is found in vary quantities in some plants: coffee beans, tea leaves, co-coa beans etc.[1–3] Caffeine selectively reverts the inhibitory effect of adenosine.[4] There are evidences that caffeine might cause an increase in hypoxic pulmonary vasocon-striction but improbably it contributes to the development of high altitude pulmonary edema.[5,6]
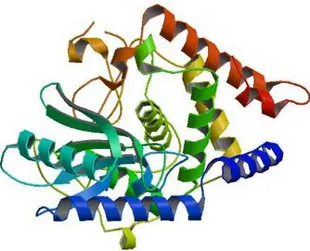
Structure of Poly(A) RNA polymerase protein cid1 (see Figure 1) revealed that caffeine can be accommodated at the active site, the binding difference within different de-rivatives suggesting how this enzyme selects UTP (pyrimi-dine nucleoside triphosphate) over other nucleotides.[7]
Molecular docking has become a standard tool in computational chemistry for predicting the binding affinity and orientation of small molecule ligands to protein targets in order to predict the activity of ligands.[8]
In a previous work,[9] we have performed a QSAR study on a set of flavonoids, by the similarity cluster predic-tion approach, proposed by TOPO Group Cluj.[10] In this pa-per we continue the investigation with a docking study to identify the geometric description of a pharmacophore in
the interaction of this class of ligands with Poly(A) RNA pol-ymerase protein cid1.[11]
Quantitative structure–activity relationship (QSAR) searches relate the molecular structure information to biological and other activities by developing a quantitative model. Because of their great number and positive biological effects, caffeine is a popular subject for QSAR.
In this study, clusters of similar structures (aimed to be quasi-congeneric subsets, in a better prediction of the toxicological activity) were chosen, with the leaders the best scored in the docking on the target protein cid1.
MOLECULAR DATA
Molecular docking was carried out by using AutoDock Vina docking software,[12–14] in order to explore the binding mode of caffeine derivatives (Table 1) at the binding pocket of Poly(A) RNA polymerase protein cid1 and to understand their structure-activity relationship. The protein Poly(A) RNA polymerase protein cid1 (Figure 1) was downloaded from RCSB protein data bank, bearing the PDB code-4FH3.[15]
Croat. Chem. Acta2016, 89(1), 17–24 DOI: 10.5562/cca2733 A set of 40 Caffeine derivatives were taken from
Pub-Chem Database (in Smiles code, Table 1). The three dimen-sional structure of the caffeine was downloaded in sdf format using Pubchem[16] and converted to PDB format us-ing OpenBabel 2.3.2[17] for further use in docking studies. For targeting protein 4FH3 interactions, the critical binding motifs were replaced by caffeine derivative ligands. The lig-ands, with their molar mass, molecular formula, and num-ber of torsions are given in Table 2.
COMPUTATIONAL DETAILS
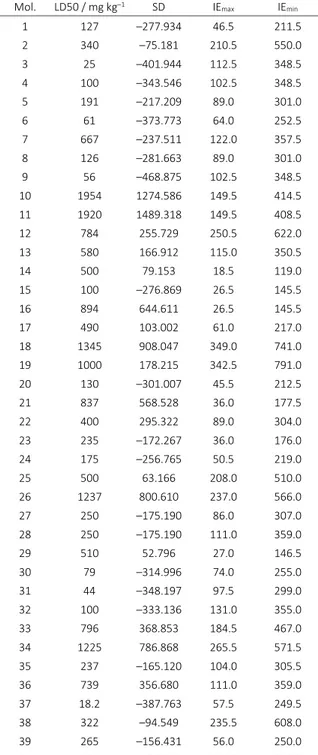
In the present study, a molecular docking analysis has been performed on 40 caffeine derivatives on the Poly(A) RNA polymerase protein cid1; a further QSAR study was done to predict their LD50. The structures have been optimized at HF (6-2g(p)) level of theory, in gas phase, by Gaussian 09. [18] Topological indices have been computed by TOPOCLUJ software;[19] some of them (Cluj indices: IEmax and IEmin, SD) and LD50 (on mouse, oral route ad-ministered) are listed in Table 3 with the highest cor-relation QSAR model.
RESULTS AND DISCUSSION
Docking at Poly(A) RNA Polymerase
Protein Cid1
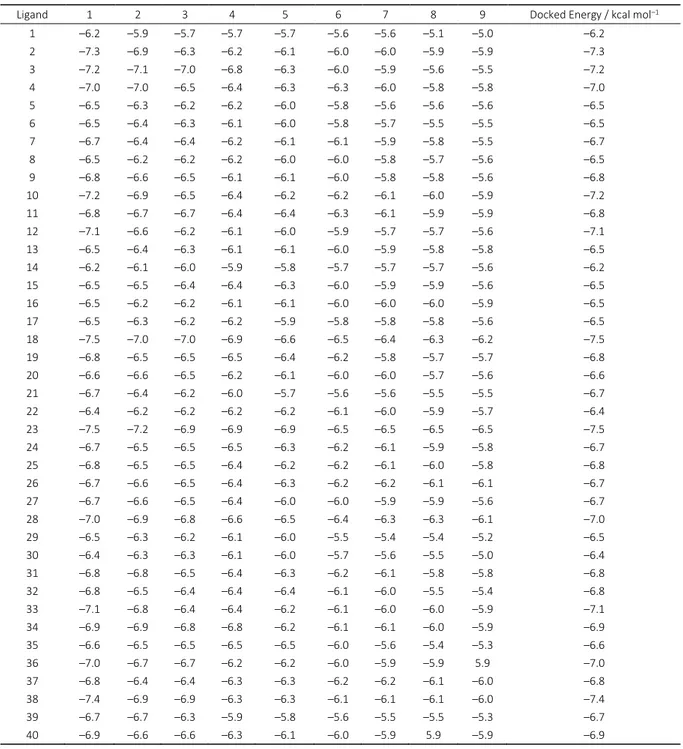
To study the interaction between caffeine derivatives and 4FH3, AutoDock Vina, a molecular modeling program, was run; data were collected in Table 4. Interaction ligand-pro-tein is illustrated in Figures 2 and 3. A grid box size of x = – 13.133 Å, y = 2.669 Å, z = –10.786 Å was generated and allo-cated at the center of the receptor binding site.
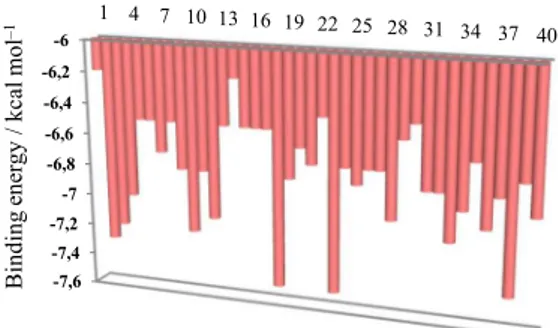
The binding energy ranges between –7.5 kcal/mol (lowest) and –6.2 kcal/mol (highest), see Figure 4.
To obtain a pharmacophore model that fits at the re-ceptor Poly(A) RNA polymerase protein cid1, conformers with the most favorable interactions with the receptor re-sulting from docking, were chosen. Ligands 2, 18, 23 and 38 have the lowest binding energy between –7.5 and –7.3; based on these compounds we constructed the pharmaco-phore (by using HyperChem7.52[20] and PyMOL[21] software programs). The resulting pharmacophore is shown in Figure 5. Figure 1. Poly(A) RNA polymerase protein cid1.
Table 1. Caffeine derivatives molecular structure, in SMILES code (taken from PubChem)
Canonical SMILES 1 CN1C=NC2=C1C(=O)N(C(=O)N2C)C 2 CCCCC1=NC2=C(N1)C(=O)N(C(=O)N2CC(C)C)C 3 CC1=NC2=C(N1)C(=O)N(C(=O)N2CC(C)C)C 4 CC=CC1=NC2=C(N1C)C(=O)N(C(=O)N2C)C 5 CN1C=NC2=C1C(=O)N(C(=O)N2C)CC=C 6 CCN1C(=O)C2=C(N=CN2C)N(C1=O)C 7 CC=CCN1C(=O)C2=C(N=CN2C)N(C1=O)C 8 CCCN1C(=O)C2=C(N=CN2C)N(C1=O)C 9 CCOC1=NC2=C(N1C)C(=O)N(C(=O)N2C)C 10 CN1C=NC2=C1C(=O)N(C(=O)N2C)CC(CO)O 11 CN1C=NC2=C1C(=O)N(C(=O)N2C)CC(CO)O 12 CC(C)CN1C2=C(C(=O)N(C1=O)C)N(C=N2)CC(CO)O 13 CC(CN1C(=O)C2=C(N=CN2C)N(C1=O)C)O
14 C1=NC2=C(N1)C(=O)NC(=O)N2
15 C1=NC2=C(N1)C(=O)NC(=O)N2O
16 CN1C2=C(C(=O)NC1=O)NC=N2
17 C1=NC2=C(N1)C(=O)NC(=O)N2CCO 18 CCCN1C(=O)C2=C(N=CN2CCCCC(C)O)N(C1=O)C 19 CCCCN1C2=C(C(=O)N(C1=O)CCCC)N(C=N2)CC(=O)C 20 CC1=NC2=C(N1)C(=O)N(C(=O)N2C)C
21 CN1C=NC2=C1C(=O)NC(=O)N2C
22 CN1C2=C(C(=O)N(C1=O)C)N(C=N2)CCO 23 CN1C2=C(C(=O)N(C1=O)C)NC=N2 24 CCC1=NC2=C(N1)C(=O)N(C(=O)N2C)C 25 CCCCCCC1=NC2=C(N1)C(=O)N(C(=O)N2C)C 26 CCN(CC)CCN1C=NC2=C1C(=O)N(C(=O)N2C)C 27 CCCC1=NC2=C(N1)C(=O)N(C(=O)N2C)C 28 CC(C)CC1=NC2=C(N1)C(=O)N(C(=O)N2C)C
29 CN1C(=O)C2=C(NC1=O)N=CN2
DOI: 10.5562/cca2733 Croat. Chem. Acta2016, 89(1), 17–24 It contains three pharmacophore centers:
Nucleophilic site of the substituted imidazole nitro-gen atom
Strong nucleophilic site of carbonyl groups Nitrogen atom substituted by an isobutyl group
QSAR STUDY
This study was performed following Diudea’s algorithm:[22] an alignment of molecules over a hypermolecule[25] is per-formed and described by correlation weighted local de-scriptors (e.g. fragment mass, partial charges, etc.) coupled Table 2. Caffeine ligands with their molecular formula, molar weight, hydrogen bond acceptors, hydrogen bond donors, torsions and the energy of HOMO (in au)
Ligand Molecular Formula Molar Weight / g mol–1 H-Bond Donor H-Bond Acceptor (No. of rotatable bonds) Torsions HOMO / (au)
1 C8H10N4O2 194.19 0 3 0 –0.315
2 C14H22N4O2 278.35 1 3 5 –0.310
3 C11H16N4O2 236.27 1 3 2 –0.312
4 C11H14N4O2 234.25 0 3 2 –0.307
5 C10H12N4O2 220.23 0 3 2 –0.315
6 C9H12N4O2 208.22 0 3 1 –0.315
7 C11H14N4O2 234.25 0 3 2 –0.314
8 C10H14N4O2 222.24 0 3 2 –0.315
9 C10H14N4O3 238.24 0 4 2 –0.301
10 C10H14N4O4 254.24 2 5 5 –0.311
11 C10H14N4O4 254.24 2 5 5 –0.310
12 C13H20N4O4 296.32 2 5 7 –0.310
13 C10H14N4O3 238.24 1 4 3 –0.311
14 C5H4N4O2 152.11 3 3 0 –0.333
15 C5H4N4O3 168.11 3 4 1 –0.334
16 C6H6N4O2 166.13 2 3 0 –0.325
17 C7H8N4O3 196.16 3 4 3 –0.327
18 C15H24N4O3 308.38 1 4 8 –0.311
19 C16H24N4O3 320.39 0 4 8 –0.314
20 C8H10N4O2 194.19 1 3 0 –0.309
21 C7H8N4O2 180.16 1 3 0 –0.319
22 C9H12N4O3 224.22 1 4 3 –0.319
23 C7H8N4O2 180.16 1 3 6 –0.320
24 C9H12N4O2 208.22 1 3 1 –0.312
25 C13H20N4O2 264.32 1 3 5 –0.311
26 C13H21N5O2 279.34 1 4 5 –0.312
27 C10H14N4O2 222.24 1 3 2 –0.312
28 C11H16N4O2 236.27 1 3 2 –0.311
29 C6H6N4O2 166.14 2 3 0 –0.329
30 C9H12N4O2 208.22 1 3 2 –0.319
31 C10H14N4O2 222.24 1 3 2 –0.319
32 C9H12N4O2 208.22 0 3 0 –0.308
33 C13H20N4O2 264.32 1 3 4 –0.319
34 C13H18N4O3 278.31 0 4 5 –0.316
35 C10H14N4O2 222.24 1 3 3 –0.319
36 C10H14N4O3 238.24 1 4 3 –0.315
37 C9H12N4O4 240.21 3 5 5 –0.321
38 C15H24N4O2 292.38 1 3 5 –0.311
39 C9H12N4O2 208.22 0 4 0 –0.298
Croat. Chem. Acta2016, 89(1), 17–24 DOI: 10.5562/cca2733 with a predictive validation of the model within similarity
clusters[23] performed for each molecule in the test set.
Data Set
A set of 40 molecular structures, belonging to the class of caffeine, have been downloaded from the Pubchem
database (Table 1), together with their LD50. The set was split into the training set (25 molecules) and test set (15 molecules, taken with the lowest docking energy).
A hypermolecule (Figure 6) was built up as the reunion of all structural features in the 40 molecules under study. Hy-permolecule works like a biological receptor, over which the ligands (i.e. caffeines) are aligned. Thus, according to this fit-ting, binary vectors were constructed, with 1 when for a given position of the hypermolecule exists an atom in the current molecule, and zero, otherwise. In the above binary vectors, the values 1 are next replaced by local characteristics: partial charges, mass fragments or local topological descriptors. We used here partial charges in building the weighted vector for every molecule; the modeled property was LD50.
Data Reduction
Before starting to build the models, the descriptors with a variance lower than 10 % and intercorrelation larger than 0.80 have been discarded. With the reduced number of desriptors, a correlation over all the positions in the hypermolecule was performed; the correlating coefficients of the statistically significant positions in the Table 3. LD50 and topological indices computed for the
caffeines in Table 1
Mol. LD50 / mg kg–1 SD IEmax IEmin
1 127 –277.934 46.5 211.5
2 340 –75.181 210.5 550.0
3 25 –401.944 112.5 348.5
4 100 –343.546 102.5 348.5
5 191 –217.209 89.0 301.0
6 61 –373.773 64.0 252.5
7 667 –237.511 122.0 357.5
8 126 –281.663 89.0 301.0
9 56 –468.875 102.5 348.5
10 1954 1274.586 149.5 414.5
11 1920 1489.318 149.5 408.5
12 784 255.729 250.5 622.0
13 580 166.912 115.0 350.5
14 500 79.153 18.5 119.0
15 100 –276.869 26.5 145.5
16 894 644.611 26.5 145.5
17 490 103.002 61.0 217.0
18 1345 908.047 349.0 741.0
19 1000 178.215 342.5 791.0
20 130 –301.007 45.5 212.5
21 837 568.528 36.0 177.5
22 400 295.322 89.0 304.0
23 235 –172.267 36.0 176.0
24 175 –256.765 50.5 219.0
25 500 63.166 208.0 510.0
26 1237 800.610 237.0 566.0
27 250 –175.190 86.0 307.0
28 250 –175.190 111.0 359.0
29 510 52.796 27.0 146.5
30 79 –314.996 74.0 255.0
31 44 –348.197 97.5 299.0
32 100 –333.136 131.0 355.0
33 796 368.853 184.5 467.0
34 1225 786.868 265.5 571.5
35 237 –165.120 104.0 305.5
36 739 356.680 111.0 359.0
37 18.2 –387.763 57.5 249.5
38 322 –94.549 235.5 608.0
39 265 –156.431 56.0 250.0
40 250 –175.190 118.0 366.0
Figure 2. Active site analysis by Ligand Explorer.
DOI: 10.5562/cca2733 Croat. Chem. Acta2016, 89(1), 17–24 hypermolecule were used to weight the local descriptors,
actually the partial charges (computed at HF level of theory), thus resulting new weighted vectors CDij. Next,
these new descriptors are summed to give a global descriptor, SDi
jCDij. This new descriptor is a linearcombination of the local correlating descriptors for the significant positions in the hypermolecule (e.g.). It correlates with LD50 as shown further.
QSAR Models
The models were performed on the training set (25 struc-tures in Table 1) and the best results that make best predic-tions in validation sets (in decreasing order of R2) are listed below and in Table 5, test set has been chosen the one with the lowest docking energies.[24]
(i) Monovariate regression LD50 = 432.249 + 0.934 × SD
Table 4. The final Lamarckian genetic algorithm docked state – Binding energy of ligands with the active site of the protein during nine conformations
Ligand 1 2 3 4 5 6 7 8 9 Docked Energy / kcal mol–1
1 –6.2 –5.9 –5.7 –5.7 –5.7 –5.6 –5.6 –5.1 –5.0 –6.2
2 –7.3 –6.9 –6.3 –6.2 –6.1 –6.0 –6.0 –5.9 –5.9 –7.3
3 –7.2 –7.1 –7.0 –6.8 –6.3 –6.0 –5.9 –5.6 –5.5 –7.2
4 –7.0 –7.0 –6.5 –6.4 –6.3 –6.3 –6.0 –5.8 –5.8 –7.0
5 –6.5 –6.3 –6.2 –6.2 –6.0 –5.8 –5.6 –5.6 –5.6 –6.5
6 –6.5 –6.4 –6.3 –6.1 –6.0 –5.8 –5.7 –5.5 –5.5 –6.5
7 –6.7 –6.4 –6.4 –6.2 –6.1 –6.1 –5.9 –5.8 –5.5 –6.7
8 –6.5 –6.2 –6.2 –6.2 –6.0 –6.0 –5.8 –5.7 –5.6 –6.5
9 –6.8 –6.6 –6.5 –6.1 –6.1 –6.0 –5.8 –5.8 –5.6 –6.8
10 –7.2 –6.9 –6.5 –6.4 –6.2 –6.2 –6.1 –6.0 –5.9 –7.2
11 –6.8 –6.7 –6.7 –6.4 –6.4 –6.3 –6.1 –5.9 –5.9 –6.8
12 –7.1 –6.6 –6.2 –6.1 –6.0 –5.9 –5.7 –5.7 –5.6 –7.1
13 –6.5 –6.4 –6.3 –6.1 –6.1 –6.0 –5.9 –5.8 –5.8 –6.5
14 –6.2 –6.1 –6.0 –5.9 –5.8 –5.7 –5.7 –5.7 –5.6 –6.2
15 –6.5 –6.5 –6.4 –6.4 –6.3 –6.0 –5.9 –5.9 –5.6 –6.5
16 –6.5 –6.2 –6.2 –6.1 –6.1 –6.0 –6.0 –6.0 –5.9 –6.5
17 –6.5 –6.3 –6.2 –6.2 –5.9 –5.8 –5.8 –5.8 –5.6 –6.5
18 –7.5 –7.0 –7.0 –6.9 –6.6 –6.5 –6.4 –6.3 –6.2 –7.5
19 –6.8 –6.5 –6.5 –6.5 –6.4 –6.2 –5.8 –5.7 –5.7 –6.8
20 –6.6 –6.6 –6.5 –6.2 –6.1 –6.0 –6.0 –5.7 –5.6 –6.6
21 –6.7 –6.4 –6.2 –6.0 –5.7 –5.6 –5.6 –5.5 –5.5 –6.7
22 –6.4 –6.2 –6.2 –6.2 –6.2 –6.1 –6.0 –5.9 –5.7 –6.4
23 –7.5 –7.2 –6.9 –6.9 –6.9 –6.5 –6.5 –6.5 –6.5 –7.5
24 –6.7 –6.5 –6.5 –6.5 –6.3 –6.2 –6.1 –5.9 –5.8 –6.7
25 –6.8 –6.5 –6.5 –6.4 –6.2 –6.2 –6.1 –6.0 –5.8 –6.8
26 –6.7 –6.6 –6.5 –6.4 –6.3 –6.2 –6.2 –6.1 –6.1 –6.7
27 –6.7 –6.6 –6.5 –6.4 –6.0 –6.0 –5.9 –5.9 –5.6 –6.7
28 –7.0 –6.9 –6.8 –6.6 –6.5 –6.4 –6.3 –6.3 –6.1 –7.0
29 –6.5 –6.3 –6.2 –6.1 –6.0 –5.5 –5.4 –5.4 –5.2 –6.5
30 –6.4 –6.3 –6.3 –6.1 –6.0 –5.7 –5.6 –5.5 –5.0 –6.4
31 –6.8 –6.8 –6.5 –6.4 –6.3 –6.2 –6.1 –5.8 –5.8 –6.8
32 –6.8 –6.5 –6.4 –6.4 –6.4 –6.1 –6.0 –5.5 –5.4 –6.8
33 –7.1 –6.8 –6.4 –6.4 –6.2 –6.1 –6.0 –6.0 –5.9 –7.1
34 –6.9 –6.9 –6.8 –6.8 –6.2 –6.1 –6.1 –6.0 –5.9 –6.9
35 –6.6 –6.5 –6.5 –6.5 –6.5 –6.0 –5.6 –5.4 –5.3 –6.6
36 –7.0 –6.7 –6.7 –6.2 –6.2 –6.0 –5.9 –5.9 5.9 –7.0
37 –6.8 –6.4 –6.4 –6.3 –6.3 –6.2 –6.2 –6.1 –6.0 –6.8
38 –7.4 –6.9 –6.9 –6.3 –6.3 –6.1 –6.1 –6.1 –6.0 –7.4
39 –6.7 –6.7 –6.3 –5.9 –5.8 –5.6 –5.5 –5.5 –5.3 –6.7
Croat. Chem. Acta2016, 89(1), 17–24 DOI: 10.5562/cca2733 (ii) Bivariate regression
LD50 = 308.206 + 0.872 × SD +1.385 × IEmax (iii) Three-variate regression
LD50 = 411.8272+ 0.856 × SD+ 3.339 × IEmax–0.956 × IEmin
Model Validation (a) Leave-one-out
The performances in leave-one-out analysis related to the models listed as the best in Table 5 are presented in Table 6.[25]
(b) External Validation
The values LD50 for the test set of caffeine were calculated by using entry 11 in Table 5. Data are listed in Table 7 and the monovariate correlation: LD50 = 0.918 × LD50calc. + 129.9; n = 15; R2 = 0.929; s = 153.272; F = 169.735 is plotted in Figure 7.
(c) Similarity Cluster Validation
Validation can also be performed by using clusters of simi-larity: each of the 15 molecules in the test set (chosen as the best scored in the docking set) is the leader of its own cluster, selected by 2D similarity among the 20 structures of the learning set (each cluster comprising about 14–17 molecules). The values LD50 for the test set of caffeine were calculated by using the learning equations (with the same descriptors as in entry 11, Table 5) from each of the 15 clusters. Data are listed in Table 8 and the monovariate
Table 5. The best models in LD50 in the training set of caffeine in Table 1
Descriptors R2 Adjust.
R2 Error St. F
1 SD 0.891 0.886 153.231 187.816
2 Adj 0.129 0.091 432.908 3.412
3 C 0.122 0.083 434.798 3.183
4 IEmax 0.221 0.187 409.442 6.526
5 SD, IEmax 0.934 0.928 121.562 156.484
6 SD, De 0.932 0.926 123.459 151.375 7 SD, C 0.931 0.925 124.451 148.799 8 SD, D3D 0.931 0.925 124.084 149.746 9 SD, Adj 0.925 0.918 129.761 135.988 10 SD, HOMO 0.896 0.887 152.586 95.301 11 SD, IEmax, IEmin 0.934 0.925 123.872 100.53
12 SD, C, D3D 0.932 0.922 126.571 95.993 13 SD, D3D, De 0.932 0.922 126.364 96.330 14 SD, HOMO, Adj 0.926 0.916 131.984 87.719 Figure 4. The free energy of binding elicited at the vicinity of
active site by the caffeine ligands.
-7,6 -7,4 -7,2 -7 -6,8 -6,6 -6,4 -6,2
-6 1 4 7 10 13 16 19 22 25 28 31 34 37 40
Bi
nd
in
g
en
er
gy
/
kc
al
m
ol
–1
N O
O N N
OH
Figure 5. Pharmacophore model for the receptor Poly(A) RNA polymerase protein cid1 (a); distances within pharmacophore features in Å (b).
Figure 6. Hypermolecule.
(a)
DOI: 10.5562/cca2733 Croat. Chem. Acta2016, 89(1), 17–24 correlation: LD50 = 0.923 × LD50calc. + 99.785; n = 15; R2 =
0.951; s = 127.328; F = 251.832 is plotted in Figure 8. QSAR study results show that, if one uses the simi-larity cluster validation (R2 = 0.951) the correlation is higher than in case of the external validation (R2 = 0.929).
The lowest binding energy of the molecules in the test set correlates with LD50calc. R2 = 0.032, with no statisti-cal meaning; it means that the toxicity of caffeines is not related to the interaction with this protein cid1, more stud-ies being necessary to find the cause of their toxicity. However, the lowest docking energy ligands were helpful in the choice of molecules in the test set and this choice was clearly better (R2 = 0.951) than in case of the random choice (R2 = 0.893 – see Caffeine CEEJ,[26] computed, however by the mass fragment description ).
CONCLUSIONS
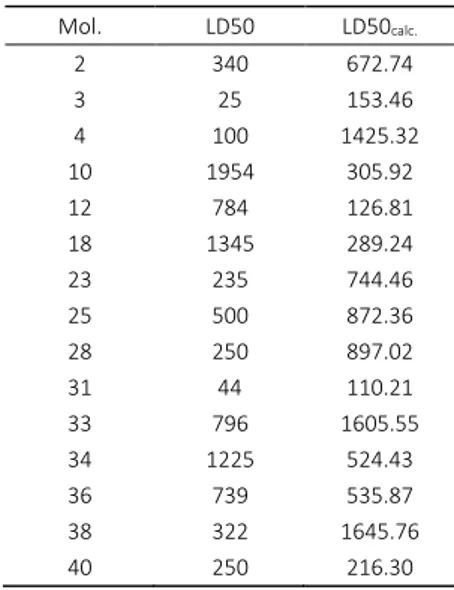
In this paper a qsar study on 40 caffeine derivatives, docked on the protein (4FH3), was reported. Molecular docking was performed to investigate the binding modalities of lig-ands toward possible targets comprised in poly (A) poly-merase Cid1 (4FH3). A further QSAR study suggested that LD50 is not a result of interaction of caffeines with Cid1 pro-tein, the docking energies being not correlated with the re-ported toxicity. However, the docking information was helpful in the choice of leaders for the similarity test set, increasing the accuracy of the predicted LD50 values. Table 7. Calculated values of LD50 for the molecules in the
test set (Table 1)
Mol. LD50 LD50calc.
2 340 672.74
3 25 153.46
4 100 1425.32
10 1954 305.92
12 784 126.81
18 1345 289.24
23 235 744.46
25 500 872.36
28 250 897.02
31 44 110.21
33 796 1605.55
34 1225 524.43
36 739 535.87
38 322 1645.76
40 250 216.30
Table 8. Calculated values of LD50 by similarity clusters, for the molecules in the test set
Mol. LD50 LD50calc.
2 340 275.72
3 25 132.89
4 100 142.22
10 1954 1675.11
12 784 851.40
18 1345 1576.73
23 235 189.04
25 500 554.94
28 250 312.97
31 44 155.17
33 796 897.42
34 1225 1348.17
36 739 715.69
38 322 535.14
40 250 358.09
Figure 7. The plot LD50 vs. LD50 calc. for the test set (external
validation).
LD50 = 0.918 × LD50calc. + 129.9
R² = 0.929
0 500 1000 1500 2000 2500
0 500 1000 1500 2000
LD
50
LD50calc. Table 6. Leave-one-out analysis for best LD50 models
Descriptors Q2 R2-Q2 St. Errorloo Floo
1 SD 0.873 0.018 165.428 157.876 5 SD, IEmax 0.913 0.023 134.202 251.841
11 SD, IEmax, IEmin 0.908 0.026 140.407 228.086
Figure 8. The plot LD50 vs. LD50 calc. by similarity clusters.
LD50 = 0.923 × LD50calc.+ 99.785
R² = 0.951
0 500 1000 1500 2000
0 500 1000 1500 2000
LD
50
Croat. Chem. Acta2016, 89(1), 17–24 DOI: 10.5562/cca2733 Acknowledgment. This paper is a result of a doctoral
re-search made possible by the financial support of the Sec-toral Operational Programme for Human Resources Development 2007–2013, co-financed by the European Social Fund, under the project POSDRU/159/1.5/S/137750 - “Doctoral and postoctoral programs - support for increasing research competitiveness in the field of exact Sciences”.
REFERENCES
[1] C. D. Nicholson, Psychopharmacology1990, 101, 147. [2] P. Nawrot, S. Jordan, J. Eastwood, J. Rotstein, A. Hugenholtz, M. Feeley, Food Addit. Contam.2003,
20(1), 1.
[3] C. Yinghua, S. R. Simmonds, R. Timkovich, Biochem. Biophys. Res. Commun. 2013, 441, 297.
[4] L. A. Al-Ansary, Z. A. Babay, J. - R. Soc. Health1994,
114, 188.
[5] M. A. Tarnopolsky, Appl. Physiol., Nutr., Metab. 2008, 33(6), 1284.
[6] J. D. Lane, C.F. Pieper, B. G. Phillips-Bute, J. E. Bryant, C. M. Kuhn, Psychosom. Med. 2002, 64, 595. [7] P. Munoz-Tello, C. Gabus, S. Thore, Structure2012,
20, 977.
[8] H. Zhang, Y. Wang, F. Xu, J. Mol. Struct.2014, 1076, 153.
[9] T. E. Harsa, A. M. Harsa, B. Szefler, Cent. Eur. J. Chem.
2014, 12, 365.
[10] C. V. Veres, M. Caprioara, Cs. L. Nagy, M. V. Diudea, Studia Univ. “Babes-Bolyai” 2003, 48(2), 47. [11] G. A. Guerin, J. Pratuangdejkul, M. Alemany, J. M.
Launay, P. Manivet, Drug Discovery Today2006, 11, 991.
[12] O. Trott, A. J. Olson, AutoDock Vina: improving the speed and accuracy of docking with a new scoring function, efficient optimization and multithreading,
J. Comput. Chem.2010, 31, 455.
[13] X. Li, L. Ye, X. Wang, X. Wang, H. Liu, Y. Zhu, H. Yu,
Toxicol. Appl. Pharmacol.2012, 265, 300.
[14] M. D. M. AbdulHameed, A. Hamza, J. J. Liu, C. G. Zhan, J. Chem. Inf. Model.2008, 48, 1760.
[15] The RCBS Protein data bank. http://www.rcsb.org/pdb. [16] PubChem database, accessed 10. 10. 2014. [17] N. M. O'Boyle, M. Banck, C. A. James, C. Morley, T.
Vandermeersch, G. R. Hutchison, J. Cheminf.2011,
3, 33.
[18] Gaussian 09, Gaussian Inc Wallingford CT, Revision A.1, M. J. Frisch, G. W. Trucks, H. B. Schlegel, G.E. Scuseria, M. A. Robb, J. R. Cheeseman, G. Scalmani, V. Barone, B. Mennucci, G. A. Petersson, H. Nakatsuji, M. Caricato, X. Li, H. P. Hratchian, A. F. Izmaylov, J. Bloino, G. Zheng, J. L. Sonnenberg, M. Hada, M. Ehara, K. Toyota, R. Fukuda, J. Hasegawa, M. Ishida, T. Nakajima, Y. Honda, O. Kitao, H. Nakai, T. Vreven, J. A. Montgomery, J. E. Peralta, F. Ogliaro, .M Bearpark, J. J. Heyd, E. Brothers, K. N. Kudin, V.N. Staroverov, R. Kobayashi, J. Normand, K. Raghavachari, A. Rendell, J. C. Burant, S. S. Iyengar, J. Tomasi, M. Cossi, N. Rega, N. J. Millam, M. Klene, J. E. Knox, J. B. Cross, V. Bakken, C. Adamo, J. Jaramillo, R. Gomperts, R. E. Stratmann, O. Yazyev, A. J. Austin, R. Cammi, C. Pomelli, J. W. Ochterski, R. L. Martin, K. Morokuma, V. G. Zakrzewski, G. A. Voth, P. Salvador, J. J. Dannenberg, S. Dapprich, A. D. Daniels, Ö. Farkas, J. B. Foresman, J. V. Ortiz, J. Cioslowski, D. J. Fox. 2009.
[19] O. Ursu, M. V. Diudea, “TOPOCLUJ software program”, Babes-Bolyai University, Cluj, 2005. [20] HyperChem 7.52, Hypercube, Inc., http://www.hyper.com/ [21] W. L. DeLano, The PyMOL Molecular Graphics System,
DeLano Scientific, San Carlos, USA, 2002.
[22] C. D. Moldovan, A. Costescu, G. Katona, M. V. Diudea, MATCH 2008, 60, 977.
[23] A. M. Harsa, T. E. Harsa, S. Bolboaca, M. V. Diudea,
Curr. Comput.-Aided Drug Design2014, 10, 115. [24] T. E. Harsa, A. M. Harsa, L. Jantschi, M. V. Diudea, J.
Chem. Pharm. Res.2015, 7(3), 2378.
[25] L. Jäntschi, LOO Analysis (LOO: leave one out), AcademicDirect Library of software 2005, Available at: http://l.academicdirect.org/Chemistry/SARs/MDF_SARs/loo/ [26] T. E. Harsa, A. M. Harsa, B. Szefler, Cent. Eur. J. Chem.