www.atmos-chem-phys.net/10/7643/2010/ doi:10.5194/acp-10-7643-2010
© Author(s) 2010. CC Attribution 3.0 License.
Chemistry
and Physics
Structure-activity relationships to estimate the effective Henry’s law
constants of organics of atmospheric interest
T. Raventos-Duran, M. Camredon, R. Valorso, C. Mouchel-Vallon, and B. Aumont
LISA, UMR CNRS/INSU 7583, Universit´e Paris Est Cr´eteil et Universit´e Paris Diderot, Institut Pierre Simon Laplace, 94010 Cr´eteil Cedex, France
Received: 19 January 2010 – Published in Atmos. Chem. Phys. Discuss.: 16 February 2010 Revised: 16 July 2010 – Accepted: 26 July 2010 – Published: 17 August 2010
Abstract.The Henry’s law constant is a key property needed to address the multiphase behaviour of organics in the atmo-sphere. Methods that can reliably predict the values for the vast number of organic compounds of atmospheric interest are therefore required. The effective Henry’s law constant H∗in air-water systems at 298 K was compiled from litera-ture for 488 organic compounds bearing functional groups of atmospheric relevance. This data set was used to assess the reliability of the HENRYWIN bond contribution method and the SPARC approach for the determination ofH∗. More-over, this data set was used to develop GROMHE, a new Structure Activity Relationship (SAR) based on a group con-tribution approach. These methods estimate logH∗ with a Root Mean Square Error (RMSE) of 0.38, 0.61, and 0.73 log units for GROMHE, SPARC and HENRYWIN respec-tively. The results show that for all these methods the reli-ability of the estimates decreases with increasing solubility. The main differences among these methods lie inH∗ pre-diction for compounds withH∗ greater than 103Matm−1. For these compounds, the predicted values of logH∗ using GROMHE are more accurate (RMSE = 0.53) than the esti-mates from SPARC or HENRYWIN.
1 Introduction
The oxidation of hydrocarbons emitted in the atmosphere involves complex reaction sequences. This oxidation is a gradual process leading to the formation of oxygenated or-ganic intermediates usually denoted as secondary oror-ganics (e.g., Atkinson, 2000). The fate of these secondary organ-ics remains poorly quantified due to a lack of information about their speciation, distribution and evolution in the gas
Correspondence to:B. Aumont
and condensed phases (e.g., Goldstein and Galbally, 2007). A significant fraction of secondary organics may dissolve into the tropospheric aqueous phase, namely rain, clouds and deliquescent particles (e.g., Saxena and Hildemann, 1996; Facchini et al., 1999). The resulting mass transfer is cur-rently suggested to contribute to acid production, organic aerosol formation and the oxidant budget (e.g., Lelieveld and Crutzen, 1990; Walcek et al., 1997; Blando and Turpin, 2000; Ervens et al., 2003, 2008; Legrand et al., 2003, 2005; Yu et al., 2005; Gelencser and Varga, 2005; Lim et al., 2005; Hallquist et al., 2009).
In atmospheric models, the partitioning of organics be-tween the gas and the aqueous atmospheric phases is usu-ally described in the basis of Henry’s law (e.g., Jacob et al., 1989; Aumont et al., 2000; Herrmann et al., 2000, 2005; Er-vens et al., 2003, 2008; Pun et al., 2002; Griffin et al., 2003). Henry’s law expresses the relationship between the solubility of a gas in a liquid and its partial pressure above that liquid:
S=H×P (1)
be useful, estimation methods must be applicable to a wide range of organics, especially to multifunctional species gen-erated during the atmospheric oxidation of hydrocarbons. The aim of this paper is to identify a reliable method for estimating Henry’s law constants for organic compounds of atmospheric interest in air-water systems.
Numerous structure activity relationships (SARs) have been developed to determine the Henry’s law constants in a response to the difficulties associated with its laboratory measurement, in particular, for compounds with higher sol-ubility (Mackay and Shiu, 1981; Russell et al., 1992; Hine and Mookerjee, 1975; Meylan and Howard, 1991; Suzuki et al., 1992). These SARs were reviewed and analysed by Dearden and Schuurmann (2003). This study showed that the bond contribution method developed by Meylan and Howard (1991) and updated in the frame of the HENRYWIN (HWINb) software (Meylan and Howard, 2000) was the most reliable method available. Dearden and Schuurmann (2003) analysed 700 compounds with HWINb and found a R2 of 0.88 with a standard deviation of 1.03. Recently, a new method, SPARC, has been developed by Hilal et al. (2008). This method is based on the product of the activity coefficient in waterγw∞and the vapour pressurePowhich are estimated using intermolecular interactions in the pure liquid phase and in solution (e.g., Boethling and Mackay, 2000). Hilal et al. (2008) used an experimental database of 1222 compounds to test the air-to-waterH. Their results show that for sim-ple molecular structures, the standard deviation is within a factor of 2 but reaches a factor of 3 to 4 for more complex molecules having strong intramolecular and/or dipole-dipole interactions.
The objective of this paper is to assess the reliability of HWINb and SPARC methods. To this end an experimental database of Henry’s law constants was compiled. Special attention was given to select those compounds withHabove 103Matm−1 which are soluble enough to have significant partitioning in the atmospheric aqueous phase (e.g., Seinfeld and Pandis, 1997; Gelencser and Varga, 2005). Furthermore, this database was used to develop a new SAR: the GROup contribution Method for Henry’s law Estimate (hereafter named GROMHE). HWINb, SPARC and GROMHE are all SARs based on a multiple linear regression approach. The main difference between them relies on the selection of descriptors (i.e. the predictors) used to estimateH. The descriptors chosen by SPARC are physical parameters (e.g. volume, molecular polarisability, molecular dipole, H bonding parameters, dispersion interaction, induction inter-action, H bond interinter-action, entropic term, etc.) and quantum mechanical calculations are required to determine their values (Hilal et al., 2004). HWINb uses simple molecular structural descriptors: the number and type of the chemical bonds and in addition, some correcting factors. GROMHE follows a similar paradigm but is based on the number and nature of the functional groups present in the molecule (see Sect. 3.2).
In this paper, we first describe the selection of the database used to develop and/or assess the estimation methods. We then describe the development of GROMHE and finally anal-yse the performance of the three methods considered for this study.
2 Database
Usually the experimental values found in the literature are expressed as effective Henry’s law constants,H∗, which in-cludes the hydration process. We differentiate the literature H∗values from the intrinsicHvalues as detailed in the next section. The database of Henry’s law constants was com-piled to include species representative of atmospheric oxida-tion processes occurring in the gas or aqueous phase. Ta-ble S1 (see the electronic supplement) lists the experimen-tal values selected in this study in units of Matm−1and
pre-sented as the logarithm of H∗. The database includes 488 organic compounds comprising a wide range of functional groups detected in either gas or aqueous phase: nitrate, ni-tro, peroxyacylnitrate, aldehyde, ketone, ester, ether, alcohol, hydroperoxide, peracid, carboxylic acid and halogen (e.g., Finlayson-Pitts and Pitts, 2000; Seinfeld and Pandis, 1997). The number of species bearing a specific functional group is given in Table 1. The availability of data for hydroper-oxides (3 species) and peracids (1 species) is limited and therefore it is difficult to assess the reliability ofH∗ esti-mates for these groups of species. This is a limiting factor since oxidation proceeds through the formation of such com-pounds in remote conditions (or low NOxconditions).
Ad-ditional data for these groups of species would be especially valuable to constrain structure activity relationships for at-mospheric applications. The database is also poor for mul-tifunctional oxygenated organics, although special care was taken to be as comprehensive as possible in the collection of experimentalH∗for these groups of species. Data listed in Table S1 includesH∗for 76 hydrocarbons, 231 monofunc-tional compounds, 132 difuncmonofunc-tional compounds and 49 com-pounds bearing at least 3 functional groups. Both aliphatic and aromatic species were considered in the compilation and the data in Table S1 can be split into 393 aliphatic and 95 aromatic species. The constants included range from 10−4 to 109Matm−1. Henry’s law constants depend on the type
of functional groups attached to the carbon chain and usu-ally increase with the number of groups; for hydrocarbon species H∗ ranges from 10−4 to 10−1Matm−1 whilst for
monofunctional organic compoundsH∗ ranges from 10−1 to 105Matm−1. Difunctionals compounds have the greatest range ofH∗, from 10−1to 109Matm−1.
Table 1.Descriptors for the model GROMHE, number of species in the database contributing to the descriptor and their related contribution, standard error and statistical significance in the MLR.
Descriptora
Training dataset All dataset
Number of Contribution Standard p-Value Number of Contribution Standard p-Value
species Error species Error
Functional group and structural descriptors
# of hydroxy groups (-OH) 85 4.56 0.11 0.0000 120 4.56 0.09 0.0000 # of nitro groups (-NO2) 22 3.06 0.12 0.0000 27 3.02 0.10 0.0000 # of nitrate groups (-ONO2) 33 2.06 0.07 0.0000 44 2.04 0.06 0.0000 # of hydroperoxide groups (-OOH) 1 4.98 0.42 0.0000 3 4.87 0.24 0.0000 # of fluorine groups (-F) 15 0.60 0.10 0.0000 19 0.60 0.08 0.0000 # of chlorine groups (-Cl) 26 0.88 0.07 0.0000 51 0.87 0.06 0.0000 # of bromine groups (-Br) 15 1.04 0.10 0.0000 21 1.06 0.09 0.0000 # of iodine groups (-I) 7 1.15 0.18 0.0000 11 1.22 0.13 0.0000 # of aldehyde groups (-CHO) 18 2.63 0.12 0.0000 24 2.59 0.11 0.0000 # of ketone groups (-COR) 22 3.29 0.12 0.0000 35 3.16 0.10 0.0000 # of acid groups (-COOH) 27 5.11 0.11 0.0000 36 5.09 0.09 0.0000 # of peracid groups (-COOOH) 1 4.68 0.41 0.0000 1 4.68 0.40 0.0000 # of peroxyacyl nitrate groups (-PAN) 3 1.94 0.25 0.0000 5 1.93 0.19 0.0000 # of ether groups (-OR) 42 2.44 0.10 0.0000 52 2.40 0.09 0.0000 # of ester groups (-COOR) 37 2.79 0.10 0.0000 55 2.78 0.08 0.0000 # of formate groups (-HCOOR) 3 2.39 0.25 0.0000 4 2.36 0.21 0.0000 # of C atoms 345 0.49 0.02 0.0000 488 0.50 0.02 0.0000 # of H atoms 345 −0.31 0.01 0.0000 488 −0.31 0.01 0.0000 nfcd 26 −0.59 0.07 0.0000 37 −0.52 0.05 0.0000 nfaro 48 −1.10 0.07 0.0000 67 −1.12 0.06 0.0000
Group interaction descriptors
tdescriptor 98 −0.14 0.01 0.0000 138 −0.14 0.01 0.0000 caox-a 9 −1.78 0.17 0.0000 13 −1.77 0.13 0.0000 caox-b 8 −1.31 0.18 0.0000 12 −1.09 0.14 0.0000 hyd-a 18 −0.63 0.13 0.0000 29 −0.60 0.10 0.0000 hyd-b 15 −1.00 0.18 0.0000 23 −1.03 0.14 0.0000
Correction factor descriptors
haloic-a 5 0.98 0.21 0.0000 10 0.97 0.15 0.0000 onitrofol 7 −2.72 0.23 0.0000 10 −2.66 0.19 0.0000 nogrp 52 −0.31 0.11 0.0069 76 −0.28 0.09 0.0028 Intercept – −1.51 0.11 0.0000 – −1.52 0.09 0.0000
aSee Sect. 3.2 for the meaning of the descriptor.
Environment Protection Agency HENRYWIN program (Meylan and Howard, 2000) with a few additional values taken from recently published papers (see Table S1 in the electronic supplement). The data were taken from experi-mental values either from direct or indirect measurements. The indirect measurements are based on relationships be-tween thermodynamic variables. In particular, for sparingly water soluble species,H∗is often estimated using the rela-tionship: H∗=Sws/Po whereSws is the solubility for a sat-urated solution and Po is the vapour above the pure com-pound in the condensed phase. Because Sws and Po val-ues are measured independently in the laboratory, we have two sources that contribute to the uncertainty in the finalH∗ value (Mackay and Shiu, 1981).
Most experimental H∗ data in Table S1 are provided at 298 K. A small number of species measured at 293 K (20 compounds, see Table S1) were also included to obtain a better representation of multifunctional oxygenated species. These values were corrected using the van’t Hoff equation: H298=H293×exp
1Hsolv
R
1 293−
1 298
(2) where1Hsolv is the desolvation enthalpy andR is the gas
constant. The desolvation enthalpy1Hsolvtypically ranges
was thus decreased by 0.15 log units. The uncertainty in the applied correction factor is small compared to the uncertain-ties from the SAR outputs and experimental data.
For empirically based methods, the experimental uncer-tainties are transferred into the models’ unceruncer-tainties. How-ever, uncertainties for the data reported in Table S1 are hard to evaluate owing to the large number of experimental sources and the lack of reported experimental uncertainties in many of the original papers (Russell et al., 1992). During the compilation, we found that discrepancies in the measured H∗value for a given compound often exceeded a factor of 2. The discrepancies tend to increase withH∗which indicates the difficulties of measuring the physical property for those species with very high Henry’s law constants (Hilal et al., 2008; Mackay and Shiu, 1981). As a guideline, we assume that the uncertainty is at least a factor of 2 for species having H∗above 105Matm−1.
3 Development of the GROMHE estimation method
3.1 Estimation method for hydration constants
Compounds containing carbonyl groups like aldehydes and ketones may undergo significant hydration. Carbonyls com-bine with water molecules to form gem diols upon dissolu-tion according to the equilibrium:
>C = O + H2O ←→ >C(OH)(OH)
The equilibrium of the carbonyls between the hydrated (>C(OH)(OH)) and non-hydrated (>C=O) form is de-scribed by the hydration constantKhyd:
Khyd=
[>C(OH)(OH)]
[>C=O] (3)
Table S2 (see the electronic supplement) shows the compi-lation of the hydration constants for 61 aldehydes and/or ke-tones.Khydis typically about 10−3and 1 for simple ketones
and aldehydes, respectively. Khyd increases by 1 to 3
or-ders of magnitude when a strongly polar group is attached to the carbon atom next to the carbonyl group. Hydration is therefore a key parameter affecting the solubility of multi-functional carbonyl compounds.
The partitioning of species that undergo hydration in water is usually described with the effective Henry’s law constant H∗. The effective Henry’s law constant of a compound is defined as the ratio between the total dissolved concentration and its pressure:
H∗=([>C=O]+[>C(OH)(OH)])
P>C=O
=H 1+Khyd (4)
whereH is the intrinsic Henry’s law constant for the car-bonyl. The values extracted from the literature and listed in Table S1 (see the electronic supplement) are thereforeH∗for carbonyls.
Most estimation methods were based on group contribu-tion methods using logH∗ as the training data set. Equa-tion (4) shows that for carbonyls, H∗ is a function of 2 fundamental properties (H and Khyd). If Khyd≫1 then
logH∗≈logH+logKhyd. On the other hand, ifKhyd≪1,
then logH∗≈logH. This conditional addition of logKhyd
is hard to represent by a simple group contribution method which assumes additive groups. Here we estimated both Khydand the intrinsicHfor each carbonyl and used Equation
4 to finally computeH∗. Note that the method performance was assessed on the accuracy ofH∗ which is the primary property being investigated.
A SAR was constructed to estimateKhydbased on a
mul-tiple linear regression approach using the experimental data shown in Table S2 as training set. This modelling approach assumes that the relationship between the dependent variable yi (here Khyd) and the independent variables xj (here the
structural descriptors or predictors) is linear. The equation for this model is given by:
yi=β0+β1x1,i+ ··· +βjxj,i+ ··· (5)
whereistands for theit hspecies in the database,xj,i is the
jt h descriptors andβj are the regression coefficients (here
the contributions) computed for the descriptorj. The best-fitting line for the observed data is calculated by minimising the sum of the squared errors, SSE:
SSE=
n X
i=1
logKhyd,est−logKhyd,exp 2
(6) wheren is the number of species included in the database. The descriptors were selected following their assessment in the multiple linear regression.
Previous studies have shown thatKhyd is well correlated
with the inductive effect of the neighbouring groups (Le Henaff, 1968; Betterton and Hoffmann, 1988). Therefore, Taft and Hammett σ were used as descriptors for aliphatic and aromatic compounds, respectively (see Table 2). Ham-mett values for the various functional groups were obtained from the data reviews of Hansch et al. (1995) and Perrin et al. (1981). We defined a “Hammett descriptor” (referenced as
hdescriptorin Table 3) as the sum of the contribution of each group:
hdescript or=6σo+6σm+6σp (7)
whereσo,σm,σpare the Hammett sigma values for the
func-tional groups in ortho, meta or para positions relative to the benzaldehyde group (see Table 2). Similarly, we defined a “Taft descriptor” (tdescriptor) as:
t descript or=6σi∗ (8)
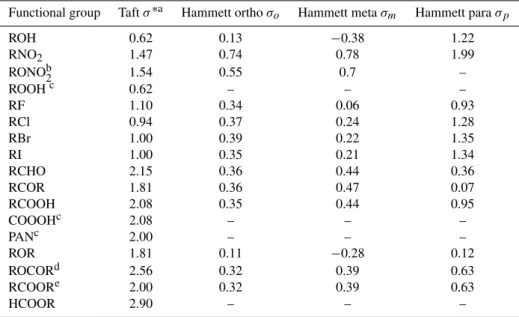
Table 2.Sigma Taft and Hammett values for organic functional groups (adapted from Perrin et al., 1981).
Functional group Taftσ∗a Hammett orthoσo Hammett metaσm Hammett paraσp
ROH 0.62 0.13 −0.38 1.22
RNO2 1.47 0.74 0.78 1.99
RONOb2 1.54 0.55 0.7 –
ROOHc 0.62 – – –
RF 1.10 0.34 0.06 0.93
RCl 0.94 0.37 0.24 1.28
RBr 1.00 0.39 0.22 1.35
RI 1.00 0.35 0.21 1.34
RCHO 2.15 0.36 0.44 0.36
RCOR 1.81 0.36 0.47 0.07
RCOOH 2.08 0.35 0.44 0.95
COOOHc 2.08 – – –
PANc 2.00 – – –
ROR 1.81 0.11 −0.28 0.12
ROCORd 2.56 0.32 0.39 0.63
RCOORe 2.00 0.32 0.39 0.63
HCOOR 2.90 – – –
aReportedσ∗is the inductive effect that the carbon bearing the functional group exerts on its direct neighbouring groups. According to Perrin et al. (1981)σ∗for functional
groups attached to carbons at distant positions are determined asσ=σi×(0.4)nwherenis the number of aliphatic carbons separating the functional groups. The 2 carbons forming a C=C bond are counted as one C only.bPerrin et al. (1981) givesσ∗= 3.86 for the nitrate group. The value reported here isσ∗=0.4×3.86, estimated for the carbon bearing the nitrate functional group to its neighbouring groups.cValue set assuming thatσ
ROOH=σROH,σC(O)OOH=σRC(O)OH,σPAN=σRCOOCH3.dSigma for ester at the -O- side.e Sigma for ester at the -CO side.
and ketone from aldehyde groups. Table 3 provides the op-timised contribution for these 4 descriptors and Fig. 1 shows the resulting scatter plot. The coefficient of determination is R2=0.91. The reliability of the method was assessed using the root mean square error (RMSE) defined as:
RMSE=
v u u t
1 n
n X
i=1
logKhyd,est−logKhyd,exp
2
(9)
wheren is the number of species included in the database. The RMSE obtained is 0.47 log units. The method allows estimatingKhydwithin a factor of 3.
3.2 Estimation method for the intrinsic Henry’s law
constants
The GROMHE approach is similar to the method described by Suzuki et al. (1992) and is based on considering a molecule as a collection of elemental constituents (functional groups or atoms) whose contributions are computed using a multiple linear regression (MLR). The original approach by Suzuki et al. (1992) was developed for monofunctional species only. In GROMHE, the approach is extended to multifunctional species using additional descriptors to ac-count for group interactions. The identification of descriptors for the multiple linear regression is complex: increasing the number of descriptors (increase in the degree of freedom) usually leads to a better fit of the experimental data. How-ever, regression models are prone to over-fitting and there is
−2 0 2 4 6
−2 0 2 4 6
log Khyd, exp
log K
h
yd
, est
R2 = 0.906
N = 61
Fig. 1. Estimated hydration constant versus experimental values.
The line is they=xline.
a requirement to reduce the number of descriptors used as much as possible. An attempt was thus made to minimise the number of descriptors and to optimise the regression for the species of atmospheric interest.
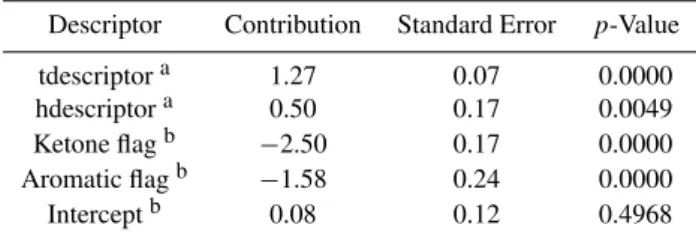
Table 3.Descriptors for the model to estimate hydration constants and their related contribution, standard error and statistical signifi-cance (p-value) in the MLR.
Descriptor Contribution Standard Error p-Value
tdescriptora 1.27 0.07 0.0000
hdescriptora 0.50 0.17 0.0049
Ketone flagb −2.50 0.17 0.0000
Aromatic flagb −1.58 0.24 0.0000
Interceptb 0.08 0.12 0.4968
aSee Sect. 3.1.bFlag is Boolean type set to 1 if the criterion is matched.
the contribution of the descriptors selected for the regression. Species used for validation were randomly selected and are given in Table S1 (see the electronic supplement). This ran-dom selection covered structurally diverse compounds rep-resentative of all type of functional groups included in the database (see Table 1). The effective Henry’s law constants collected in our data set were corrected for hydration to de-termine intrinsic values. The structure activity relationship (SAR) presented in the previous section was used systemati-cally to derive the hydration constants for ketones and alde-hydes and to compute the intrinsic Henry’s law constant (H) values. These derived intrinsicH values were used as the training data set for the MLR analysis. Our model uses 28 independent descriptors, presented below. The list of de-scriptors along with their contributions and standard errors are shown in Table 1.
Suzuki et al. (1992) have shown thatH can be estimated for hydrocarbons and monofunctional species using the or-ganic functionalities as descriptors along with the number of carbon and hydrogen atoms. We introduced 16 descriptors, each corresponding to a distinct organic functionality identi-fied within the compounds comprising the study data set (see Table 1), and two structural descriptors to account for the number of hydrogen and carbon atoms.
In contrast to Suzuki et al. (1992) who duplicated the de-scriptors to differentiate functionalities bound to an aromatic chain from those bound to an aliphatic chain, we simply de-fined two additional descriptors to account for the number of groups bound to an aromatic ring or an olefinic carbon re-spectively, so as to keep the number of descriptors to a min-imum. These descriptors are referenced asnfaroandnfcdin Table 1. An MLR using these 20 structural descriptors was able to provideH estimates with anR2 of 0.97 for the hy-drocarbons and monofunctional species included in the data set.
Extrapolation of our model using the 20 descriptors de-fined above however leads to errors in the estimated val-ues exceeding 3 orders of magnitude for some difunctional species. Additional descriptors were therefore included to account for intramolecular group interactions. The mutual
inductive effect between functional groups was explored as a parameter linked to the overestimation ofH identified in multifunctional species. Here, we introduced Sigma Taft (σ∗) as a descriptor for aliphatic species (e.g., Hansch et al., 1995). Group interactions were taken into account by adding, for each groupi, theσj∗of the neighbouring groupj: t descript or=X
i X
j6=i
σj∗ (10)
wheret descript oris the parameter used as a descriptor for the regression. Values for σj∗ are provided in Table 2 for each of the 16 functional groups encountered in the database. t descript or was found to be statistically significant for the prediction ofH at the 99.9% confidence level (see p-value in Table 1). The inclusion of t descript or in the set of descriptors leads to a fairly good estimate of H for multi-functional compounds bearing nitro, nitrate and/or halogen groups. However,H was still overestimated for multifunc-tional species bearing carbonyl or hydroxyl moieties, so ad-ditional descriptors were introduced.
Scatter plots showed that species with a−C(=O)−C(X) < structure where X is an oxygenated moiety (carbonyl, alco-hol, ether, hydroperoxide or nitro) have lowerHvalues than predicted by simple group addition. A specific structural de-scriptor (caox-ain Table 1) was therefore introduced to ac-count for this effect. A similar trend was also observed when the X moiety was located in the β position relative to the carbonyl group and was accounted for by the inclusion of
the caox-bdescriptor. Similarly,H was found to be
over-estimated for species having a functional group in theαor β position relative to an alcohol moiety. This effect might be linked to some intramolecular H-bonding (e.g., Hine and Mookerjee, 1975; Hilal et al., 2008). This effect was taken into account with the help of two additional structural de-scriptors:hyd-aandhyd-b. The inclusion of these 4 descrip-tors was found to greatly improveHestimates for the multi-functional oxygenated species. However, a bias in predicted H was still found for 2 groups of species: o-nitrophenols and halogenated species bearing a carboxylic acid moiety in theαposition. Two additional descriptors (haloic-a, onitro-folin Table 1) were introduced to correct this bias. This is similar to the correction factors applied in the QSAR method developed by Russell et al. (1992) and in the HENRYWIN method.
The 27 descriptors listed above were all found to be sig-nificant for the prediction ofHat the 99.9% confidence level (see the p-values in Table 1). However, a small bias was observed in the prediction ofH for hydrocarbons and a fi-nal descriptor (nogrpin Table 1) was included to correct this bias. The computed contribution fornogrpremains low and this factor is the least significant in the regression (see the p-value in Table 1).
−4 −2 0 2 4 6 8 10 −4
−2 0 2 4 6 8 10
log Hexp
log
Hest
R2 = 0.973
N = 142
* *
−4 −2 0 2 4 6 8 10
−4 −2 0 2 4 6 8 10
log Hexp
log
Hest
R2 = 0.974
N = 345
* *
Training dataset Validation dataset
MBE = 0.000 MAE = 0.273 RMSE = 0.381
MBE = - 0.039 MAE = 0.278 RMSE = 0.388
Fig. 2. Scatter plot of estimated logH∗using GROMHE versus experimental logH∗for the training set (left panel) and the validation set
(right panel). The line is they=xline. The (x) symbol represents oxo-acetic acid.
oxo-acetic acid, behaves as an outlier with logH∗ mated by 3 log units. This species was found to be overesti-mated by 6 log units using SPARC (see below). The reason of this large overestimation remains unresolved to us and we decided to remove that species from the GROMHE optimi-sation training set. For the purpose of the intercomparison, oxo-acetic acid was also removed from the statistical analy-sis. The reliability of the predictions were assessed using the Root Mean Square Error (RMSE), determined as described previously in the context of the hydration constant assess-ment (see Equation 9), the Mean Absolute Error (MAE) and the Mean Bias Error (MBE):
MAE=1
n
n X
i=1
logH
∗
est−logHexp∗
(11)
MBE=1
n
n X
i=1
logHest∗ −logHexp∗ (12)
wheren is the number of species included in the database. The MAE, MBE and RMSE are given in Fig. 2 for the train-ing and validation data sets. Figure 2 shows that the model explains 97% of the total variance of the validation data set. Estimated logH∗values for the validation set shows no sig-nificant bias (MBE = 0.04). The RMSE for the validation set is 0.39, which corresponds to an estimation ability of H∗ within a factor of 2.5. The RMSE, MAE, MBE andR2 val-ues for the validation set are similar to those calculated for the training set and show that the model is not over-fitted (see Fig. 2).
3.3 Analysis of GROMHE estimation method
The previous section shows that GROMHE provides reliable estimates ofH∗. The contribution of the descriptors was op-timised to obtain a more representative model using the full
database. These final contributions agree with those com-puted for the training data set within their statistical uncer-tainties (see Table 1). The analysis of GROMHE predictions were performed using the optimised contributions.
The overall performance of GROMHE is summarised in the scatter plot shown in Fig. 3a. The RMSE, MAE and MBE are shown in Fig. 4 together with the box plot of er-ror distribution. The assessment was also performed for dif-ferent subsets to identify possible bias for various groups of species. Three categories of subsets were defined according to: 1) the number of functional groups (hydrocarbons, mono-functional, difunctional and multifunctional), 2) the aromatic or aliphatic structure of the molecule and 3) the range of the Henry’s law constant to differentiate fairly insoluble species (with H∗ below 103Matm−1) from more soluble species (H∗greater than 103Matm−1).
−4 −2 0 2 4 6 8 10 −4
−2 0 2 4 6 8 10
hydrocarbon
1 functional group 2 functional groups
>2 functional groups
log Hexp
log
Hest
R2 = 0.974
n = 487
* *
−4 −2 0 2 4 6 8 10
−4 −2 0 2 4 6 8 10
hydrocarbon
1 functional group 2 functional groups
>2 functional groups
log Hexp
log
Hest
R2 = 0.912
n = 487
*
*
−4 −2 0 2 4 6 8 10
log Hexp
−4 −2 0 2 4 6 8 10
log
Hest
hydrocarbon
1 functional group 2 functional groups
>2 functional groups
R2 = 0.937
n = 487
*
* hydrocarbon
1 functional group 2 functional groups
>2 functional groups
R2 = 0.965
n = 487
−4 −2 0 2 4 6 8 10
−4 −2 0 2 4 6 8 10
log Hexp
log
Hest
*
*
GROMHE HWINb
HWINb optimised SPARC
(a) (b)
(c) (d)
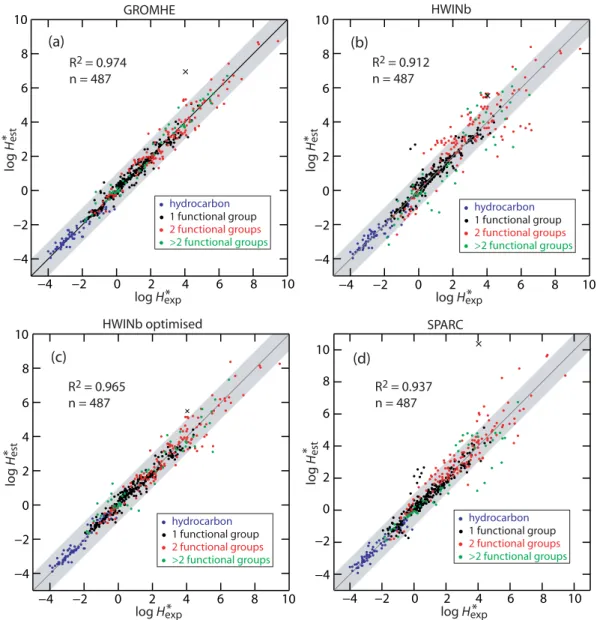
Fig. 3.Scatter plot of estimated versus experimental logH∗for(a)GROMHE method,(b)HWINb method,(c)HWINb optimised method
and(d)SPARC-v4.2 method. The line is they=xline and the grey area represents agreement within one log unit. The (x) symbol represents oxo-acetic acid.
4 Analysis of HWINb and SPARC estimation methods
HWINb, SPARC methods are able to estimateH∗for all the species selected in the database (see Table S1 in the elec-tronic supplement).H∗estimates from HWINb method were determined using the software EPIWIN suit (http://www.epa. gov/oppt/exposure/pubs/episuitedl.htm). The SPARC cal-culator (http://sparc.chem.uga.edu/sparc) estimates indepen-dently the intrinsicHand the hydration constantKhyd. These
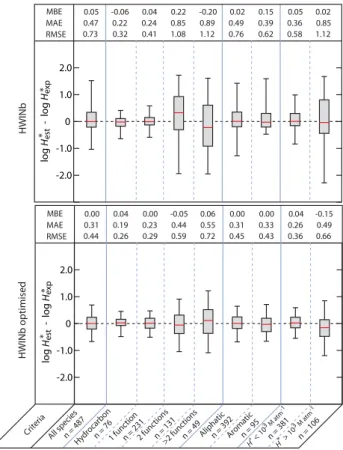
two properties were jointly used to retrieve the effective Henry’s law constantH∗from Eq. (4). The values reported in Table S1 refer to the retrieved logH∗. The overall perfor-mance of the models HWINb and SPARC are summarised in scatter plots (Fig. 3b and d). The RMSE, MAE and MBE for
each method are shown in Figs. 5 and 6 together with the box plot of error distribution.
For the method HWINb, the scatter plot is shown in Fig. 3b and the performance in Fig. 5. The coefficient of determi-nation for logH∗
est versus logHexp∗ isR2=0.91.
All species Hydr ocarbon 1 func tion 2 func tions >2 func tions Aliphatic Aromatic H* <
103 M atm -1
H* > 103 M atm
-1
n = 381 n = 106 n = 95
n = 76 n = 231 n = 131 n = 49 n = 487
- 2 - 1 0 1 2 log Hest
- log
Hexp
MAE RMSE MBE
0.27 0.22 0.22 0.40 0.28 0.25 0.37 0.24 0.42
-0.01 0.06 -0.01 -0.03 0.09 -0.01 -0.01 0.01 -0.09
0.38 0.30 0.31 0.52 0.39 0.35 0.49 0.33 0.53
* *
Crit eria
n = 392
Fig. 4. Mean bias error (MBE), mean absolute error (MAE), root
mean square error (RMSE) and box plot for the error distribution in the estimated logH∗ value with the GROMHE method. The whiskers of the box plot show the 5th and 95th percentiles, the box shows the second and third quartile and the red line gives the me-dian value of the distribution.
For the subset of species withH∗ above 103Matm−1, the
RMSE reaches 1.1 log units which is twice the RMSE given by the GROMHE method. Furthermore, the error obtained with GROMHE for each subset is systematically lower than those obtained using HWINb.
The evaluation of HWINb method was made using the contributions provided by running the EPIWIN software. These contributions are computed using another training database. In an attempt to make a fairer inter-comparison, a multiple linear regression was performed to optimise the HWINb model to our database. The contributions of 47 de-scriptors (35 bonds and/or fragments and 12 correction fac-tors) were revaluated to describe the structure of the 488 molecules included in the database. The scatter plot obtained with the optimised HWINb model is shown in Fig. 3c and the box plot in Fig. 5. The determination coefficientR2is 0.96 compared to 0.91 for the original model. This optimised model shows an improvement especially for the estimation of logH∗ for the more soluble species (H∗>103Matm−1) with an RMSE of 0.66 compared to 1.12 for the original model. The MBE was also considerably better showing no bias for all the data subsets. However, the RMSE and the MAE for the subset of species having at least 3 functional groups still remain significantly lower for GROMHE.
The correlation logH∗estimated using SPARC versus ex-perimental logH∗ is shown in Fig. 3d. The coefficient of determinationR2is 0.94. SPARC performance is shown in Fig. 6. SPARC and HWINb show similar reliability with similar trends in the prediction of logH∗for the various sub-sets. Hydrocarbons and monofunctional compounds are well represented (RMSE<0.5) whilst errors become large for multifunctional species (RMSE=0.97). Similar to HWINb
All species Hydr ocarbon 1 func tion 2 func tions >2 func tions Aliphatic Aromatic
H* <
103 M atm
-1
H* >
103 M atm
-1
n = 381 n = 106 n = 95
n = 76 n = 231 n = 131 n = 49 n = 487
MAE RMSE MBE
0.31 0.19 0.23 0.44 0.55 0.31 0.33 0.26 0.49
0.00 0.04 0.00 -0.05 0.06 0.00 0.00 0.04 -0.15
0.44 0.26 0.29 0.59 0.72 0.45 0.43 0.36 0.66
-2.0 -1.0 0 1.0 2.0 log Hest
- log
Hexp MAE RMSE MBE
0.47 0.22 0.24 0.85 0.89 0.49 0.39 0.36 0.85
0.05 -0.06 0.04 0.22 -0.20 0.02 0.15 0.05 0.02
0.73 0.32 0.41 1.08 1.12 0.76 0.62 0.58 1.12
-2.0 -1.0 0 1.0 2.0 * * Crit eria
n = 392
log
Hest
- log
Hexp
* *
HWINb
HWINb optimised
Fig. 5. Mean bias error (MBE), mean absolute error (MAE), root
mean square error (RMSE) and box plot for the error distribution in the estimated logH∗value with the HWINb (top panel) and HWINb optimised method (bottom panel). The whiskers of the box plot show the 5th and 95th percentiles, the box shows the second and third quartile and the red line gives the median value of the distri-bution.
results, a bias towards logH∗ overestimation is found for difunctional species and towards underestimation for tri or more functional species. Like GROMHE and HWINb the reliability of SPARC estimates decreases with increasing sol-ubility. The error is about one order of magnitude for species having H∗ above 103Matm−1 (see Fig. 6). Here again, a fair comparison would require to revaluate the contribution of the SPARC descriptors using our database. However, the SPARC method is based in physical parameters which are determined using quantum mechanical calculations. These calculations are beyond the scope of this paper. Additional work would thus be required to evaluate the inherent per-formance of the SPARC method before reaching any final conclusions.
5 Conclusions
All species Hydr
ocarbon 1 func
tion
2 func tions
>2 func tions
Aliphatic Aromatic H* <
10 3 M atm
-1
log
Hest
- log
Hexp MAE RMSE MBE
-2.0 -1.0 0 1.0 2.0
H* > 10
3 M atm -1
0.40 0.21 0.30 0.58 0.67 0.39 0.46 0.31 0.73
0.05 -0.04 0.03 0.24 -0.20 0.06 0.03 0.07 -0.03
0.61 0.28 0.46 0.78 0.97 0.60 0.64 0.46 0.98
* *
n = 381 n = 106 n = 95
n = 76 n = 231 n = 131 n = 49 n = 487
Crit eria
n = 392
Fig. 6. Mean bias error (MBE), mean absolute error (MAE), root
mean square error (RMSE) and box plot for the error distribution in the estimated logH∗value with the SPARC-v4.2 method. The whiskers of the box plot show the 5th and 95th percentiles, the box shows the second and third quartile and the red line gives the median value of the distribution.
the training data set including 345 organics representative species of atmospheric interest. A set of 28 descriptors was found to be statistically significant for the prediction of logH∗. The resulting method predicts logH∗ with a root mean square error of 0.39 for a validation set including 142 species. No statistically significant bias was observed. The regression fit of predicted versus observed logH∗ shows a coefficient of determination ofR2=0.97.
TheH∗values for hydrocarbon and monofunctional com-pounds were well predicted with similar performance with all the methods assessed (GROMHE, HWINb and SPARC). The results show that the reliability of the predicted values decreases when H∗ increases. Species having H∗ above 103Matm−1 are of particular interest in the context of
at-mospheric chemistry. For the subset of species havingH∗ above that threshold, the RMSE obtained for GROMHE is 0.53 log units. For the same subset, the reliability of the pre-diction using HWINb or SPARC was appreciably lower with RMSE of about 1 log unit. However, to some extent this large error can be explained by changing the dataset used for train-ing and validation. In particular, the performance of HWINb was found to be significantly improved when the contribution of the descriptors was recalculated using the data compiled in this work. The results show that GROMHE performs well compared to the other SARs. These results give confidence in the ability of GROMHE to determine theH∗for organics known to be important in atmospheric chemistry.
Supplementary material related to this article is available online at:
http://www.atmos-chem-phys.net/10/7643/2010/
acp-10-7643-2010-supplement.pdf.
Acknowledgements. We would like to thank S. H. Hilal and
L. A. Carreira for providing us with data and support to run SPARC. Helpful comments on the manuscript by A. Dutot and J. Lee-Taylor and Adriana Coman are gratefully acknowledged. Van Viet Ngo and Romain Bouchaud contributed to the early development of GROMHE.
Edited by: M. Petters
The publication of this article is financed by CNRS-INSU.
References
Atkinson, R.: Atmospheric chemistry of VOCs and NOx, Atmos.
Environ., 34, 2063–2101, 2000.
Aumont, B., Madronich, S., Bey, I., and Tyndall, G. S.: Contri-bution of secondary VOC to the composition of aqueous atmo-spheric particles: a modeling approach, J. Atmos. Chem., 35, 59–75, 2000.
Aumont, B., Szopa, S., and Madronich, S.: Modelling the evolution of organic carbon during its gas-phase tropospheric oxidation: development of an explicit model based on a self generating ap-proach, Atmos. Chem. Phys., 5, 2497–2517, doi:10.5194/acp-5-2497-2005, 2005.
Betterton, E. A., and Hoffmann, M. R.: Henry’s law constants of some environmentally important aldehydes, Environ. Sci. Tech-nol, 22, 1415–1418, 1988.
Blando, J. D., and Turpin, B. J.: Secondary organic aerosol forma-tion in cloud and fog droplets: a literature evaluaforma-tion of plausi-bility, Atmos. Environ., 34, 1623–1632, 2000.
Boethling, R. S., and Mackay, D.: Handbook of Property Estima-tion Methods for Chemicals: Environmental Health Sciences, CRC Press LLC, Washington, DC, USA, 2000.
Camredon, M., Aumont, B., Lee-Taylor, J., and Madronich, S.: The SOA/VOC/NOxsystem: an explicit model of secondary
or-ganic aerosol formation, Atmos. Chem. Phys., 7, 5599–5610, doi:10.5194/acp-7-5599-2007, 2007.
Chen, J., Griffin, R. J., Grini, A., and Tulet, P.: Modeling secondary organic aerosol formation through cloud processing of organic compounds, Atmos. Chem. Phys., 7, 5343–5355, doi:10.5194/acp-7-5343-2007, 2007.
Dearden, J. C. and Schuurmann, G.: Quantitative structure-property relationships for predicting Henry’s law constant from molecular structure, Environ. Toxicol. Chem., 22, 1755–1770, 2003. Ervens, B., George, C., Williams, J. E., Buxton, G. V., Salmon,
Ervens, B., Carlton, A. G., Turpin, B. J., Altieri, K. E., Kreidenweis, S. M., and Feingold, G.: Secondary organic aerosol yields from cloud-processing of isoprene oxidation products, Geophys. Res. Lett., 35, 5, L02816, doi:10.1029/2007JL031828, 2008. Facchini, M. C., Fuzzi, S., Zappoli, S., Andracchio, A., Gelencser,
A., Kiss, G., Krivacsy, Z., Meszaros, E., Hansson, H. C., Als-berg, T., and Zebuhr, Y.: Partitioning of the organic aerosol com-ponent between fog droplets and interstitial air, J. Geophys. Res.-Atmos., 104, 26821–26832, 1999.
Finlayson-Pitts, B. J. and Pitts, J. N.: Chemistry of the upper and lower atmosphere, Academic Press, San Diego, USA, 2000. Gelencser, A., and Varga, Z.: Evaluation of the atmospheric
sig-nificance of multiphase reactions in atmospheric secondary or-ganic aerosol formation, Atmos. Chem. Phys., 5, 2823–2831, doi:10.5194/acp-5-2823-2005, 2005.
Goldstein, A. H., and Galbally, I. E.: Known and unexplored or-ganic constituents in the earth’s atmosphere, Environ. Sci. Tech-nol., 41, 1514–1521, 2007.
Griffin, R. J., Nguyen, K., Dabdub, D., and Seinfeld, J. H.: A cou-pled hydrophobic-hydrophilic model for predicting secondary organic aerosol formation, J. Atmos. Chem., 44, 171–190, 2003. Hallquist, M., Wenger, J. C., Baltensperger, U., Rudich, Y., Simp-son, D., Claeys, M., Dommen, J., Donahue, N. M., George, C., Goldstein, A. H., Hamilton, J. F., Herrmann, H., Hoffmann, T., Iinuma, Y., Jang, M., Jenkin, M. E., Jimenez, J. L., Kiendler-Scharr, A., Maenhaut, W., McFiggans, G., Mentel, T. F., Monod, A., Prevot, A. S. H., Seinfeld, J. H., Surratt, J. D., Szmigiel-ski, R., and Wildt, J.: The formation, properties and impact of secondary organic aerosol: current and emerging issues, At-mos. Chem. Phys., 9, 5155–5236, doi:10.5194/acp-9-5155-2009, 2009.
Hansch, C., Leo, A. , and Hoekman, D.: Exploring QSAR: Hy-drophobic, Electronic, and Steric Constants, American Chemical Society, Washington DC, USA, 1995.
Herrmann, H., Ervens, B., Jacobi, H.-W., Wolke, R., Nowacki, P., and Zellner, R.: CAPRAM2.3: A chemical aqueous phase radi-cal mechanism for tropospheric chemistry, J. Atmos. Chem., 36, 231–284, 2000.
Herrmann, H., Tilgner, A., Barzaghi, P., Majdik, Z., Gligorovski, S., Poulain, L., and Monod, A.: Towards a more detailed description of tropospheric aqueous phase organic chemistry: CAPRAM 3.0, Atmos. Environ., 39, 4351–4363, 2005.
Hilal, S. H., Karickhoff, S. W., and Carreira, L. A.: Prediction of the solubility, activity coefficient and liquid/liquid partition co-efficient of organic compounds, Qsar Comb. Sci., 23, 709–720, 2004.
Hilal S. H., Ayyampalayam S. N., and Carreira, L. A.: Air-liquid partition coefficient for a diverse set of organic compounds: Henry’s law constant in water and hexadecane, Environ. Sci. Technol., 42(24), 9231–9236, 2008.
Hine, J. and Moorkerjee, P. K.: The intrinsic hydrophilic character of organic compounds, Correlations in terms of structural contri-butions, J. Org. Chem., 40, 292–298, 1975.
Jacob D., Gottlieb, E. W. and Prather, M. J.: Chemistry of polluted cloudy boundary layer, J. Geophys. Res.-Atmos., 94, 12975– 13002, 1989.
Kuhne, R., Ebert, R. U., and Schuurmann, G.: Prediction of the temperature dependency of Henry’s law constant from chemical structure, Environ. Sci. Technol., 39(17), 6705–6711, 2005.
Le Henaff, P.: Methodes d’etude et proprietes des hydrates, hemi-acetals et hemithiohemi-acetals derives des aldehydes et des cetones., P. Bull. Soc. Chim. Fr., 11, 4687–4698, 1968.
Legrand, M., Preunkert, S., Wagenbach, D., Cachier, H., and Puxbaum, H.: A historical record of formate and acetate from a high-elevation alpine glacier: Implications for their natural ver-sus anthropogenic budgets at the European scale, J. Geophys. Res.-Atmos., 108(15), 4788, doi:10.1029/2003JD003594, 2003. Legrand, M., Preunkert, S., Galy-Lacaux, C., Liousse, C., and Wagenbach, D.: Atmospheric year-round records of dicar-boxylic acids and sulfate at three French sites located between 630 and 4360 m elevation, J. Geophys. Res., 110, D13302, doi:10.1029/2004JD005515, 2005.
Lelieveld, J., and Crutzen, P. J.: Influences of cloud photochemical processes on tropospheric ozone, Nature, 343, 227–233, 1990. Levine I.N.: Physical Chemistry, fifth edition, McGraw-Hill Higher
Education, New York, USA, 2002.
Lim, H. J., Carlton, A. G., and Turpin, B. J.: Isoprene forms sec-ondary organic aerosol through cloud processing: Model simu-lations, Environ. Sci. Technol., 39(12), 4441–4446, 2005. Lin, S. T., and Sandler, S. I.: Henry’s law constant of organic
com-pounds in water from a group contribution model with multipole corrections, Chem. Eng. Sci., 57, 2727–2733, 2002.
Mackay, D., and Shiu, W. Y.: A critical-review of Henrys law con-stants for chemicals of environmental interest, J. Phys. Chem. Ref. Data., 10, 1175–1199, 1981.
Meylan, W. M. and Howard, P. H.: Bond contribution method for estimating Henry’s law constants, Environ. Toxicol. Chem, 10, 1283–1293, 1991.
Meylan, W. M. and Howard, P. H.: Src’s epi suite, v3.20, Syracuse Research Corporation: Syracuse. NY, 2000.
Perrin, D. D., Dempsey, B., and Serjeant, E. P.: pKa prediction for organic acids and bases, Chapman and Hall, London, UK and New York, USA, 1981.
Pun, B. K., Griffin, R. J., Seigneur, C., and Seinfeld, J. H.: Secondary organic aerosol-2. Thermodynamic model for gas/particule partitioning of molecular constituents, J. Geophys. Res., 107(D17), 4333, doi:10.1029/2001JD000542, 2002. Russell, C. J., Dixon, S. L., and Jurs, P. C.: Computer-assisted study
of the relationship between molecular-structure and Henry Law constant, Anal. Chem., 64, 1350–1355, 1992.
Sander, R.: Compilation of Henry’s law constants for inorganic and organic species of potential importance in environmental chem-istry (Version 3): www.henrys-law.org, 1999.
Saunders, S. M., Jenkin, M. E., Derwent, R. G., and Pilling, M. J.: Protocol for the development of the Master Chemical Mech-anism, MCM v3 (Part A): tropospheric degradation of non-aromatic volatile organic compounds, Atmos. Chem. Phys., 3, 161–180, doi:10.5194/acp-3-161-2003, 2003.
Saxena, P., and Hildemann, L. M.: Water-soluble organics in atmo-spheric particles : a critical review of the literature and appli-cation of thermodynamics to identify candidate compounds, J. Atmos. Chem., 24, 57–109, 1996.
Seinfeld, J. H. and Pandis, S. N.: Atmospheric chemistry and physics, Wiley, New York, USA, 1997.
Walcek, C. J., Yuan, H. H., and Stockwell, W. R.: The influence of aqueous-phase chemical reactions on ozone formation in pol-luted and nonpolpol-luted clouds, Atmos. Environ., 31, 1221–1237, 1997.