ssDNA Pairing Accuracy Increases When
Abasic Sites Divide Nucleotides into Small
Groups
Alexandra Peacock-Villada, Vincent Coljee, Claudia Danilowicz*, Mara Prentiss
Department of Physics, Harvard University, 17 Oxford St., Cambridge, MA 02138, United States of America
Abstract
Accurate sequence dependent pairing of single-stranded DNA (ssDNA) molecules plays an important role in gene chips, DNA origami, and polymerase chain reactions. In many assays accurate pairing depends on mismatched sequences melting at lower temperatures than matched sequences; however, for sequences longer than ~10 nucleotides, single mis-matches and correct mis-matches have melting temperature differences of less than 3°C. We demonstrate that appropriately grouping of 35 bases in ssDNA using abasic sites increases the difference between the melting temperature of correct bases and the melting tempera-ture of mismatched base pairings. Importantly, in the presence of appropriately spaced aba-sic sites mismatches near one end of a long dsDNA destabilize the annealing at the other end much more effectively than in systems without the abasic sites, suggesting that the dsDNA melts more uniformly in the presence of appropriately spaced abasic sites. In sum, the presence of appropriately spaced abasic sites allows temperature to more accurately discriminate correct base pairings from incorrect ones.
Introduction
Several assays depend on the design of single-stranded DNA (ssDNA) molecules that will accu-rately bind to their complementary ssDNA strands [1–3]. In these assays the discrimination between fully complementary sequences and those that contain one or more mismatches depends on the difference between the corresponding melting temperatures. During melting, or thermal denaturation, two single strands become separated due to an increase in tempera-ture [4]. At low temperatures only partial separation takes place till full melting is achieved above the melting temperature, Tm[5]. For matched sequences shorter than ~ 20 base pairs
(bp) the Tmincreases significantly with N [6]; however, Tmeventually approaches an
asymp-totic value [7]. For ~ 35-bp sequences, the presence of mismatches may not change the melting temperature significantly, allowing incorrect sequences to remain bound for long times at tem-peratures where correctly matched pairings are barely stable. Such kinetic trapping can be reduced by using buffers that weaken base pairing [8,9]. Unfortunately, weakened base pairing
OPEN ACCESS
Citation:Peacock-Villada A, Coljee V, Danilowicz C, Prentiss M (2015) ssDNA Pairing Accuracy Increases When Abasic Sites Divide Nucleotides into Small Groups. PLoS ONE 10(6): e0130875. doi:10.1371/ journal.pone.0130875
Editor:Cynthia Gibas, University of North Carolina at Charlotte, UNITED STATES
Received:December 1, 2014
Accepted:May 26, 2015
Published:June 26, 2015
Copyright:© 2015 Peacock-Villada et al. This is an open access article distributed under the terms of the Creative Commons Attribution License, which permits unrestricted use, distribution, and reproduction in any medium, provided the original author and source are credited.
Data Availability Statement:All relevant data are within the paper and its Supporting Information file.
Funding:This work was supported by NIH grant NIH/NIGMS-R01-GM025326 to M.P. (http://www.nih. gov/).
makes stringency more challenging since it also decreases the free energy difference between correctly and incorrectly paired bases.
Part of the problem with temperature based mismatch detection is that long dsDNA does not melt uniformly; instead, regions with weaker base pairing melt at lower temperatures than regions with stronger base pairing. The melting temperature change associated with a mis-match depends not only on the nature of the mismis-match, but also on the composition of nearby bases, as well as the sequence distribution along the entire dsDNA.
Given that some mismatches have melting temperatures that are nearly indistinguishable from correct pairings, development of commercial products that use temperature to accurately detect mismatches require significant investments of time and money to create systems that make the recognition of a particular target much more accurate than the output of individual sequence comparisons. In this work we show that accuracy of individual sequence comparisons can be greatly improved by using probes with appropriately spaced abasic sites in between groups of bases. This improvement in the accuracy of individual sequence comparisons may allow faster and more inexpensive development of assays for sequences for which there are no existing tests.
Materials and Methods
Sample Preparation
Oligodeoxynucleotides (oligos) were synthesized using phosphoramidite chemistry (Integrated DNA Technologies, IDT) and purified by high-performance liquid chromatography. Stable abasic sites in all of the oligonucleotides were introduced using 10,20-Dideoxyribose
modifica-tion (IDT). Each oligo was dissolved in molecular biology grade distilled water at 100μM.
Texas Red and BHQ-1 were used as a fluorophore-quencher couple having been identified as a thermally stable combination providing close to equal fluorescence /quenching over a range from 25 to 90°C while the melting data derived using this couple most closely resembled that of data observed by melting oligonucleotides without attached fluorophores [10]. Measure-ments of fluorophore and quencher couples were performed with 1μM solutions of each
oligo-nucleotide in 10 mM Tris pH = 8.0 and at the NaCl concentrations indicated for each experiment.
Fluorescence
Full fluorescent spectra of the Texas Red fluorophore oligonucleotides and BHQ-1 quencher oligonucleotides were taken from 400 to 700 nm to establish a baseline. Fluorescence readings for each 500μl sample were measured at an excitation wavelength of 596 nm and emission
wavelength of 611 nm with 1-nm slit widths every 1°C/min using a FluoroMax-4 spectrofluo-rometer (Horiba). One data point was taken at each temperature. Both increasing and decreas-ing temperature cycles were taken. The meltdecreas-ing temperature was determined usdecreas-ing two different methods. In one method, Tmderivis the temperature at which the derivative of the
fluorescence versus temperature is a maximum. That method eliminates systematic errors asso-ciated with the inaccurate estimation of the minimal fluorescence. In addition, this technique removes effects associated with constant variations in fluorophore output with temperature since such a slope produces a constant offset in the derivative that does not affect the position of the derivative maximum. In the other method, Tm1/2is the temperature where 50% of the
Results and Discussion
Fig 1Ashows a schematic of some ssDNA pairings used in this work (S1 Table) where each sys-tem consisted of target ssDNA molecules containing no abasic sites (purple). These ssDNA tar-gets were allowed to pair with ssDNA probes containing various numbers of abasic sites (red).
Fig 1A–ishows a probe containing no abasic sites. The cyan bars inFig 1A-ii and 1A-iii high-light the location of the abasic sites which disrupt the stacking between neighboring groups of nucleotides. The molecule inFig 1A-iicontains 7 abasic sites whereas inFig 1A-iiihas only 6; however, in both cases the bases are divided into groups of 4 which are separated by abasic sites.
Fig 1B and 1Cillustrates the experimental schematic for the detection of pairing using a fluorophore/quencher couple consisting of a Texas Red fluorophore and a BHQ-1 quencher. If the two ssDNA molecules are completely paired, the fluorescence signal from the Texas Red fluorophore at the end of one ssDNA will be strongly suppressed due to the proximity of the BHQ-1 quencher on the corresponding end of the other ssDNA. If the two ssDNA molecules are completely separated the fluorescence due to the Texas Red fluorophore will be strong.
Of course assays that rely on fluorophores at the ends of molecules really only detect melting at those molecules’ends. Since a long dsDNA molecule does not usually melt uniformly, it is quite possible that there are temperatures at which one end of the molecule will be melted, while other parts of the molecule remain bound. In these cases, the fluorophore pair at the melted end would not provide accurate information on the complete separation of the two ssDNA molecules. In order to reduce misreporting due to the position of the fluorophore, for each base pairing we conducted two different sets of experiments. In one set of experiments the fluorophore pair was attached to one end of the dsDNA, and in the other set of experiments the fluorophore pair was attached to the other end of the dsDNA. We designated the two types of experiments as R and L measurements, respectively.Fig 1B and 1Cshows the schematic for the R (L) measurements where the BHQ-1 molecule is on the 3´ end of the target (probe) ssDNA, while the Texas Red fluorophore is on the 5´ end of the probe (target) molecule. The sequences for all of the R and L experiments are available in SI, where each base pairing is illus-trated, and the positions of the abasic sites, mismatches, and fluorophores are highlighted.
AsFig 1B and 1Cillustrate, the fluorophores can report melting at an end even if other por-tions of the dsDNA remain bound. In this case, the melting temperature reported by the fluor-ophore pair nearest the mismatch will be lower than the melting temperature reported by the pair that is more distant from the mismatch. For mismatches near the ends of the molecules, this effect is clearly seen in dsDNA that does not contain abasic sites. In particular, mismatches
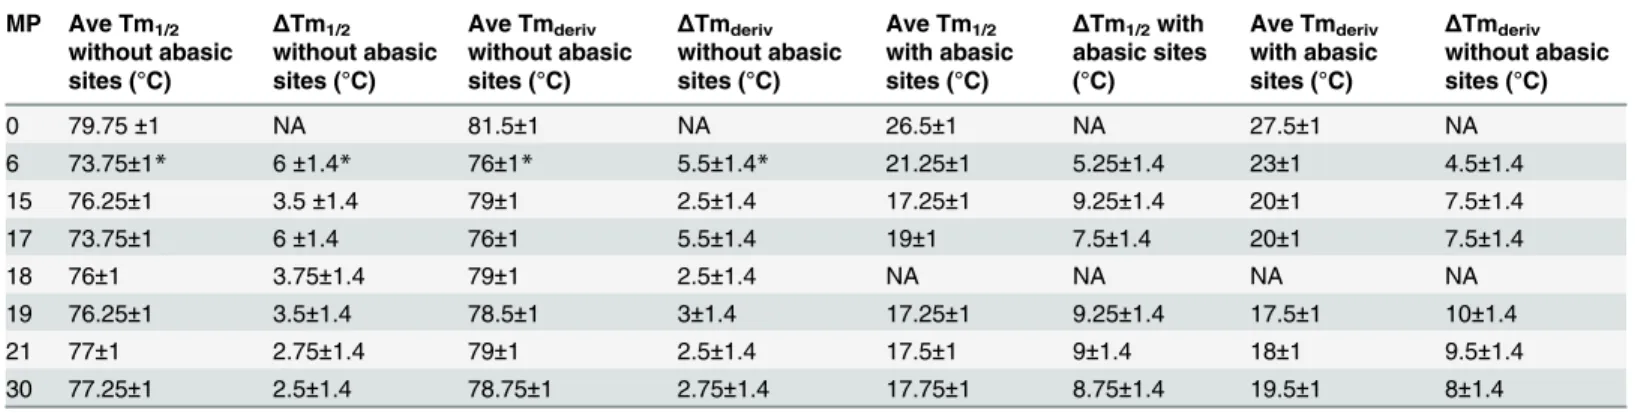
Table 1. Measured Tmvalues found using R experiments on systems without any abasic sites (columns 2–5) and the system with 7 abasic sites dividing the system into 6 groups of 4 bases (columns 6–9).
MP Ave Tm1/2 without abasic sites (°C)
ΔTm1/2
without abasic sites (°C)
Ave Tmderiv without abasic sites (°C)
ΔTmderiv without abasic sites (°C)
Ave Tm1/2 with abasic sites (°C)
ΔTm1/2with
abasic sites (°C)
Ave Tmderiv with abasic sites (°C)
ΔTmderiv without abasic sites (°C)
0 79.75±1 NA 81.5±1 NA 26.5±1 NA 27.5±1 NA
6 73.75±1* 6±1.4* 76±1* 5.5±1.4* 21.25±1 5.25±1.4 23±1 4.5±1.4
15 76.25±1 3.5±1.4 79±1 2.5±1.4 17.25±1 9.25±1.4 20±1 7.5±1.4
17 73.75±1 6±1.4 76±1 5.5±1.4 19±1 7.5±1.4 20±1 7.5±1.4
18 76±1 3.75±1.4 79±1 2.5±1.4 NA NA NA NA
19 76.25±1 3.5±1.4 78.5±1 3±1.4 17.25±1 9.25±1.4 17.5±1 10±1.4
21 77±1 2.75±1.4 79±1 2.5±1.4 17.5±1 9±1.4 18±1 9.5±1.4
30 77.25±1 2.5±1.4 78.75±1 2.75±1.4 17.75±1 8.75±1.4 19.5±1 8±1.4
for sequences with mismatches at position 8 or at position 30, the fluorophore pair nearest the mismatch reports a lower melting temperature than the fluorophore pair more distant from the mismatch; however, in what follows we will show that for the system that is divided by basic sites into 4 bp groups, the two fluorophore pairs report indistinguishable melting temper-atures indicating that the dsDNA melts along the entire length instead of melting locally while preserving base pairing in some other region of the sequence.
Fig 1D and 1Eshows the normalized fluorescence intensity as a function of increasing tem-perature for R measurements.Fig 1Dshows the results for pairing with no abasic sites, which was illustrated inFig 1A-i.Fig 1Eshows the results for the pairing illustrated inFig 1A-ii. The magenta lines indicate the curves for the case where the sequences are perfectly matched. The other colors represent results for the different single mismatches.Fig 1D and 1Eclearly show that the Tmvalues are much higher for the undivided 35 bases than they are for pairings where
the probe ssDNA is divided into groups of 4 by abasic sites.
Though the data inFig 1indicates that including abasic sites has a strong effect on the melt-ing behavior of dsDNA, it is not clear whether the result is due to the mere presence of abasic sites, or whether the grouping of the abasic sites also plays an important role. InFig 1, the
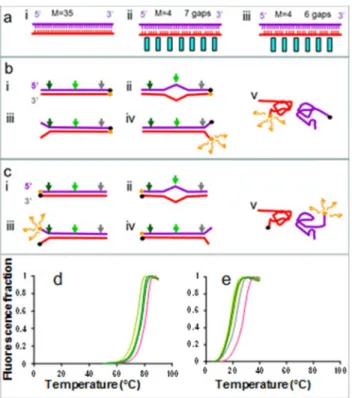
Fig 1. Measurements of the melting temperature, Tm. (a)Schematic of the pairing of the target ssDNA
containing 35 nucleotides (purple) with the ssDNA probe (red), (i) probe with no abasic sites, (ii) and (iii) probes divided by abasic sites into groups with size M. i. M = 4 nt groups. The positions of the abasic sites are highlighted by the cyan rectangles. ii and iii correspond to the same M = 4 value, but have different numbers of abasic sites because they are shifted with respect to each other by 2 bases.(b)Schematic of the melting experiment with R constructs.(c)Schematic of the melting experiment with L constructs. The colored arrows indicate positions of different single isolated mismatches. The black and orange circles indicate the positions of the BHQ-1 and Texas Red fluorophores. Fluorescence is high if the fluorophores are widely separated, but low if they are close. (ii)-(iv) show partial melting and (v) shows full melting.(d)Texas Red fluorescence as a function of temperature in a buffer containing 150 mM NaCl for the system shown in a-i; perfectly matched sequence (magenta) and different single mismatches (green and gray as specified inFig 3).(e)Texas Red fluorescence as a function of temperature in a buffer containing 150 mM NaCl for the system shown in a-ii and same color code as in (d).
sequences are divided into groups of M = 4, separated by abasic sites.Fig 2shows melting curves for larger M values. The results inFig 2clearly indicate that the melting temperatures increase as the group size increases. This is not surprising since the presence of abasic sites must alter stacking interactions. Interestingly, the melting curves for matched base pairings (magenta) are indistinguishable from the melting curves for pairings in which the“ mis-matches”fall on abasic sites (dashed magenta curves). In addition, the melting curves for the two M = 4 systems are very similar even though the position and number of the abasic sites are different for the two cases. Thus, positions of individual mismatched bases could be detected by sliding the position of the abasic sites while maintaining group size.
We used fluorescence vs. temperature curves to determine the melting temperatures, Tm,
for different base pairings. The curves shown inFig 1were obtained by increasing the tempera-ture as a function of time. We obtained melting temperatempera-ture information by cycling the tem-perature up and down. The up and down curves show a systematic shift that depends on the rate at which the temperature was cycled. We checked that the average of the two curves did not shift as a function of cycling rate.Table 1provides a summary of experiments associated with the graphs shown inFig 1.Table 1includes melting temperature measurements based on the measuring of the temperature at which the derivative of the fluorescence curves is a maxi-mum (Tmderiv), as well as measurements based on the temperature at which 50% of the pairing
has melted (Tm1/2). As the table shows, the results for both techniques are very similar. Since
systematic errors in the two techniques differ, this suggests that both techniques are providing accurate reporting to within the reported error.
The numbers shown are the averages (Ave) temperatures in degrees Celsius for up and down curves. The first column is the position of the mismatch, MP. The second and sixth col-umns show the results for Tm1/2measurements that use the half fluorescence point to estimate
Tm. The fourth and eighth columns show the results for Tmderivmeasurements that use
tem-perature at which the derivative of the fluorescence with respect to temtem-perature is a maximum. The third, fifth, seventh, and ninth columns show the differences between the Tmvalue for the
perfect match and the Tmvalue of the corresponding mismatch. The asterisks indicate values
where the R measurements indicated a significantly lower melting temperature than the L experiments, suggesting that the R measurements are invalid.
Fig 1Eshows fluorescence curves for a 35-nt sequence containing 7 abasic sites that separate the nucleotides into groups of 4. Of course, one could distribute the abasic sites differently, so that the nucleotides were divided into larger or smaller groups.Fig 2shows results analogous to those shown inFig 1E, except that the results correspond to systems with different distribu-tions of abasic sites. The M values shown in the Fig correspond to the number of nucleotides that occupy the regions between abasic sites.Fig 2Aiis the same asFig 1E. It corresponds to the R experiment results for the M = 4 case that includes 7 abasic sites. The corresponding sequences are shown in SI under the heading“6 groups with 4 bp each = 7 spacers”.Fig 2Aii
shows the analogous results for the L experiments where the fluorophores are on the end oppo-site to the end used in the R experiments.Fig 2Aiiiis the result for R experiments on a system with M = 4, but only 6 abasic sites. The corresponding sequences are shown in SI under the heading“7 groups with 4 bp each = 6 spacers”. All three sets of results are very similar, asFig 3
illustrates. Thus, Tmmeasurements are not distorted by using fluorophore pairs at the ends of
the molecules, and what is relevant is not the number of abasic sites, but the size of the nucleo-tide groups into which the abasic sites are divided.
In order to determine the effects of single base pair mismatches on Tm, we calculatedΔTm,
the difference between the Tmfor the perfect match and the Tmfor pairing with different single
are indicated by the colored letters directly below the original target sequence. The cyan rectan-gle indicates the GC-rich clamp which is the most stably bound region. The color of the curves
Fig 2. Measurements of the melting temperature, Tm, for sequences divided by abasic sites into groups with size M for the same experimental conditions used to obtain the data inFig 1. (a)M = 4 results where i is the same asFig 1D, ii is the L result for the same system, and iii is the R result for the system shown in main textFig 1A-iiiwhere the abasic sites are shifted by two with respect to the system shown in i and ii.(b)Analogous results for a system with M = 6. For the M = 6 system that is shifted, some single mismatches fall on an abasic site. Curves corresponding to mismatches on abasic sites are shown as magenta dashed lines. The results are in very good agreement with the perfect match.(c)Analogous results for a system with M = 8.(d)Analogous result for an undivided probe.
doi:10.1371/journal.pone.0130875.g002
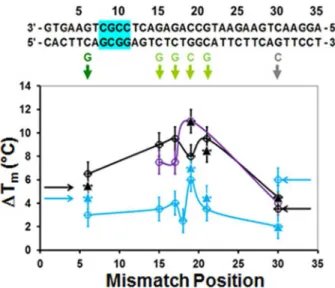
Fig 3.ΔTmas a function of the position of single mismatches.The sequence is shown at the top of the
figure The single base pair mismatch replacements are shown below in colors corresponding to the colors of the curves shown inFig 1D and 1E. The cyan, black, and purple lines and symbols correspond to the systems shown inFig 1i, ii, and iii, respectively. The solid triangles represent the L data. The hollow circles correspond to the R data. The solid lines connect the data points from R measurements, except for the Tm
mismatch at position 30, which is derived from the L data. The arrows on the right (left) side of the graph indicate Tmvalues calculated from R (L) measurements for a mismatch at position 30(8). For the undivided
probe, the fluorophore pair nearest the mismatch separates at a significantly lower temperature than the true Tm, but for the divided probe the ends melt at the true Tm.
inFig 1D and 1Ecorresponds to the color of the letters and colored arrows highlighting the corresponding mismatches inFig 3The results for L measurements are shown inFig 2Aii.
Fig 3shows graphs ofΔTmas a function of mismatch position for the three pairings
illus-trated inFig 1A-i(cyan), ii (black), and iii (purple). The hollow circles and the solid triangles correspond to the Tmvalues determined by the R and L measurements, respectively. The lines
connect the Tmvalues for R measurements, with the exception of the mismatch at position 30
which is taken from the L measurements to avoid artifacts associated with the melting of the ends.
Fig 3shows that the probes illustrated inFig 1A-ii and 1A-iiihave similarΔTmvalues even
though they have different numbers of abasic sites which are located in different positions, sug-gesting that it is the group size that is important rather than the position of the abasic sites. In addition, the similarity between the results for the two systems containing different numbers of abasic sites shows that the position of the mismatch within a 4-bp group does not have a signif-icant effect onΔTm. Furthermore, theΔTmvalues for the systems containing the abasic sites
are consistently larger than those for the undivided 35-nt probe, and the standard deviation values between theΔTmvalues are smaller for the system containing the abasic sites than for
the undivided 35-nt probe. Importantly, for the system with the abasic sites variations for mis-matches near the center of the molecule are much smaller than the variation for the undivided probe. Finally, for the system divided by abasic sites, the half fluorescence temperatures for the mismatches nearest the fluorophores are the same for both the R and L measurements indicat-ing that the entire molecule melts at almost the same temperature, whereas the results for the undivided 35-bp DNA show that the ends open at a temperature well below Tm.
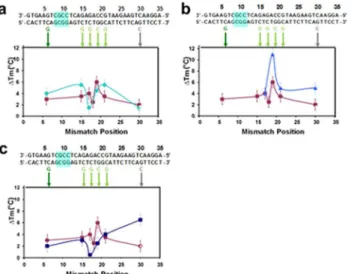
Analogous results for probes divided into larger groups are shown inFig 4. That figure shows that the insertion of abasic sites does not enhance mismatch detection if the spacing between the basic sites is too large. The top row corresponds to results for M = 6, whereFig 4A and 4Bcorrespond to the melting curve data shown inFig 2Bi and 2Biii, respectively. The
Fig 4. Effect of M on melting curves: differences between theΔTmfor a perfectly matched 35 bp sequence with and without abasic sites and various single bp mismatches in 150 mM NaCl.The sequence is shown in black at the top of the figure. The mismatches are shown below the sequence. In all graphs, the purple squares correspond to a 35 bp sequence without abasic sites for the R data except for the mismatch at position 30 which was taken from the L data.(a)Results for 35 bp sequence with 5 abasic sites where M = 6 (aqua circles).(b)Results for another case where M = 6 shifted by two base pairs from the system shown in (a) (blue triangles).(c)Results for 35-bp sequences with 3 abasic sites where M = 8 (dark blue squares).
results inFig 4Ashow no significant improvement over results in the absence of abasic sites, and the results shown inFig 4Bare somewhat worse than the undivided result. The results in
Fig 4Ccorrespond to the M = 8 results shown inFig 2C. Like the M = 6 results, the M = 8 results are not an improvement over the undivided system. For the M = 8 results the highΔTm
is an artifact due to partial melting near the fluorophore, indicating that by M = 8 the melting along the length of the dsDNA is no more uniform than it was for the case without abasic sites. Thus, the data shown inFig 4highlights the importance of dividing the nucleotides into small groups.
So far we have considered the melting temperatures for different annealing experiments. We also investigated a base pairing assay based on the change in fluorescence with temperature that oscillates in the temperature region where the mismatches have melted out, but the correct match continues to show some base pairing. This technique offers an oscillating fluorescence signal that can increase the accuracy of the discrimination between matched and mismatched pairings. Heterodyne detection can be used to increase the signal to noise in such experiments. We performed these experiments for base pairings whose fluorescence curves are shown inFig 1D and 1E. We compared the results for the mismatches that were least detectable in each sys-tem. For the abasic system shown inFig 1Aii, this is the mismatch at position 30 for the M = 4 abasic, whereas for the system without abasic sites the mismatch at position 6 is the hardest to detect. Experiments on the annealing in the absence of abasic sites show that oscillating the temperature between 83 and 87°C produces a fluorescence that oscillates between 100% of peak fluorescence and 98% of peak fluorescence in the base pairing with a mismatch at position 30, whereas the perfect match oscillates between 100% and 92% of peak fluorescence. The dif-ference in the oscillation amplitude for the correct match and the nearest mismatch was ~ 6%. In contrast, the system with M = 4 with a mismatch at position 6, oscillating between 41 and 36°C produces fluorescence values oscillating between 100% and 99% of peak fluorescence, whereas the perfect match oscillates between 100% and 76% of peak fluorescence. The differ-ence in the oscillation amplitude for the correct match and the nearest mismatch was ~ 23%. Thus, the fluorescence difference in the abasic system is more than 3x larger than the difference in the system without abasic sites.
As demonstrated in this paper, grouping the nucleotides in the ssDNA probe into 4 nt groups separated by abasic sites can greatly improve mismatch detection by making theΔTm
values for different mismatches larger and more consistent than the values for undivided probes. We propose that separating the bases in the ssDNA into groups of 4 nucleotides using abasic sites has the following effects: 1. It significantly reduces the melting temperatures. 2. It makes samples melt more uniformly because no clamp can extend more than 4 bp whereas an undivided system can have much longer clamps which may remain paired at temperatures where mismatches have destabilized pairing in other regions of the sequence. 3. It allows a sin-gle mismatch to strongly destabilize an entire group since any sinsin-gle mismatch and its neigh-bors make up at least half of the nucleotides within a group. The last suggestion is consistent with experimental results that showed that a single base can significantly destabilize a sequence with a length of up to ~ 7 nt [11], so one would expect discrimination to improve for groups containing fewer than 7 bp. We propose that this explains whyΔTmis insensitive to the
posi-tion of the mismatch within an individual 4-base pair group as well as the posiposi-tion within the 35 nt sequence.
systems without abasic sites because even mismatches near the middle show a large variation inΔTm. Systems that work at lower temperatures and are less sensitive to temperature should
be easier to build and less expensive. Thus, the incorporation of abasic site in probe sequences may make the development of new base pairing assays faster and less expensive, increasing the range of applications in which base pairing assays are commercially viable.
Supporting Information
S1 Table. Sequences used in this work.The table shows the sequences used in the R and L pairing experiments.
(DOCX)
Acknowledgments
Research was supported by NIH grant NIH/NIGMS-R01-GM025326 to M.P. and Nancy Kleckner.
Author Contributions
Conceived and designed the experiments: VC MP. Performed the experiments: APV CD. Ana-lyzed the data: APV VC CD MP. Contributed reagents/materials/analysis tools: APV VC CD. Wrote the paper: VC CD MP.
References
1. Gorreta F, Carbone W, Barzaghi D. Genomic profiling: cDNA arrays and oligoarrays. Methods Mol Biol 2012; 824: 89–105.
2. Nangreave J, Han D, Liu Y, Yan H. mDNA origami: a history and current perspective. Curr Opin Chem Biol 2010; 14: 608–615. doi:10.1016/j.cbpa.2010.06.182PMID:20643573
3. Baumforth KR, Nelson PN, Digby JE, O'Neil JD, Murray PG. Demistified. . .the polymerase chain reac-tion. Mol Pathol 1999; 52: 1–10. PMID:10439832
4. SantaLucia J Jr, Allawi H, Seneviratne PA. Improved nearest-neighbor parameters for predicting DNA duplex stability. Biochemistry 1996; 35: 3555–3562. PMID:8639506
5. Bar A, Kafri Y, Mukamel D. Dynamics of DNA melting. J Phys Condens Matter 2009; 21: 034110. doi: 10.1088/0953-8984/21/3/034110PMID:21817255
6. Wallace RB, Shaffer J, Murphy RF, Bonner J, Hirose T, Itakura K. Hybridization of synthetic oligodeox-yribonucleotides to phi chi 174 DNA: the effect of single base pair mismatch. Nucleic Acids Res. 1979; 6: 3543–3557. PMID:158748
7. Howley PM, Israel MA, Law MF, Martin MA. A rapid method for detecting and mapping homology between heterologous DNAs. Evaluation of polyomavirus genomes. J Biol Chem 1979; 254: 4876– 4883. PMID:220264
8. SantaLucia J Jr, Hicks D. The thermodynamics of DNA structural motifs. Ann Rev Biophys Biomol Struct 2004; 33: 415–440.
9. Owczarzy R, Moreira BG, You Y, Behlke MA, Walder JA. Predicting stability of DNA duplexes in solu-tions containing magnesium and monovalent casolu-tions. Biochemistry 2008; 47: 5336–5353. doi:10. 1021/bi702363uPMID:18422348
10. You Y, Tataurov AV, Owczarzy R. Measuring thermodynamic details of DNA hybridization using fluo-rescence. Biopolymers 2011; 95: 472–486. doi:10.1002/bip.21615PMID:21384337