http://www.uem.br/acta ISSN printed: 1679-9275 ISSN on-line: 1807-8621
Acta Scientiarum
Doi: 10.4025/ actasciagron.v34i3.13326
Tillering of two wheat genotypes as affected by phosphorus levels
Samuel Luiz Fioreze1*, Gustavo Castoldi1, Laércio Augusto Pivetta1, Laerte Gustavo Pivetta1,
Dirceu Maxinimo Fernandes2 and Leonardo Theodoro Büll2
1
Departamento de Produção Vegetal, Faculdade de Ciências Agronômicas, Universidade Estadual Paulista “Júlio de Mesquita Filho”, Fazenda
Experimental Lageado,1780, 18603-970, Botucatu, São Paulo, Brazil. 2Departamento de Recursos Naturais - Ciência do Solo, Faculdade de
Ciências Agronômicas, Universidade Estadual Paulista “Júlio de Mesquita Filho”, Botucatu, São Paulo, Brazil. *Author for correspondence. E-mail: [email protected]
ABSTRACT. Tillering plays an important role in wheat yield potential and it is affected by genotype and environmental conditions. This work aimed to study the effects of phosphorus levels on tiller emergence, survival and contribution to yield potential of two wheat cultivars. The experiment was carried out under greenhouse conditions in Botucatu, São Paulo State, Brazil. A 2 x 5 factorial randomized block design with four replications was applied. Two wheat cultivars (IAC 370 and IAC 375) and five phosphorus levels (0, 150, 300, 450 and 600 mg dm-3) were evaluated in pots with 10 dm3 of a clayey Oxisol. Higher P levels
increased tiller emergence, survival and yield, especially for secondary tillers. Tiller abortion levels were higher in IAC 370 cultivar whereas retention of formed tillers was higher in IAC 375.
Keywords:Triticum aestivum, yield potential, dry matter accumulation, tiller survival.
Perfilhamento de dois genótipos de trigo em função de doses de fósforo
RESUMO. A participação de perfilhos na produção de grãos é de grande importância para a cultura do trigo, sendo influenciável pelas características do genótipo e condições do ambiente. O presente trabalho teve o objetivo de estudar o efeito de doses de fósforo (P) na emissão, sobrevivência e contribuição produtiva de perfilhos de duas cultivares de trigo. O experimento foi conduzido em casa de vegetação em Botucatu, Estado de São Paulo. Foi adotado um esquema fatorial 2 x 5 em blocos casualizados com quatro repetições, sendo avaliadas duas cultivares de trigo (IAC 370 e IAC 375) e cinco doses de P (0, 150, 300, 450 e 600 mg dm-3). Quanto maior a dose de P, maior a emissão, a sobrevivência e a participação de perfilhos na
produção total de grãos, em especial para perfilhos secundários. A cultivar IAC 370 apresentou altas taxas de abortamento de perfilhos, enquanto a IAC 375 manteve grande parte dos perfilhos emitidos.
Palavras-chave:Triticum aestivum, potencial produtivo, acúmulo de matéria seca, sobrevivência de perfilhos.
Introduction
Tiller emergence, development and survival are extremely important in wheat, since tillers represent the main quantitative components in grain yield (ALVES et al., 2000, 2005; VALÉRIO et al., 2008, 2009). Mundstock (1999) points out that the contribution of non-fertile tillers is the main cause of low wheat yields in Brazil. There is a relationship between the main stem and tillering, which influences the number of fertile tillers in cereals. Also, it is affected by environmental conditions during the initiation of tiller primordia and subsequent development stages (ALMEIDA; MUNDSTOCK, 2001).
Tillering may positively or negatively influence wheat yield depending on environmental resources availability such as water, light and nutrients (ELHANI et al., 2007). Phosphorus fertilization has great influence on wheat yield (TAKAHASHI ; ANWAR,
2007) and its deficiency has been reported as one of the main reasons for reduced number of tillers (PRYSTUPA et al., 2003). Phosphorus availability seems to be the main influence on wheat ability to differentiate and expand leaves and tillers (VALLE; CALDERINI,2010).
Distinct species and individuals within the same species differ in P uptake and efficiency use (LI et al., 2007). Plants cropped under P deficiency may develop many adaptation strategies. Tolerance to low levels of available P depends on genotype capacity to efficiently absorb, distribute and use this nutrient for biomass production. This is established by morphological and physiological characteristics as well as by nutrient requirements (ESPINDOLA et al., 2009).
phosphorus levels on tiller emergence, survival and contribution to yield potential of two wheat cultivars.
Material and methods
The experiment was carried out in greenhouse at Faculdade de Ciências Agronômicas (FCA/UNESP), Botucatu, São Paulo State, Brazil. Polyethylene pots were filled with 10 dm3 of a clayey Rhodic Hapludox
(FAO, 2006). Soil physical and chemical analysis showed the following results: clay: 455.0 g kg-1, organic
matter: 26.0 g dm-3; pH (CaCl
2): 4.0; Ca, Mg, Al and
K: 12.0, 3.0, 14.0 and 0.5 cmolc dm-3, respectively; base
saturation: 14% and P (resin): 33.9 mg dm-3. This P
soil content is considered great to annual crops as wheat (EMBRAPA, 2010).
Experimental design was randomized complete block arranged as a 2 x 5 factorial, with four replications. Two wheat cultivars (IAC 370 and IAC 375) were evaluated in combination with five P levels (0, 150, 300, 450 and 600 mg dm-3). The cultivars are
adapted to crop conditions of region, have high yield potential and medium to late cycle (125 to 135 days). The experiment was conducted in duplicate; one of them aimed the evaluation of biometric characteristics (destructive analysis) at anthesis stage and the other was carried out for yield components evaluation.
Soil dolomitic liming had the objective of raising base saturation up to 70%. Base fertilization was mixed with the soil and consisted of 180 mg dm-3 of
potassium chloride (60% of K2O) plus the
pre-established P levels applied as triple superphosphate (44% of P2O5). Side dressing nitrogen fertilization took
place 2, 17 and 32 days after seedling emergence (DAE) and consisted of urea (45% of N) applied via solution (25 mg dm-3 of N). In each pot, 10 seeds were sown at
3-cm depth. Thinning was performed 10 DAE and two plants were grown per pot.
The number of tillers produced by each plant was counted every 7 days during tillering stage, which corresponded to the second stage in Feeks’ scale (LARGE, 1954). Right after their emergence, different classes of tillers were identified by colored cotton threads according to Masle (1985). Tillers were named as A, followed by the number of the leaf in which the node originated one specific tiller from, i.e., MS – main stem; A0 – tiller originated from the node of the coleoptile; A1 – tiller originated from the node of the first leaf in the main stem; Anth – tiller originated from the node of the nth
leaf in the main stem.
Dry matter accumulation of main stem and tillers was evaluated in the beginning of anthesis stage. Grain production of main stem and tillers was determined in the end of growth cycle as well as tiller survival and contribution to dry matter accumulation and total yield. Data was submitted to
variance analysis by the F test (p < 0.05). Cultivar means were compared by the Tukey test (p < 0.05) and P levels by regression analysis.
Results and discussion
Wheat plants grown with no P fertilization (0 mg dm-3) showed reduced development and total
inhibition of tiller emergence, even with great soil P levels. Therefore, this treatment was not statistically evaluated as a variable related to tiller emergence or contribution to yield. This exclusion provided better equation fitting and understanding of the results.
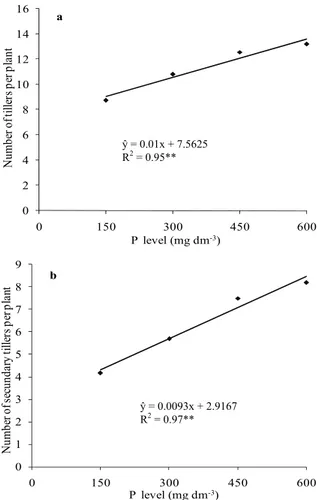
Tiller emergence of both cultivars was linearly increased by P levels (Figure 1a). The total number of tillers increased due to higher emergence rate of secondary tillers (Figure 1b), once the number of primary tillers was not affected by P levels. Wheat cultivars did not differ for the emergence of primary tillers, fertilized with any P levels. So, genotypes showed distinct tillering potential due to emergence variations of secondary tillers (Table 1).
y = 0,01x + 7,5625 R2= 0,95**
0 2 4 6 8 10 12 14 16
0 150 300 450 600
N
u
m
b
er
o
f t
ille
rs
p
er
p
la
n
t
es
p
aç
o
P level (mg dm-3)
a
y = 0,0093x + 2,9167 R2= 0,97**
0 1 2 3 4 5 6 7 8 9
0 150 300 450 600
N
u
m
b
er
o
f s
ec
u
n
d
ar
y
tille
rs
p
er
p
la
nt
es
p
P level (mg dm-3)
b
Figure 1. Total number of tillers (a) and number of secondary tillers (b) of wheat plants affected by phosphorus levels, means of cultivars IAC 370 and IAC 375. Botucatu, São Paulo State, Brazil, 2010. **Significant by the F test (p < 0.01).
ŷ = 0.01x + 7.5625 R2 = 0.95**
Wheat tillering affected by phosphorus 333
Table 1. Number of secondary tillers per wheat plant, cultivars IAC 370 and IAC 375 (mean of P levels). Botucatu, São Paulo State, Brazil, 2010.
Number of secondary tillers per plant
IAC 370 7.77 a
IAC 375 5.00 b
CV (%) 19.32
Means followed by the same letter in the column do not differ by the Tukey test (p < 0.05).
Whenever resources supplied by the cropping environment are not limited, maximum tiller emergence is observed depending on genotype potential and each axillary leaf bud shows full potential for tiller emergence (ALVES et al., 2000, 2005). However, competition among plants for environmental resources is decisive in tiller emergence (OZTURK et al., 2006). Both cultivars studied in this experiment may have showed different potentials in tiller emergence or P uptake and efficiency use. According to Camargo (1984), P efficiency use by wheat genotypes may be detected at the beginning of the development of the plants. Yaseen and Malhi (2010) noticed that wheat genotypes with high P uptake efficiency show higher root activity, tiller emergence rate and P accumulated in grains.
Reduced P availability delays the beginning of tiller emergence stage (VALLE; CALDERINI, 2010), which is the characteristic most affected by P deficiency in wheat (CRALLE et al., 2003; YASEEN; MALHI, 2010) and barley (Hordeum vulgare spp. distichum L.) (PRYSTUPA et al., 2003). Cralle et al. (2003) observed that increasing P supply favored emergence of viable tillers in wheat plants even under severe conditions of competition (1:1) with Lolium multiflorum. Prystupa et al. (2003) showed that the negative effects of reducing P availability on wheat tillering are more significant than decreasing N supply. The P availability also affects the tillering in others crops, such as the forage palisadegrass (Brachiaria brizanta) (KUWAHARA; SOUZA, 2009).
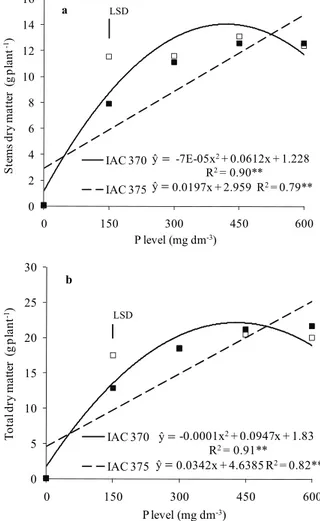
Stems and total dry matter accumulation in IAC 375 was linearly increased by P levels (Figure 2a and b). For the IAC 370 cultivar, stems and total dry matter accumulation was maximum with the application of 419 and 427 mg dm-3 of P,
respectively. Both genotypes significantly differed as for dry matter accumulation only when 150 mg dm-3
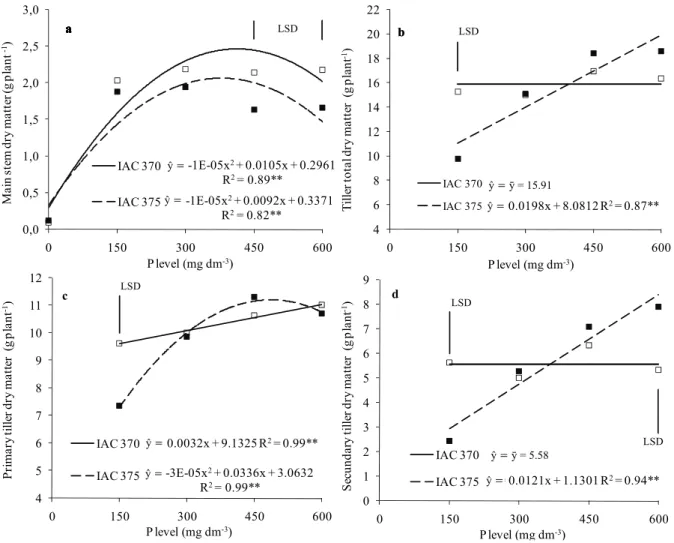
of P was applied (Figure 2a and b). Dry matter accumulation in the main stem was significant influenced by P levels; quadratic fitting showed maximum accumulation with the application of 382 and 404 mg dm-3 in IAC 375 and IAC 370,
respectively (Figure 3a). Although reserve accumulation in the main stem may have decreasedin both genotypes with higher P levels, this reduction was more accentuated in IAC 375 (Figure 3a). This decrease may have occurred due to competition between the main stem and tillers at higher P levels. As already mentioned, IAC 375 cultivar showed reduced tiller emergence compared to IAC 370. Nevertheless, dry matter accumulation in IAC 375 tillers was significantly increased by P levels (Figure 3b, c and d), which shows a more improved balance between tiller emergence and assimilate accumulation of this genotype. Increasing P levels only significantly influenced dry matter accumulation in IAC 370 primary tillers (Figure 3c), which characterizes prioritization of assimilate accumulation in this tiller class.
LSD
y = -7E-05x2+ 0.0612x + 1.228
R2= 0.90**
y = 0.0197x + 2.959 R2= 0.79**
0 2 4 6 8 10 12 14 16
0 150 300 450 600
St
em
s dr
y m
a
tt
er
(
g
p
lan
t
-1)
P level (mg dm-3)
IAC 370
IAC 375
a
LSD
y = -0.0001x2+ 0.0947x + 1.83 R2= 0.91**
y = 0.0342x + 4.6385 R2= 0.82** 0
5 10 15 20 25 30
0 150 300 450 600
T
o
ta
l d
ry
m
a
tte
r
(g
p
la
n
t
-1)
P level (mg dm-3) IAC 370
IAC 375 b
Figure 2. Stems (a) and total (b) dry matter of wheat plants (cultivars IAC 370 and IAC 375) affected by phosphorus levels. Botucatu, São Paulo State, Brazil, 2010. **Significant by the F test (p < 0.01). Vertical bars indicate the least significant difference (LSD) between cultivars for each P rate by the Tukey test (p < 0.05).
ŷ =
ŷ =
ŷ =
LSD
y = -1E-05x2+ 0.0105x + 0.2961 R2= 0.89**
y = -1E-05x2+ 0.0092x + 0.3371 R2= 0.82**
0,0 0,5 1,0 1,5 2,0 2,5 3,0
0 150 300 450 600
M a in ste m d ry m a tte r ( g p la n t -1)
P level (mg dm-3) IAC 370 IAC 375 a a a a a a LSD
y = 0.0032x + 9.1325 R2= 0.99**
y = -3E-05x2+ 0.0336x + 3.0632 R2= 0.99**
4 5 6 7 8 9 10 11 12
0 150 300 450 600
P rim a ry t ille r d ry m a tte r (g p la n t -1)
P level (mg dm-3) IAC 370
IAC 375 c
LSD
LSD
y = 0.0121x + 1.1301 R2= 0.94** y = 5.58
0 1 2 3 4 5 6 7 8 9
0 150 300 450 600
S ec u n d a ry t ille r d ry m a tt er (g p la n t -1)
P level (mg dm-3) IAC 370
IAC 375 d
LSD
y = 0.0198x + 8.0812 R2= 0.87** y = 15.91
4 6 8 10 12 14 16 18 20 22
0 150 300 450 600
T ille r t o ta l d ry m a tt er ( g p la n t -1)
P level (mg dm-3)
IAC 370
IAC 375 b
b
Figure 3. Main stem dry matter (a), tiller total dry matter (b), primary tiller dry matter (c) and secondary tiller dry matter (d) of wheat plants (cultivars IAC 370 and IAC 375) affected by phosphorus levels. Botucatu, São Paulo State, Brazil, 2010. **Significant by the F test (p < 0.01). Vertical bars indicate the least significant difference between cultivars for each P rate by the Tukey test (p < 0.05).
Higher number of tillers was formed by IAC 370 (Table 1). However, this cultivar showed dry matter accumulation similar to IAC 375 that showed higher contribution of tiller dry matter to the total (Figure 4a and b). Average and total contribution of IAC 370 tillers in dry matter accumulation was not affected by P levels. Average contribution of IAC 375 tillers was linearly decreased by P levels; at 150 and 300 mg dm-3 levels, IAC 375 tiller contribution was higher
than IAC 370. At those P levels, IAC 375 showed better dry matter distribution between the main stem and tillers possibly due to compensatory mechanisms for the lower number of emerged tillers; therefore, wheat cultivars did not differ as for total contribution of tillers to dry matter accumulation (Figure 4b). Balanced development between the main stem and tillers is extremely important for maintaining tillering yield potential, considering that tillers with low assimilate accumulation tend to be aborted or show low grain yield (ALVESet al.,2000).
Dry matter accumulation in the main stem of wheat plants shows significant correlation with soluble sugar levels, which in turn correlate to grain yield (EHDAIE et al., 2008). High assimilate availability right before anthesis may increase flower fertility and, consequently, the number and size of seeds as well as grain filling capacity (EGLI; BRUENING, 2002). There are two main photoassimilate sources for developing grains: one directly originated from photosynthesis and another from photoassimilate remobilization previously stored in other plant organs, mainly stems. The proportion between those two vary according to genotype and cropping conditions (INOUE et al., 2004).
Grain yield of both cultivars was linearly increased by P levels (Figure 5a). Grain yield of the main stem was not influenced by P fertilization; nevertheless, higher grain yield occurred due to a positive contribution of tiller yield (Figure 5b), mainly secondary ones (Figure 5c). Yield of primary tillers did not
ŷ=ȳ = 5.58
Wheat tillering affected by phosphorus 335
respond to P levels. Secondary tillers may have responded significantly to P fertilization because of their less privileged location in the main stem compared to primary tillers. Therefore, whenever
environmental conditions are limited, vegetative and productive development of wheat plants priority occur in the main stem, followed by primary and secondary tillers.
LSD
y = -0.0155x + 15.103 R2= 0.93**
y = 7.04
0 2 4 6 8 10 12 14 16 18
0 150 300 450 600
A
ve
ra
g
e
ti
ll
er
c
ont
ri
bu
ti
on
(
%
)
P level (mg dm-3)
IAC 370
IAC 375
a
LSD
y = 0.0235x + 73.521 R2= 0.80**
y = 83.3
50 55 60 65 70 75 80 85 90 95
0 150 300 450 600
T
ot
a
l t
il
le
r
co
nt
ri
bu
ti
on
(
%
)
_
P level (mg dm-3)
IAC 370
IAC 375
b
Figure 4. Average (a) and total (b) tiller contribution to dry matter accumulation in wheat plants (cultivars IAC 370 and IAC 375) affected by phosphorus levels. Botucatu, São Paulo State, Brazil, 2010. **Significant by the F test (p < 0.01). Vertical bars indicate the least significant difference between cultivars for each P rate by the Tukey test (p < 0.05).
Figure 5. Grain mass per plant (a), grain mass in tillers (b) and grain mass in secondary tillers (c) of wheat plants affected by phosphorus levels, means of cultivars IAC 370 and IAC 375. Botucatu, São Paulo State, Brazil, 2010. **Significant by the F test (p < 0.01).
ŷ= 0 . 011 x + 8 . 5719 R 2= 0 . 84 **
0 2 4 6 8 10 12 14 16
0 150 300 450 600
Grain
mass in tille
rs
-1 ) espaço
P level (mg dm -3)
b
ŷ= 0.0087 x + 0.8946 R2= 0.97**
0 1 2 3 4 5 6 7
0 150 300 450 600
Grain
mass in seco
ndary tillers
espa
P level (mg dm-3)
c
ŷ = 0 . 0261 x + 4.4568 R 2= 0 . 78**
0 5 10 15 20 25
0 150 300 450 600
Gr
ain
m
ass
(
g
plant
-1 )
-1 )
P level (mg dm -3)
a
ŷ = ȳ = 7.04 ŷ= ȳ = 83.3
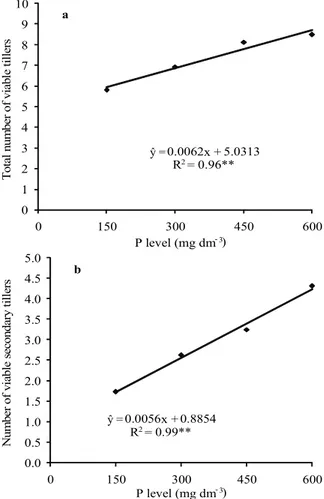
Grain yield of wheat plants is determined by ear yield components, number of ears per plant or per area unit. In this research, grain yield per plant was increased by higher P availability actually because P levels reflected on the number of viable ears per plant (Figure 6a). The number of viable tillers in both cultivars was increased by P supply; however, this was only found due to higher number of viable secondary tillers (Figure 6b), once the number of primary tillers had not been affected. IAC 375 cultivar has proved to be highly efficiency to maintaining tiller viability and showed survival levels significantly higher than IAC 370 regardless of P fertilization (Table 2).
y = 0.0062x + 5.0313 R2= 0.96**
0 1 2 3 4 5 6 7 8 9 10
0 150 300 450 600
P level (mg dm-3)
a
T
o
ta
l
n
u
m
b
er
o
f v
ia
b
le
ti
ll
e
rs
y = 0.0056x + 0.8854 R2= 0.99**
0.0 0.5 1.0 1.5 2.0 2.5 3.0 3.5 4.0 4.5 5.0
0 150 300 450 600
b
P level (mg dm-3)
N
u
m
b
er
o
f v
ia
b
le
s
ec
o
n
d
ar
y
ti
lle
rs
Figure 6. Total number of viable tillers (a) and number of viable secondary tillers (b) of wheat plants affected by phosphorus levels. Botucatu, São Paulo State, Brazil, 2010. **Significant by the F test (p < 0.01).
Table 2. Number of viable tillers (NVT), number of viable primary tillers (NVPT) and number of viable secondary tillers (NVST) in wheat plants, cultivars IAC 370 and IAC 375 (means of P levels). Botucatu, São Paulo State, Brazil, 2010.
NVT NVPT NVST
IAC 370 6.84 b 4.21 b 2.68 b IAC 375 7.84 a 4.72 a 3.68 a
CV (%) 9.84 12.27 25.66
Means followed by the same letter in the column do not differ by the Tukey test (p < 0.05).
Although IAC 370 has formed great number of tillers, abortion levels were equally high. Still, IAC 375 showed higher number of viable tillers but it did not differ from IAC 370 as for grain yield per plant. This probably occurred due to adjustment of individual grain mass values for IAC 370 ears (Table 3). One possible explanation is that photoassimilate and nutrients accumulated in tillers may be redistributed to other parts of the plant, in case they become non-viable. Depending on genotype and environmental conditions, they might work as temporary organs for reserve accumulation during plant development, contributing to maintaining yield potential.
Table 3. Grain mass per ear (GMPE) and in the main stem (GMMS) of wheat plants, IAC 370 and IAC 375 (means of P levels). Botucatu, São Paulo State, Brazil, 2010.
GMPE (g) GMMS (g) IAC 370 1.70 a 2.99 a IAC 375 1.38 b 2.49 b
CV (%) 15.37 13.51
Means followed by the same letter in the column do not differ by the Tukey test (p < 0.05).
Average contribution of IAC 370 and IAC 375 tillers in total grain yield was decreased by P levels (Figure 7), clearly due to increasing number of viable tillers per plant. Total grain yield is uniformly distributed between the main stem and tillers. So, increasing the number of viable tillers per plants may dilute individual contribution of the main stem and tillers, also increasing yield stability.
LSD
LSD
y = -0.0106x + 16.402 R2= 0.77 **
y = -0.008x + 13.687 R2= 0.97**
0 2 4 6 8 10 12 14 16 18 20
0 150 300 450 600
A
v
er
age
t
iller
co
n
tr
ibu
ti
o
n
t
o
g
rai
n
y
ield
(%
)
P level (mg dm-3) IAC 370
IAC 375
Figure 7. Average tiller contribution to final grain yield in wheat plants (cultivars IAC 370 and IAC 375) affected by phosphorus levels. Botucatu, São Paulo State, Brazil, 2010. **Significant by the F test (p < 0.01). Vertical bars indicate the least significant difference between cultivars for each P rate by the Tukey test (p < 0.05).
ŷ =
ŷ=
ŷ=
Wheat tillering affected by phosphorus 337
Conclusion
Higher tiller emission, survival and yield in wheat are obtained with increasing P levels, mainly for secondary tillers.
IAC 375 cultivar show higher dry matter accumulation in secondary tillers in response to P fertilization.
IAC 370 cultivar show higher tiller abortion whereas retention of formed tillers was higher in IAC 375.
The number of viable tillers per plant in wheat is more associated to individual reserve accumulation than total number of emerged tillers.
References
ALMEIDA, M. L.; MUNDSTOCK, C. M. A qualidade da luz afeta o afilhamento em plantas de trigo, quando cultivadas sob competição. Ciência Rural, v. 31, n. 3, p. 401-408, 2001.
ALVES, A. C.; MUNSTOCK, C. M.; MEDEIROS, J. D. Sistema vascular e controle do desenvolvimento de afilhos em cereais de estação fria. Revista Brasileira de Botânica, v. 23, n. 1, p. 59-67, 2000.
ALVES, A. C.; MUNSTOCK, C. M.; MEDEIROS, J. D. Iniciação e emergência de afilhos em cereais de estação fria. Ciência Rural, v. 35, n. 1, p. 39-45, 2005.
CAMARGO, C. E. O. Efeito de diferentes níveis de fósforo em solução nutritiva e no solo no comportamento de cultivares de trigo. Bragantia, v. 43, n. 1, p. 63-86, 1984.
CRALLE, H. T.; FOJTASEK, T. B. F.; CARSON, K. H.; CHANDLER, J. M.; MILLER, T. D.; SENSEMAN, S. A.; BOVEY, R. W.; STONE, M. J. Wheat and Italian ryegrass (Lolium multiflorum) competition as affected by phosphorus nutrition. Weed Science, v. 51, n. 3, p. 425-429, 2003.
EGLI, D. B.; BRUENING, W. P. Flowering and fruit set dynamics at phloem-isolated nodes in soybean. Field Crops Resersh, v. 79, n. 1, p. 9-19, 2002.
EHDAIE, B.; ALLOUSH, G. A.; WAINES, J. G. Genotypic variation in linear rate of grain growth and contribution of stem reserves to grain yield in wheat. Field Crops Research, v. 106, n. 1, p. 34-43, 2008. ELHANI, S.; MARTOS, V.; RHARRABTI, Y.; ROYO, C.; DEL MORAL, L. F. G. Contribution of main stem and tillers to durum wheat (Triticum turgidum L. var. durum) grain yield and its components grown in Mediterranean environments. Field Crops Research, v. 103, n. 1, p. 25-35, 2007.
EMBRAPA-Empresa Brasileira de Pesquisa Agropecuária/ Centro Nacional de Pesquisa de Trigo. Informações técnicas para trigo e triticale safra 2011. In: Reunião da Comissão Brasileira de Pesquisa de Trigo e Triticale, 4. ed. Cascavel: Coodetec, 2010.
ESPINDOLA, L. F.; MINELLA, E.; DELATORRE, D. A. Low‑P tolerance mechanisms and differential gene expression in contrasting wheat genotypes. Pesquisa Agropecuária Brasileira, v. 44, n. 9, p. 1100-1105, 2009. FAO-Food and Agriculture Organization of the United Nations. World Soil Resources Report. Rome: FAO, 2006. (World Reference Base for Soil Resources, 103). INOUE, T.; INANAGA, S.; SUGIMOTO, Y.; SIDDIGK, E. L. Contribution of pre-anthesis assimilates and current photosynthesis to grain yield, and their relationships to drought resistance in wheat cultivars grown under different soil moisture. Photosynthetica, v. 42, n. 1, p. 99-104, 2004.
KUWAHARA, F. A.; SOUZA, G. M. Fósforo como possível mitigador dos efeitos da deficiência hídrica sobre o crescimento e as trocas gasosas de Brachiaria brizantha cv. MG-5 Vitória. Acta Scientiarum. Agronomy, v. 31, n. 2, p. 261-267, 2009.
LARGE, E. C. Growth stages in cereals. Illustration of the Feeks scale. Plant Pathology, v. 3, n. 4, p. 128-129, 1954. LI, K.; XU, Z. P.; ZHANG, K. W.; YANG, A. F.; ZHANG, J. R. Efficient production and characterization for maize inbred lines with low‑phosphorus tolerance. Plant Science, v. 172, n. 2, p. 255-264, 2007.
MASLE, J. Competition among tillers in winter wheat: consequences for growth and development of the crops. In: DAY, W.; ATKIN, R. K. (Ed.). Wheat growth and modeling. New York: Plenum, 1985. p. 33-54.
MUNDSTOCK, C. M. Planejamento e manejo integrado da lavoura de trigo. Porto Alegre: UFRGS, 1999.
OZTURK, A.; CAGLAR, O.; BULUT, S. Growth and yield response of facultative wheat to winter sowing, freezing sowing and spring sowing at different seeding rates. Journal of Agronomy and Crop Science, v. 192, n. 1, p. 10-16, 2006.
PRYSTUPA, P.; SLAFER, G. A.; SAVIN, R. Leaf appearance, tillering and their coordination in response to NxP fertilization in barley. Plant and Soil, v. 255, n. 2, p. 587-594, 2003.
TAKAHASHI, S.; ANWAR, M. R. Wheat grain yield, phosphorus uptake and soil phosphorus fraction after 23 years of annual fertilizer application to an Andosol. Field Crops Research, v. 101, n. 1, 160-171, 2007.
VALÉRIO, I. P.; CARVALHO, F. I. F.; OLIVEIRA, A. C.; MACHADO, A. A.; BENIN, G.; SCHEEREN, P. L.; SOUZA, V. Q.; HARTWIG, I. Desenvolvimento de afilhos e componentes do rendimento em genótipos de trigo sob diferentes densidades de semeadura. Pesquisa Agropecuária Brasileira, v. 43, n. 3, p. 319-326, 2008. VALÉRIO, I. P.; CARVALHO, F. I. F.; OLIVEIRA, A. C.; BENIN, G.; SOUZA, V. Q.; MACHADO, A. A.; BERTAN, A.; BUSATO, C. C.; SILVEIRA, G.; FONSECA, D. A. R. Seeding density in wheat genotypes as a function of tillering potential. Scientia Agricola, v. 66, n. 1, p. 28-39, 2009.
toxicity and phosphorus deficiency. Crop and Pasture Science, v. 61, n. 11, p. 863-872, 2010. YASEEN, M.; MALHI, S. S. Selection criteria for genotypes and identification of plant characteristics for phosphorus-efficient wheat. Communications in Soil Science and Plant Analysis, v. 41, n. 6, p. 679-695, 2010.
Received on May 4, 2011. Accepted on October 29, 2011.