NITRATE REDUCTASE ACTIVITY IN LEAVES AND STEMS
OF TANNER GRASS (
Brachiaria radicans
Napper)
Jairo Osvaldo Cazetta1*; Luciana Cristine Vasques Villela1
UNESP/FCAV - Depto. de Tecnologia - Via de Acesso Prof. Paulo Donato Castellane s/n, 14884-900 - Jaboticabal, SP - Brasil.
*Corresponding author <[email protected]>
ABSTRACT: Tanner grass (Brachiaria radicans Napper) is a forage plant that is adapted to well-drained
soils or wetlands, and responds well to nitrogen (N) fertilization. The assimilation of N involves the nitrate reductase (NR) enzyme, and its activity seems to be dependent on N supply. Molybdenum (Mo) is also important because it is a cofactor of NR. In this study, the variables of an in vivo assay were optimized for
measuring nitrate reductase activity (NRA) in the leaves and stem tissues. This method was used to evaluate NO3
metabolism in plants fertilized with NaNO3, NH4Clor urea, in association with or without application of H2MoO4, aiming to provide guidelines for N management of this species. The best conditions to determine NRA involved the incubation of 300 mg of tissues in a medium composed of 200 mmol dm-3 phosphate buffer
(pH 7.4), 60 mmol dm-3 KNO 3, 10 cm
3 dm-3 n-butanol, 0.1 cm3 dm-3 detergent (triton-X-100®), under vacuum
and in the dark for a period of 60 to 100 minutes. Leaves showed NRA levels two to three times higher than stems. Although there were some interactions between treatments, stem fresh weight and NRA were not affected by N sources. Plants fertilized with NaNO3 showed the best growth and NRA values when compared with NH4Cl and urea, which had, respectively, the lowest and intermediate scores. The application of Mo in the absence of N improved NRA and did not affect leaf and stalk growth. In the presence of N, the Mo levels applied limited leaf NRA and plant development.
Key words: Brachiaria arrecta, nitrogen, molybdenum, enzyme
ATIVIDADE DA REDUTASE DO NITRATO EM FOLHAS E CAULES
DE ‘TANNER GRASS’(
Brachiaria radicans
Napper)
RESUMO: A ‘tanner grass’ (Brachiaria radicans Napper) é uma planta forrageira que se adapta bem tanto
em solos bem drenados como em encharcados, e responde bem à adubação nitrogenada. A assimilação do nitrogênio (N) envolve a enzima nitratro redutase (NR) cuja atividade é dependente do suprimento de N. O Molibdênio (Mo) também é importante por ser um co-fator da RN. Neste trabalho foi otimizado um procedimento para a determinação da atividade da redutase do nitrato (NRA) in vivo para tecidos de folha e
caule. Este método foi aplicado para avaliar plantas fertilizadas com NaNO3, NH4Cl ou uréia, com e sem a aplicação de H2MoO4, visando contribuir no balizamento da adubação nitrogenada para esta espécie. As melhores condições para a determinação da NRA foram: incubação de 300 mg de tecidos em um meio composto por tampão fosfato 200 mmol dm-3
(pH 7,4); KNO3 60 mmol dm-3
; n-butanol 10 cm3
dm-3
; triton-x-100®
0,1 cm3 dm-3; infiltração a vácuo no escuro; por período de 60 a 100 minutos. As folhas apresentaram NRA duas
a três vezes maior que os caules. A matéria fresca do caule e a NRA não foi afetada pelas fontes de N. As plantas adubadas com NaNO3, NH4Cl e uréia apresentaram, respectivamente, os maiores, os menores e intermediários crescimento e NRA. A aplicação de Mo na ausência de N aumentou a NRA e não afetou o crescimento, mas, na presença de N, limitou a NRA nas folhas e o crescimento das plantas.
Palavras-chave: Brachiaria arrecta, nitrogênio, molibdênio, enzima
INTRODUCTION
Tanner grass is the common name for Brachiaria radicans Napper (Skerman & Riveros, 1990), lately
de-scribed as Brachiaria arrecta (Souza, 1999). This forage
grass is very competitive when compared with other for-age species, and grows well under tropical conditions (Mitidieri, 1983; Skerman & Riveros, 1990). As in the majority of crops, nitrogen (N) is one of the most impor-tant nutrients in grasses. To improve the efficiency of N
fertilization, more information on the processes of N uti-lization is required for each plant species (Baer & Collet, 1981). There is evidence suggesting that nitrate reductase activity (NRA) is the main limiting step in N assimila-tion in most plants (Srivastava, 1990; Lea, 1997). Leaf NRA seems to be dependent on the source of N (Roberts & Menary, 1994), and on a continuous supply of nitrate (NO3
interac-tions between the effects of N sources and Mo fertiliza-tion on NRA have been reported (Dordas et al., 2001). The NRA levels in a plant are of help in the study of plant metabolism and its complex relationship with the envi-ronment (Muller & Janieshch, 1993; Faleiros & Cazetta, 1996; Viégas et al., 1999; Stolz & Bazu, 2002), and one of the challenges of research in N metabolism is to de-velop approaches to analyze this complex interaction (Stitt et al., 2002).
NRA can be measured by either an in vivo or in vitro assay (Viégas et al., 1999). The in vitro assay is
accomplished by extracting the enzymatic fraction from the tissue (Lillo, 1983; Viégas et al., 1999), and by measuring the reaction in an appropriate buffered medium (Aslam et al., 1984; Lillo, 1983). On the other hand, the in vivo assay can be carried out easily,
with-out enzyme extraction, by incubating tissue samples in a buffered medium containing NO3-, solvent and/or
de-tergent, and by measuring NO2- produced during an
ad-equate period of time, in the dark (Jaworski, 1971; Jones & Sheard, 1977; Harper, 1981). Nitrite production in the
in vivo assay depends on the diffusion of NO3- into the
tissue, to reach the cytoplasm of cells where the enzyme is located. Therein, nitrate reductase catalyses the con-version of NO3
to NO2
-, by using the reducing power of NADH (Nicotinamide Adenine Dinucleotide, reduced form) coming from the respiratory oxidative pathways. Under normal conditions, NO2- produced in green
tissues is transported into chloroplasts and reduced to ammonia, using the reducing power of reduced ferredoxin, derived from photosynthetic electron transport (Lea, 1997). However, during the in vivo
as-say procedure, the tissue is kept in the dark, which in-hibits NO2- reduction. This leads to NO
2
- accumulation,
which drives its diffusion from the tissue toward the in-cubation medium, where it is measured as the product of NR activity. Thus, NO2- present in the medium not
only depends on the NRA, but also on the diffusion pro-cesses.
Although NR always catalyzes the same reaction, its location within tissues, structure, and regulatory mechanisms are organism-dependent (Stolz & Bazu, 2002). Due to differences between species, or even be-tween various plant parts, it is best to optimize the con-ditions for the in vivo assay, before NRA determinations
are made (Lin & Kao, 1980; Faleiros & Cazetta, 1996). Therefore, the first objective of this research was to es-tablish the optimum conditions for tanner grass leaf and stem NRA determinations, using the in vivo assay method.
The second objective was to evaluate NRA in leaves and stems of tanner grass plants fertilized with NaNO3, NH4Cl, or urea, with or without Mo, for the purpose of providing guidelines for N management of this species in the future.
MATERIAL AND METHODS
Plants were collected in Jaboticabal-SP, Brazil (21º15’17’’S and 48º19’20’’W), in December of 2002, and separated into leaf blades and stems (stalk plus leaf sheath adhering to the stalk). The central portion of leaves was cut into discs with a diameter of 1.0 cm. The stems were cut transversally into 2 mm long pieces. Both tis-sues were assayed for their in vivo NRA. The basal
as-say procedure used was a modification of the Jaworski (1971) method, described by Faleiros & Cazetta (1996), based on the incubation of fresh tissue (300 mg) in 10.0 cm3 of a medium containing 25 mmol dm-3 phosphate
buffer (pH 7.2), 25 mmol dm-3
KNO3, 30 cm3
dm-3
n-pro-panol, and 30 cm3 dm-3 of triton X-100®
(t-octyl-phenoxy-polyethoxy-ethanol, Rohm & Haas Co: U.S.A.). In order to induce anaerobic conditions in the incubation medium, the system was subjected to vacuum infiltration three times, as recommended by Klepper et al. (1971) to re-move air from the tissue. The medium was maintained in the dark at 30oC for 60 minutes.
The NO2- produced by action of the NR enzyme
was determined by drawing an 0.5 cm3 aliquot of the
incubation medium, and treating this sample with 0.5 cm3 of 10 g dm-3 sulfanilamide in 3 mol dm-3 HCl and
0.5 cm3 of 0.2 g dm-3 N-(1-naphtyl)-ethylenediamine
dihydrochloride. After 20 minutes, the solution was di-luted to 4.5 cm3 with deionized water, and the
absor-bance (540 nm) was measured using an Ultrospec 2000®
spectrophotometer (Pharmacia Biotech: England). In or-der to calculate the amount of NO2
contained in the sample, a standard curve was prepared in the same way as the sample, but using aliquots of 0.5 cm3 of NaNO
2
standard solutions (containing from 0 to 140 µmol dm-3
NO2-).
The optimization of the NRA assay was devel-oped by evaluating the best incubation time (ranging from 20 to 120 minutes), pH level (6.0 to 8.0), surfactant com-pounds (solvents: ethanol, n-propanol, n-butanol, ketone, ethyl acetate; and detergents: triton X-100® or tween 80®
(poly-oxy-ethylene sorbitan monooleate, Atlas Chemie: Germany), as well as the best concentration for phosphate (ranging from 0 to 400 mmol dm-3), NO
3
- (0 to 100 mmol
dm-3
), solvent (0 to 100 cm3
dm-3
), and surfactant (0 to 100 g dm-3), for the incubation medium. The effect of
vacuum infiltration on the performance of the assay was also studied. The NO2- diffusion results were expressed
as micromoles of NO2- per gram of fresh tissue, after a
given incubation time, and NRA results were expressed as micromoles of NO2- produced per g of fresh tissue per
hour (µmol g-1 h-1 NO 2
-).
The optimized NRA method was applied to study NO3- assimilation in stems and leaves of tanner grass
medium-textured Typic Hapludox, collected from a field
previously cultivated with corn (Zea mays L.). The
ini-tial soil properties were: pH in 0.01 mol L-3 CaCl 2
solu-tion = 4.7; organic matter = 12 g dm-3; P = 11.0 mg dm-3;
K = 1.5 mmolc dm-3; Ca = 16.0 mmol c dm
-3; Mg = 5.0
mmolc dm-3
; H+
+Al3+
= 37.0 mmolc dm-3
, cation exchange capacity (CEC) = 59.5, and base saturation = 37.8%. To reduce acidity, CaO was added and blended into the soil at a rate necessary to obtain a base saturation of 60%. The mixture was kept moist, and let stand for 15 days. The soil was then fertilized with Ca(H2PO4)2, K2SO4, and Mg(SO4)2, at levels corresponding to 80 kg ha-1 P
2O5, 60
kg ha-1 K
2O, and 30 kg ha
-1 Mg, respectively, and then
transferred to 5 dm3 pots. Rooted sprouts of tanner grass
of similar size were collected from the field, and individu-ally planted in 32 pots.
The eight treatments consisted of three sources of N: NaNO3, NH4Cl, and urea. All N sources were ap-plied at a rate corresponding to 300 kg N ha-1, combined
with two levels of Mo fertilization (0 and 20 kg Mo ha-1,
as H2MoO4), plus two control treatments: no N or Mo fer-tilization, and fertilization with Mo, applied without N. The Mo fertilizer was added to appropriate treatments before planting. The different sources of N were applied with the irrigation water, divided into four weekly appli-cations, which were started 10 days after planting.
The experiment was organized as a completely randomized design, with eight treatments and four repli-cations, where each 5 dm3 pot containing one plant
com-prised an individual experimental unit. Plants were main-tained in a growth chamber with a photoperiod of 16 h (176 µmol PPFD m-2 s-1) provided by incandescent and
fluorescent bulbs. The temperature was maintained be-tween 20 and 35ºC (night and day, respectively) and the experiment was conducted for 40 days after planting. Plants were then harvested and separated into stems (stalk plus sheath adhering to stalk) and leaf blades and weighed, and NRA determinations were made according to the method previously described.
A factorial design (three N sources × two Mo lev-els, plus two controls), with four replications, was used for statistical analysis in this study. The F test was ap-plied to detect main and interaction effects, and means were compared using Tukey test (P < 0.05). Analyses of
variance and factorial analyses were performed using SAS® (SAS version 6.11 software package, Statistical
Analysis System Institute: U.S.A).
RESULTS AND DISCUSSION
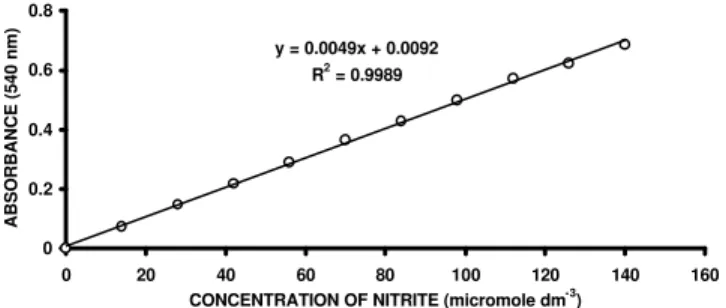
Results obtained for the standard curve (Figure 1) showed high correlation (r2 = 0.999) between
absor-bance at 540 nm and [NO2-]. This indicates that the
as-say model was reliable to determine NO2
with good pre-cision.
Stem NRA showed some variations within the first 60 minutes of incubation, but tended to be stable from 60 to 120 minutes (Figure 2), and exhibited an ac-tivity of about 20% of that observed for leaves.
NRA results for leaves revealed an increase (P < 0.05) during incubation times from 20 to 120
min-utes (Figure 2). The behavior of NRA during incubation was reported to increase (Jaworski, 1971; Streeter & Bosler, 1972; Blondel & Blanc, 1975; Lin & Kao, 1980; Faleiros & Cazetta, 1996), to remain constant up to 120 minutes (Brunnetti & Hageman, 1976, Heuer & Plaut, 1978), to decrease during the first 60 minutes (Streeter & Bosler, 1972), or to decrease after 60 minutes (Klepper et al., 1971), indicating that it is dependent upon the spe-cies or tissue under study. In order to be reduced to NO2
-in the -in vivo assay, NO3- has to diffuse into the tissue
Figure 2 -Nitrite diffused from leaf (DIF. LEAF) and stem (DIF. STEM) tissues of Brachiaria radicans into incubation medium (25 mmol dm-3 Phosphate buffer, pH 7.2, 25
mmol dm-3 KNO
3, 30 cm3 dm
-3 n-propanol and 30 cm3
dm-3 triton-X-100®, at 30oC after vacuum infiltration), as
well as nitrate reductase activity for leaf (NRA LEAF) and stem (NRA STEM), obtained after different incubation time periods. Means (obtained from triplicates and represented as points on the graph) for a given line with the same letter are not different (Tukey test, P < 0.05).
Figure 1-Standard curve obtained by reacting 0.5 cm3 of NaNO 2
standard solutions (containing 0 to 140 µmole NO2- dm-3)
with 0.5 cm3 of 10 cm3 dm-3 sulfanilamide in 3 mol dm-3
HCl, and 0.5 cm3 of 0.2 cm3 dm-3
N-(1-naphtyl)-ethylenediamine dihydrocloride, and after 20 minutes diluted to 4.5 cm3 with deionized water. Each point in
the graph refers to means obtained from triplicates. y = 0.0049x + 0.0092
R2 = 0.9989
0 0.2 0.4 0.6 0.8
0 20 40 60 80 100 120 140 160
CONCENTRATION OF NITRITE (micromole dm-3)
ABSORBANCE (540 nm)
A AB AB B C C
ab ab a a b ab 0,0 1,0 2,0 3,0
0 20 40 60 80 100 120
INCUBATION TIME (minutes)
NRA (
µ
mol g
-1 h -1 NO
2
-)
0,0 1,0 2,0 3,0
NO
2
- Difusion (
µ
mol g
-1)
and the NO2- produced has to diffuse into the incubation
medium in order to be measured. Thus, since induced NRA is not expected to increase during incubation, in-creases suggest that variations may rely on diffusion pro-cesses. This possibility reinforced the need for solvents and surfactants as medium components.
The inclusion of n-butanol or n-propanol in the leaf incubation medium promoted higher NRA, when compared to the addition of ethanol. Acetone and ethyl acetate suggested intermediate promotion (Figure 3). Among the surfactants, triton-X-100®
improved NRA, in comparison to tween-80® (Figure 3). When these same
chemicals were included in the incubation medium for stem tissue, no differences (P > 0.05) were observed
(Fig-ure 3). The inclusion of solvents in the incubation me-dium was intended to increase membrane permeability. This would facilitate the influx of NO3- into tissue cells,
and NO2
efflux into the medium. For triticale (Triticosecale Wittmack) propanol was more effective
than butanol (Lin & Kao, 1980), but for tanner grass simi-lar results were obtained for both alcohols (Figure 3). Bu-tanol was chosen because of its supposedly lower toxic-ity and higher water solubiltoxic-ity, compared to propanol (Jaworski, 1971).
The presence of a detergent in the medium is im-portant in order to minimize liquid surface tensions, and improve contact of the tissue with the medium. However, our data indicated that NRA decreased when triton-X-100® was added to the medium (Figure 4). By increasing
the concentrations of the triton-X-100®
detergent from 0 to 100 cm3 dm-3 in the incubation medium, leaf NRA
de-creased by an average of 5.8 % for each 10 cm3 dm-3
in-crement of triton-X-100® added. Stem tissue NRA
de-creased by an average of 47% when the triton-X-100®
concentration in the medium was increased from 0 cm3
dm-3 to 30 cm3 dm-3. Higher concentrations tended to
in-duce further reductions, but at much smaller rates (Fig-ure 4). These results suggest that triton-X-100® could be
excluded from the incubation medium for both tissues. Nevertheless, considering that the concentration required to reduce liquid tension is very low (about 0.1 cm3 dm-3),
and also that a mixture of surfactants tend to induce a syn-ergistic effect (Streeter & Bosler, 1972; Tingey et al., 1974; Lawrence & Herrick, 1982; Faleiros & Cazetta, 1996), it would be advisable to include 0.1 cm3 dm-3
tri-ton-X-100®.
After choosing n-butanol as the solvent to be used, the effect of different concentrations in the me-dium was observed. Increasing the concentration from 0 cm3 dm-3 to 10 cm3 dm-3 increased NRA by an
aver-age of 5 % for leaf, and 18% for stem tissue, while con-centrations higher than 10 cm3 dm-3 decreased NRA. The
inhibitory effect was proportional to the concentration of butanol, chiefly in the range from 10 cm3
dm-3
to 70 cm3 dm-3 for leaf, and from 10 cm3 dm-3 to 30 cm3 dm-3
for stem tissues. Comparing the results of butanol at 10 cm3 dm-3 with butanol at 100 cm3 dm-3, NRA was
duced by 93% and 89% for leaf and stem tissues, re-spectively (Figure 5).
In spite of the fact that data from the different tests were obtained on different dates, and with the use of dif-ferent plants, it becomes clear that when the average val-ues for NRA are compared, the lower activities observed in the first tests (Figure 2, 3) were mainly due to the use of excessive concentrations of surfactants (30 cm3 dm-3).
The best butanol concentration (30 cm3
dm-3
) for Cajanus cajan (Faleiros & Cazetta, 1996) promoted a significant
inhibitory effect when applied to tanner grass.
Nitrate reductase activity was enhanced by in-creases in NO3- supply from 0 mmol dm-3 to 33 mmol
dm-3
, while no further effect was observed for [NO3
-] higher than 33 mmol dm-3, for either leaf or stem tissues,
Figure 3 - Nitrate reductase activity (NRA) determined in leaf and stem tissues of Brachiaria radicans incubated for 80 minutes in media (25 mmol dm-3 Phosphate buffer, pH
7.2; 25 mmol dm-3 KNO 3, at 30
oC under vacuum), with
different surfactant compounds (AE, ethyl acetate; AC, acetone; BU, butanol; ET, ethanol; PR, propanol; TR, triton-X-100®; TW, tween-80®). Means (obtained from
triplicate samples and represented as bars on the graph) for a given tissue with the same letter are not different (Tukey test, P < 0.05).
AB AB
A
B A
A
B
a a a a a a a
0 0.5 1 1.5
AE AC BU ET PR TR TW
SURFACTANT
NRA
(
µ
m
o
l
g
-1
h
-1
N
O2
-)
LEAF STEM
Figure 4 - Nitrate reductase activity (NRA) determined in leaf and stem tissues of Brachiaria radicans incubated for 80 minutes in media (25 mmol dm-3 phosphate buffer, pH
7.2, 25 mmol dm-3 KNO 3, 30 cm
3 dm-3 n-butanol, at 30oC
under vacuum), with different triton-X-100®
concentrations (cm3 dm-3). Means (obtained from
triplicates and represented as points on the graph) comprising a given line with the same letter are not different (Tukey test, P < 0.05).
H G G F E E D C B B A
hi hi i fgh ghi efg def d c b a
0.0 1.0 2.0
0 10 20 30 40 50 60 70 80 90 100
NRA (
µ
mol g
-1 h -1 NO
2
-)
LEAF STEM
indicating that the optimum concentration should be be-tween 17 mmol dm-3 and 33 mmol dm-3 (Figure 6).
Me-dia containing [NO3-] higher than 83 mmol dm-3 promoted
a decreased NRA in stem tissue. These findings agree with data from previous studies (Nicholas et al., 1976; Watanabe et al., 1985; Faleiros & Cazetta, 1996), which showed that high [NO3-] could decrease enzyme activity.
However, in this research, leaves did not exhibit a de-crease in NRA, even when [NO3-] was increased to 100
mmol dm-3. This suggests that tanner grass leaves
toler-ated a wider range of [NO3
-] than did other plants (Nicho-las et al., 1976; Faleiros & Cazetta, 1996). These results confirm that the addition of exogenous NO3- (60 mmol
dm-3) is necessary in order to ensure maximum NRA
dur-ing an in vivo assay of tanner grass tissues. This also
in-dicates that concentrations of about 60 mmol dm-3 are
suf-ficient to saturate the enzyme in in vivo assays for both
tissues analyzed.
The highest values were obtained when leaf and stem tissues were incubated in media containing phos-phate buffer at concentrations of 200 mmol dm-3 and 300
mmol dm-3, respectively (Figure 7). A significant
(P < 0.05) effect of the [PO4-3] concentration in the
me-dium on NRA was observed for tanner grass, but not for other species (Jones & Sheard, 1977; Nicholas et al., 1976; Streeter & Bosler, 1972).
Leaf NRA was enhanced when pH increased from 6.0 to 7.6, but dropped when pH further increased from 7.6 to 8.0. Nitrate reductase activity for pH 7.2 and 7.6 did not differ (P > 0.05), indicating that the optimum pH
for the incubation medium may be between those values. For stems, probably due to the low levels of NRA in this tissue, no difference (P > 0.05) was detected for pH
rang-ing from 6.8 to 8.0 (Figure 8), even though the behavior of NRA as a function of pH was similar to that observed for leaves. These results show similar patterns to those found for soybean (Glycine max L. Merril), beans
(Phaseolus vulgaris L.), and pigeon pea (Cajanus cajan
L. Millsp) (Jaworski, 1971; Nicholas et al., 1976; Puranik & Srivastava, 1983; Faleiros & Cazetta, 1996), while dif-ferent values were observed for triticale (Triticosecale
Wittmack) (Lin & Kao, 1980).
Figure 5 -Nitrate reductase activity (NRA) determined in leaf and stem tissues of Brachiaria radicans incubated for 80 minutes in media (25 mmol dm-3 Phosphate buffer, pH
7.2; 25 mmol dm-3 KNO
3, 0.1 cm3 dm
-3 triton-X-100®, at
30 oC under vacuum), with different butanol
concentrations (cm3 dm-3). Means (obtained from
triplicates and represented as points on the graph) for a given line with the same letter are not different (Tukey test, P < 0.05).
J IJ I H G F E D C A B h gh gh f g e e d c a b 0.0 1.0 2.0
0 10 20 30 40 50 60 70 80 90 100
CONCENTRATION OF BUTANOL IN THE MEDIUM (cm3 dm-3)
NRA (
µ
mol g
-1 h -1 NO
2
-)
LEAF STEM
Figure 6 -Nitrate reductase activity (NRA) determined in leaf and stem tissues of Brachiaria radicans incubated for 80 minutes in media (200 mmol dm-3 phosphate buffer pH
7.4; 10 cm3 dm-3 n-butanol and 0.1 cm3 dm-3
triton-X-100®, at 30oC under vacuum) with different NO 3
-concentrations.Means (obtained from triplicates and represented as points on the graph) for a given line with the same letter are not different (Tukey test, P < 0.05).
A A A A B C A
c b a a a a b
0.0 1.0 2.0 3.0
0 17 33 50 67 83 100
NITRATE CONCENTRATION ( mmol dm-3)
NRA (
µ
mol g
-1 h -1 NO
2
-)
LEAF STEM
Figure 7 -Nitrate reductase activity (NRA) determined in leaf and stem tissues of Brachiaria radicans incubated for 80 minutes in media (phosphate buffer pH 7.2; 60 mmol dm-3 KNO
3, 10 cm3 dm
-3 n-butanol and 0.1 cm3 dm-3
triton-X-100®, at 30oC) with different phosphate
concentrations.Means (obtained from triplicate samples and represented as points on the graph) on a given line with the same letter are not different (Tukey test, P < 0.05).
C B A B C c ab
ab a b
0.0 1.0 2.0 3.0
0 100 200 300 400
PHOSPHATE CONCENTRATION IN THE MEDIUM (mmol dm-3)
NRA (
µ
mol g
-1 h
-1 NO 2 -) LEAF STEM
Figure 8 - Nitrate reductase activity (NRA) determined in leaf and stem tissues of Brachiaria radicans incubated for 80 minutes in media (200 mmol dm-3 phosphate buffer, 60
mmol dm-3 KNO 3, 10 cm
3 dm-3 n-butanol and 0.1 cm3
dm-3 triton-X-100®, at 30oC and vacuum infiltration), at
different pH values. Means (obtained from triplicate samples and represented as points on the graph) for a given line with the same letter are not different (Tukey test, P < 0.05).
D CD
BC AB
A B
c b ab a ab ab
0.0 1.0 2.0 3.0 4.0 5.0
6.0 6.4 6.8 7.2 7.6 8.0
pH OF THE INCUBATIOM MEDIUM
NRA (
µ
mol g
-1 h
Both pH and buffer isotonic strength are impor-tant variables in NRA determinations (Figures 7 and 8). Despite the stems having much lower levels of NRA com-pared to those of leaves, the stem tissue showed the high-est activity at a lower pH and higher [PO4-3], and
exhib-ited tolerance to a wider range of both pH or buffer strength.
The incubation of tissues under vacuum condi-tions enhanced (P < 0.05) NRA for leaves and stems by
an average of 21% and 15%, respectively, compared to the procedure without vacuum infiltration and incubation under room pressure (Figure 9). The assay showed a bet-ter performance afbet-ter vacuum infiltration, with incubation
maintained under vacuum conditions. Faleiros & Cazetta (1996) suggested that this is probably due to the elimi-nation of inter-cellular gases from the tissue, which im-proves the contact between solution and tissue. This causes the tissue to submerge into the medium. The re-moval of O2 from the tissue also reduces the possibility of NO2- reduction to NH
4
+ in the cells, maintaining its
dif-fusion towards the medium. Based on these results, the best in vivo assay to determine Brachiaria radicans NRA
is the incubation of tissues in a medium composed of 200 mmol dm-3
phosphate buffer pH 7.4, 60 mmol dm-3
KNO3, 10 cm3 dm-3 n-butanol, and 0.1 cm3 dm-3 triton-X-100®.
This should be done under vacuum and in the dark for a period of time between 60 and 100 minutes.
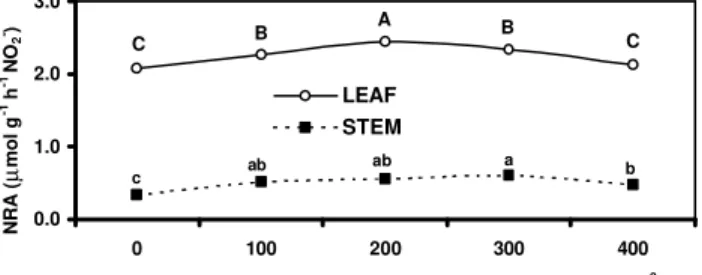
When tanner grass was grown in pots, it produced 1.5 to 2.5 times more stem than leaf fresh weight (Table 1). However, the average NRA per unit of fresh weight was higher (from 4.6 to 10.5 fold) in leaves, compared to the stem tissue. When NRA in the whole plant was cal-culated, leaf tissue had an activity from 2.1 to 6.8 times greater than stem tissue.
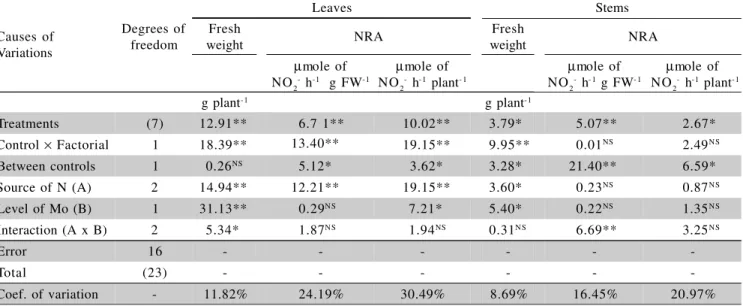
The treatments did affect plant development and NRA of tanner grass tissues (Table 2). Except for leaf fresh weight and NRA per unit of stem fresh weight, there were no significant N source x Mo level interactions (Table 2), indicating that N sources and levels of Mo, un-der this soil and experimental conditions, tended to play independent roles.
Plants fertilized with NaNO3and urea produced more leaf fresh weight than those fertilized with NH4Cl (Table 3). No differences, however, were observed for N sources on stem fresh weight. Nitrate fertilizer tended to Figure 9 - Nitrate reductase activity (NRA) determined in leaf and
stem tissues of Brachiaria radicans incubated for 80 minutes (200 mmol dm-3 phosphate buffer pH 7.5, 60
mmol dm-3 KNO 3, 10 cm
3 dm-3 n-butanol and 0.1 cm3
dm-3 triton-X-100®, at 30 oC) under vacuum (85kPa) after
vacuum infiltration or at room pressure without previous vacuum infiltration.Means (obtained from triplicate samples and represented as bars on the graph) from a given tissue with the same letter are not different (Tukey test, P < 0.05).
A
B
a
b
0.0 1.0 2.0 3.0 4.0
WITH INFILTRATION AND VACUUM INCUBATION
WITHOUT INFILTRATION AND AT ROOM PRESSURE
NRA (
µ
mol g
-1 h -1 NO
2
-)
LEAF STEM
Table 1 -Fresh weight (FW) and nitrate reductase activity (NRA) in leaf and stem fresh tissues of Brachiaria radicans
fertilized with 300 kg ha-1 N as NaNO
3, NH4Cl, or urea, without Mo application or fertilized with 20 kg ha-1 Mo (as
H2Mo2O4), plus two controls (no fertilization, and Mo only). The NRA determinations were carried out by incubating 200 mg tissues for 80 minutes in medium containing 200 mmol dm-3 phosphate buffer pH 7.5, 60 mmol dm-3 KNO
3,
10 cm3 dm-3 n-butanol, and 0.1 cm3 dm-3 triton-X-100®, at 30 oC, under vacuum (85kPa) following vacuum infiltration.
The means in the table were obtained from three replications, and are accompanied by their standard deviation.
Treatment
Leaves Stems
Fresh
Weight NRA
Fresh
Weight NRA
µmole of NO2- h-1 g FW-1
µmole of NO2- h-1 plant- 1
µmole of NO2- h-1 gFW-1
µmole of NO2- h- 1 plant- 1
g plant-1 g plant-1
induce higher NRA in the leaf tissue when compared to NH4Cl and urea. The ammonium fertilizer induced slower shoot development, when compared to NaNO3 (Table 3), suggesting that tanner grass cannot detoxify NH4+, as
re-ported for other species (Roberts & Menary, 1994). Plants fertilized with urea tended to show inter-mediate growth and NRA values, despite visual similari-ties between NaNO3 or NH4Cl fertilized plants (Table 3). Despite the fact that urea is a source of NH4+, not all of
it is immediately available, but is slowly released during
its hydrolysis in the soil. The rate of urea hydrolysis in soils containing low levels of organic matter (like the one used in this research) tends to be low (Reynolds et al., 1985). Thus, NH4+ is released at such a rate that the plant
can absorb NH4+ with little risk of toxicity. Also, in the
moisture and oxidizing conditions under which the soil was maintained in this study, NH4+ was probably slowly
oxidized to NO3- (Malavolta, 1981), providing a NO 3
-
sup-ply just enough to induce a slight NRA increase (Kawachi et al., 2002).
Table 2 -Analysis of variance and F test results obtained for fresh weight and nitrate reductase activity (NRA) in leaf and stem fresh weight (FW) tissues of Brachiaria radicans fertilized with 300 kg ha-1 N as NaNO
3, NH4Cl, or urea,
without Mo application or fertilized with 20 kg ha-1 Mo (as H
2Mo2O4), plus two controls (No fertilization, and Mo
only).
**F test significant at P < 0.01; *F test significant at P < 0.05; NSF test not significant (P > 0.05). Causes of
Variations
Leaves Stems
Degrees of freedom
Fresh
weight NRA
Fresh
weight NRA
µmole of
NO2- h-1 g FW-1 µ
mole of
NO2- h-1 plant- 1 µ
mole of
NO2- h- 1 g FW- 1 µ
mole of NO2- h-1 plant-1
g plant-1 g plant-1
Treatments (7) 12.91** 6.7 1** 10.02** 3.79* 5.07** 2.67*
Control × Factorial 1 18.39** 13.40** 19.15** 9.95** 0.01NS 2.49NS
Between controls 1 0.26NS 5.12* 3.62* 3.28* 21.40** 6.59*
Source of N (A) 2 14.94** 12.21** 19.15** 3.60* 0.23NS 0.87NS
Level of Mo (B) 1 31.13** 0.29NS 7.21* 5.40* 0.22NS 1.35NS
Interaction (A x B) 2 5.34* 1.87NS 1.94NS 0.31NS 6.69** 3.25NS
Error 16 - - -
-Total (23) - - -
-Coef. of variation - 11.82% 24.19% 30.49% 8.69% 16.45% 20.97%
Table 3 -Main effects of sources of nitrogen, levels of Mo, and controls on thefresh weight (FW) and nitrate reductase activity (NRA) of leaf and stem tissues of Brachiaria radicans fertilized with 300 kg ha-1 of N as NaNO
3, NH4Cl,
or urea, without Mo application or fertilized with 20 kg ha-1 Mo (as H
2Mo2O4), plus two controls (No fertilization,
and Mo only), obtained from a factorial statistical analysis.
#Values were obtained from three replications. Means followed by the same letter within each factor and variable are not different (Tukey
test, P > 0.05). Factors / Treatments
Leaves # Stems #
Fresh
weight NRA
Fresh
weight NRA
µmole of NO2- h- 1 g FW-1
µmole of NO2- h- 1 plant- 1
µmole of NO2- h-1 g FW-1
µmole of NO2- h-1 plant-1
g plant- 1 g plant-1
Source of nitrogen
NaNO3 18.43 A 2.968 A 54.415 A 30.66 A 0.306 A 9.327 A NH4Cl 13.03 B 1.568 B 20.362 C 27.01 A 0.294 A 8.001 A Urea 15.07 A 2.197 B 34.326 B 29.85 A 0.287 A 8.625 A Level of Mo 0 kg ha
-1 17.79 a 2.307 a 42.432 a 30.51 a 0.301 a 9.129 a
20 kg ha-1 13.24 b 2.182 a 30.304 b 27.83 b 0.290 a 8.173 a
When Mo was added, plant development (leaf and stem fresh weight) was partially suppressed, as well as total NRA in leaf tissue. NRA in stem tissue showed no differences (P < 0.05), but data suggested a similar
pattern as that observed for leaves (Tables 1, 2, and 3). The growth suppression imposed by Mo application may be due to partial toxicity. No injury symptoms were ob-served in the plants used in this study, although Gupta (2001) stated that symptoms become apparent only un-der very high Mo levels.
When Mo was applied in the absence of N (con-trol), it improved NRA, but stalk development tended to be suppressed (Tables 2 and 3). Leaf fresh weigh tended to show similar results, although the differences did not reach significant levels (P < 0.05) (Tables 2 and 3). It
seems that Mo improved NRA because it is a NR cofac-tor; however, the rate of Mo applied to the soil in this research probably was too high for this species, and may explain the partial suppression of plant development.
The addition of Mo tended to reduce leaf fresh weight of plants under NaNO3 and urea fertilization (Tables 2 and 4). Also, urea promoted better leaf growth than NH4Cl when Mo was not applied, but did not differ under Mo fertilization (Table 4). Sources of N did not af-fect stem NRA when plants were grown without Mo fer-tilization (Table 5). However, for Mo fertilized plants, NaNO3 induced higher NRA when compared to NH4Cl, while urea produced intermediate values. On the other hand, the effect on NRA was increased by NaNO3, de-creased by NH4Cl, and was not altered by urea under Mo fertilization.
These findings together suggest that in this re-search the limitation imposed by Mo application would not be directly related to NR, but involved toxicity in other ways.
In summary, the objective of the NRA assay op-timization was met. Tanner grass plants produced much more stem fresh weight than leaf fresh weight, with most NRA found in the leaves. Although it would be expected that, to some extent, tanner grass plants could avoid NO3
-reduction by absorbing reduced N directly from fertiliz-ers, NH4Cl and urea induced less plant development when compared to NaNO3, showing that this species has a lower tolerance to these sources of N, mainly NH4Cl. The ap-plication of 20 kg ha-1
of Mo as H2Mo2O4 to the soil un-der the conditions used in this research, affected plant development and NRA to some extent; however, it seems that the reduced plant growth observed did not directly involve NRA.
Further research is needed to unveil the plant tox-icity mechanism triggered by high levels of Mo in the soil, and how it effects N utilization. Experiments con-sisting of combinations of different NO3- and Mo levels
might help clarify and better understand this matter.
ACKNOWLEDGEMENTS
This study was supported in part by a scholarship awarded to L.C.V. Villela by FAPESP.
REFERENCES
ASLAM, M.; HUKFFAKER, R.C.; RAINS, D.W. Early effects of salinity on nitrate assimilation in barley seedlings. Plant Physiology, v.76, p.321-325, 1984.
BAER, G.R.; COLLET, G.F. In vivo determination of parameters of nitrate utilization in wheat (Triticum aestivum L.) seedling grown with low concentration of nitrate in the nutrient solution. Plant Physiology, v.68, p.1237-1243, 1981.
BARTHES, L.; DELEENS, E.; BOUSSER, A.; HOARAU, J.; PRIOL, J.L. Xylem exudation is related to nitrate assimilation pathway in developing maize seedlings: Use of nitrate reductase and glutamine synthetase inhibitors as tools. Journal of Experimental Botany, v.47, p.485-495, 1996. BLONDEL, A.M.; BLANC, D. Mise au point dúne methode de mesure in
vivo de lactivité de la nitrate reductase. Annals of Agronomy, v.26, p.309-322, 1975.
BRUNETTI, N.; HAGEMAN, R.H. Comparison of in vivo and in vitro assays of nitrate reductase in wheat (Triticum aestivum L.) seedlings.
Plant Physiology, v.58, p.583-587, 1976.
DORDAS, C.; SAH, R.; BROWN, P.H.; ZENG, Q.; HU, H. Remobilização de micronutrientes e elementos tóxicos em plantas superiores. In: FERREIRA, M.E.; CRUZ, M.C.P.; RAIJ, B.V.; ABREU, C.A. (Ed.)
Micronutrientes e elementos tóxicos na agricultura. Jaboticabal:
CNPq; FAPESP; Potafos, 2001. cap.3, p.43-61.
Table 4 -Effects of the interaction between sources of N and levels of Mo on leaf fresh weight (g plant-1) of
Brachiaria radicans fertilized with 300 kg ha-1 of
N as NaNO3, NH4Cl, or urea, without Mo application or fertilized with 20 kg ha-1 Mo (as
H2Mo2O4), obtained from a factorial statistical analysis.
Level of Mo Sources of N
NaNO3 NH4Cl Urea
kg ha- 1 --- g plant-1
---0 A 21.15 a * A 13.50 b A 18.71 a
20 B 15.72 a A 12.56 ab B 11.43 b
*Capital letters compare means within each column and small letters within each line. Means followed by the same letter are not different (Tukey test, P > 0.05).
*Capital letters compare means within each column and small letters within each line. Means followed by at least one identical letter are not different (Tukey test, P > 0.05).
Level of Mo Sources of N
NaNO3 NH4Cl Urea
kg ha-1 --- µmole h- 1 g FW-1 NO
2-
---0 B 0.259 a * A 0.350 a A 0.294 a
20 A 0.353 a B 0.238 b A 0.280 ab
Table 5 -Effects of the interaction between sources of N and levels of Mo onstem nitrate reductase activity (µmole h-1 gFW-1
NO2-) of Brachiaria radicans fertilized with 300 kg ha-1
of N as NaNO3, NH4Cl or urea, without Mo application or fertilized with 20 kg ha-1 Mo (as H
2Mo2O4), obtained from
FALEIROS, R.R.S.; CAZETTA, J.O. Optimization of the in vivo assay for nitrate reductase activity determination in pigeon pea [Cajanus cajan (L.) Millsp] leaves. Científica, v.24, p.385-396, 1996.
GUPTA, U.C. Micronutrientes e elementos tóxicos em plantas e animais. In: FERREIRA, M.E.; CRUZ, M.C.P.; RAIJ, B.V.; ABREU, C.A. (Ed.)
Micronutrientes e elementos tóxicos na agricultura. Jaboticabal:
CNPq; FAPESP; Potafos, 2001. cap.2, p.13-42.
HARPER, J.E. Evolution of nitrogen oxide(s) during in vivo nitrate reductase assay of soybean leaves. Plant Physiology, v.68, p.1488-1493, 1981. HEUER, B.; PLAUT, Z. Reassessment of the in vivo assay for nitrate
reductase in leaves. Physiologia Plantarum, v.43, p.306-312, 1978. JAWORSKI, E.K. Nitrate reductase assay in intact plant tissues.
Biochemical and Biophysical Research Communications, v.43,
p.1274-1279, 1971.
JONES, R.W.; SHEARD, R.W. Conditions affecting in vivo nitrate reductase activity in chlorophyllous tissues. Canadian Journal of Botany, v.55, p.896-901, 1977.
KAWACHI, T.; SHOJI, Y.; SUGIMOTO, T.; OJI, Y.L.; KLEINHOFS, A.; WARNER, R.L.; OHTAKE, N.; OHYAMA, T.; SUEIOSHI, K. Role of xylem sap nitrate in regulation of nitrate reductase gene expression in leaves of barley (Hordeum vulgare L.) seedlings. Soil Science and Plant
Nutrition, v.48, p.79-85, 2002.
KLEPPER, L.; FLESHER, D.; HAGEMAN, R.H. Generation of reduced Nicotinamide Adenine Dinucleotide for nitrate reduction in green leaves.
Plant Physiology, v.48, p.580-590, 1971.
LAWRENCE, J.M.; HERRICK, H.E. Media for in vivo nitrate reductase assay of plant tissues. Plant Science Letters, v.24, p.17-26, 1982. LEA, P.J. Primary nitrogen metabolism. In: DAY, P.M.; J.B. HARBORN
(Ed.) Plant biochemistry. New York: Academic Press, 1997. cap.7, p.273-313.
LILLO, C. Studies of diurnal variations of nitrate reductase activity in barley leaves using various assay methods. Physiologia Plantarum, v.57, p.357-362, 1983.
LIN, W.H.; KAO, C.H. Factors affecting nitrate reductase activity in triticale.
Physiologia Plantarum, v.48, p.361-364, 1980.
MALAVOLTA, E. Elementos de nutrição mineral de plantas. São Paulo: Ed. Agronômica Ceres, 1981.
MITIDIERI, J. Manual de gramíneas e leguminosas para pastos tropicais.
São Paulo: EDUSP, 1983.
MULLER, E.K.H.; JANIESHCH, P. In vivo nitrate reductase activity in
Carex pseudocyperus L.: the influence of nitrate-ammonium
concentration ratios and correlation with growth. Journal of Plant
Nutrition, v.16, p.1357-1372, 1993.
NICHOLAS, J.C.; HARPER, J.E.; HAGEMAN, R.H. Nitrate reductase activity in soybeans (Glycine max [L] Merr.): 1. Effects of light and temperature. Plant Physiology, v.58, p.731-735, 1976.
PURANIK, R.M.; SRIVASTAVA, H.S. Increase in nitrate reductase activity in the presence of sucrose in bean leaf segments. Phytochemistry, v.22, p.2383-2387, 1983.
REYNOLDS, C.M.; WOLF, D.C.; ARMBRUSTER, J.A. Factors related to urea hydrolysis in soils. Soil Science Society of America Journal, v.49,
p.104-108, 1985.
ROBERTS, N.J.; MENARY, R.C. Effect of nitrogen on growth, flower yield, oil composition, and yield in Boronia megastigma Nees. Journal of
Plant Nutrition, v.17, p.2035-2052, 1994.
SKERMAN, P.J.; RIVEROS, F. Tropical grasses. Rome: FAO, 1990. 254p.
(FAO (Plant Production and Protection Series, 23).
STITT, M.; MÜLLER, C.; MATT, P.; GIBSON, Y.; CARILLO, P.; MORCUENDE, R.; SCHEIBLE, W.; KRAPP, A. Steps towards an integrated view of nitrogen metabolism. Journal of Experimental
Botany, v.53, p.959-970, 2002.
SOUZA, F.H.D. Brachiaria spp in Brazil. In: LOCH, D.S.; FERGUSSON, J.E. (Ed.) Forage seed production: tropical and subtropical species. New York: CAB International Publishing, 1999. v.2, p.371-379. SRIVASTAVA, H.S. Regulation of nitrate reductase activity in higher plants.
Phytochemistry, v.19, p.725-733, 1990.
STOLTZ, J.F.; BAZU, P. Evolution of nitrate reductase: Molecular and structural variations on a common function. Chembiochem, v.3, p.198-206, 2002.
STREETER, J.G.; BOSLER, M.E. Comparison of in vitro and in vivo assays for nitrate reductase in soybeans leaves. Plant Physiology, v.49,
p.448-450, 1972.
TINGEY, D.T.; FITES, R.C.; BAHARSJAH, J. Factors influencing nitrate reductase in soybean foliage. New Phytologyst, v.73, p.21-29, 1974. VIÉGAS, R.A.; MELLO, A.R.B.; SILVEIRA, J.A.G. Nitrate reductase
activity and proline accumulation in cashew in response to NaCl salt shock. Revista Brasileira de Fisiologia Vegetal, v.11, p.21-28, 1999. WATANABE, M.; HAYASHI, M.; SUGIYAMA, T. Effects of supplemental
nitrate application on the activity of some nitrogen assimilation enzymes and leaf tissue productivity in maize seedlings. Soil Science and Plant
Nutrition, v.31, p.573-580, 1985.