THE APPLICATION OF THE MULTIVARIATE ANALYSIS METHOD FOR SOME TRAITS IN WHEAT UNDER DROUGHT STRESS
Seyed Mehdi Mirtaheri*1, Farzad Paknejad2 and Marieh Behdad3
1
Young Researchers and Elite Club, Karaj Branch, Islamic Azad University, Karaj, Iran
2Department of Agronomy, Agriculture Research Centre, Karaj Branch,
Islamic Azad University, Karaj, Iran.
3Department of Agronomy, Karaj Branch,
Islamic Azad University, Karaj, Iran
Abstract: In order to evaluate the relationship between yield and some relevant traits and estimation of the most effective traits on grain yield, a split-plot experiment based on completely randomized block design with four replications was carried out in 2006–2007 in the research field of Islamic Azad University of Karaj. The irrigation schemes scheduled as main plots included the following: (T1)
40% moisture depletion throughout the growing season (control); (T2) 60%
moisture depletion throughout the growing season; (T3) 80% moisture depletion
throughout the growing season; (T4) no irrigation during the stem elongation stage
and continuing with adequate irrigation to the end of the growing season; (T5) no
irrigation from the stem elongation stage to the end of the growing season; (T6) no
irrigation at flowering and continuing with adequate irrigation to the end of the growing season; (T7) no irrigation from flowering to the end of the growing season;
and (T8) no irrigation from the milk stage to the end of the growing season; and 2
wheat cultivars [Marvdasht (V1), Chamran (V2)] as sub-plots. According to the
results of simple correlation, the grain yield exhibited the most positive correlation with biomass (0.877), number of infertile spikelets (0.876) and harvest index (0.855). The results of step-wise regression showed that, in the absence of drought stress, biomass and harvest index had respectively the most important effects on the grain yield but both exhibited different results under drought stress. Path analysis results showed that the most important effect on the grain yield in the total tested treatments was related to the biomass, justifying a total of 87% of grain yield variations, 72% of which is the direct effect of this trait on grain yield.
Key words: Bread wheat, drought stress, grain yield, multivariate analysis, yield components.
Introduction
Drought stress is one of the most important environmental stresses in agriculture (Cattivelli et al., 2008), therefore, understanding plant response to drought stress can play a main role in stabilizing crop responses under these conditions (Mirtaheri et al, 2013).
Sanjari and Yazdansepas (2008) in an investigation on twenty winter wheat genotypes under drought stress reported that the 1000-grain weight and weight of kernels per spike exhibited the greatest decrease as a result of water shortage; they also reported a positive correlation between grain yield and grain weight per spike and 1000-grain weight.
Shahryari et al. (2008) evaluated 42 genotypes of bread wheat under drought stress and reported that there was a positively significant correlation between grain yield and 1000-grain weight and total number of tillers per plant; on the other hand, genotypes showed significant differences in grain yield at 1% level. Nofouzi et al. (2008) used correlation coefficient, backward regression and path analysis to evaluate grain yield and reported that the number of seeds per spike, spike length and 1000-grain weight increased grain yield under drought stress. According to Aycicek and Yildirim (2006), an investigation by path analysis showed that there was a positive direct effect of plant height and grain weight per spike and a negative direct effect of time to heading with grain yield. In another study, the results of path analysis of durum wheat genotypes under drought stress showed that harvest index had the greatest positive effect and number of fertile tillers had the greatest negative effect on grain yield (Khaiatnezhad et al., 2010). The results of path analysis in well-watered conditions showed that biological yield, lawn length and harvest index had the greatest direct positive effects on durum wheat yield (Ahmadizadeh et al., 2011).
The aim of this research was to investigate the correlation between yield and yield components and other traits and to determine effective traits on yield under drought stress at different stages and under non-stress conditions.
Material and Methods
Description of the Research Site
Experiment Design and Treatments
A split-plot experiment was used based on a completely randomized block design with four replications. The following irrigation schedules were used: the main plot (T1) at 40% moisture depletion throughout the growing season (control);
(T2) 60% moisture depletion throughout the growing season; (T3) 80% moisture
depletion throughout the growing season; (T4) no irrigation during stem elongation
followed by adequate irrigation to the end of the season; (T5) no irrigation from
stem elongation to the end of the season; (T6) no irrigation at flowering followed
by adequate irrigation to the end of the season; (T7) no irrigation from flowering to
the end; and (T8) no irrigation from milk stage (70 in Zadoks scale) to the end.
Wheat cultivars including two Iranian [Marvdasht (V1), Chamran (V2)] were sown
with a plant density of 500 plant m2 with the 15-cm row spacing.
The experimental field received 100 P2O5 kg/h in the form of triple superphosphate applied during deep ploughing in autumn. Nitrogen fertilizer was applied at a rate of 150 kg of nitrogen per hectare in the form of urea, the first half of which was supplied during planting and the remaining half at the stem elongation stage. Sowing date was 13 November. Plots included 7 rows (4 m in length and 15 cm in width), with a distance of 1 m between the main plots, 0.5 m between the sub-plots and 3 m between replications. In order to apply drought stress, chalk blocks were used to constantly control the moisture in the plots, which were regulated with the soil moisture calibration curve as shown in Figure 1.
Figure 1. Soil moisture curve and changes of electrical conductivity of gypsum blocks.
All the plots were irrigated using an installed pipeline system. The first irrigation was scheduled on 13 November just after planting and then irrigation was
28 24
18,5
17 16
14,3 13
12 11,511,3 11
10,5 10 9,5 9
0 5 10 15 20 25 30
95 92 90 87 86 79 50 24 15 10 8 6 4 3 2
carried out according to defined treatment protocols. Data analysis was done using SAS (9.1) software and means were compared using Duncan’s multiple range tests at 0.05 probability level. Before statistical analysis, all data passed normality test and were transformed when needed.
Crop Sampling and Data Analysis
Measurements of the four traits under study plant height (cm), peduncle length, and the number of fertile and infertile spikelets were carried out on 10 normal plants randomly selected from the two middle rows of each plot. In other to evaluate grain yield, 1000-seed weight (g), biomass (g), harvest index (%), spike numbers in m2 and number of seeds per spike, two middle rows of each plot were harvested.
Results and Discussion
Variance Analysis and Comparison of Mean Values
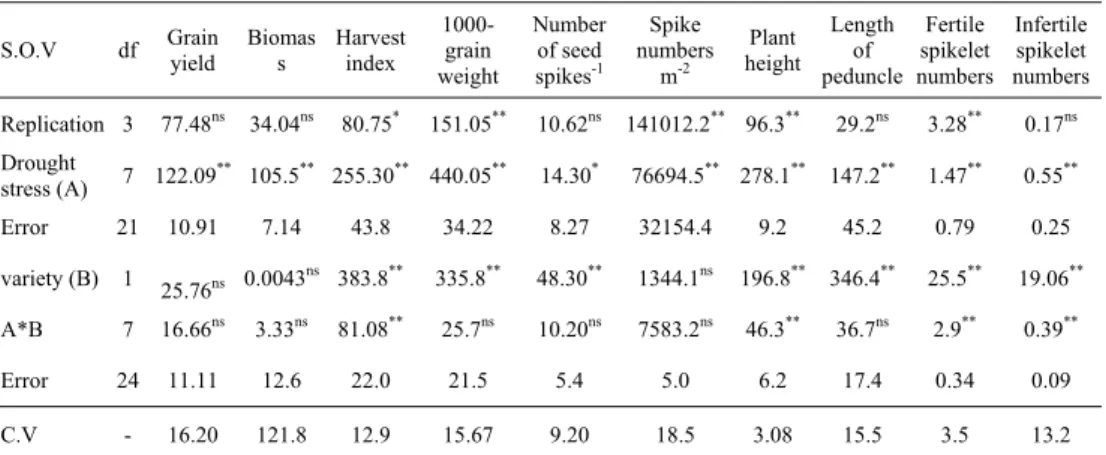
The results indicated that all stress treatments had exerted significantly different effects compared to the control treatment (Table 1); the highest grain yield was observed in the control treatment and the lowest grain yield was observed in T7 treatment, with T2 to T8 treatments exhibiting decreases of 15.7%,
37.8%, 13%, 61%, 45%, 62% and 43% in yield, respectively, compared to the control (results not reported here).
Table 1. Analysis of variance for grain yield and yield competitions for two wheat varieties sown under drought stress and normal conditions.
S.O.V df Grain yield
Biomas s
Harvest index
1000-grain weight
Number of seed spikes-1
Spike numbers
m-2
Plant height
Length of peduncle
Fertile spikelet numbers
Infertile spikelet numbers
Replication 3 77.48ns 34.04ns 80.75* 151.05 10.62** ns 141012.2** 29.296.3** 3.28ns ** 0.17ns
Drought
stress (A) 122.097 **
105.5** 255.30** 14.30440.05** 76694.5* ** 278.1** 1.47147.2** ** 0.55**
Error 21 10.91 7.14 34.2243.8 8.27 32154.4 9.2 45.2 0.79 0.25
variety (B) 1
25.76ns 0.0043ns 383.8** 335.8 48.30** 1344.1** 196.8ns ** 25.5346.4** ** 19.06**
A*B 7 16.66ns 3.33ns 81.08** 25.7ns 10.20 7583.2ns 46.3ns 36.7** 2.9ns ** 0.39**
Error 24 11.11 12.6 21.522.0 5.4 5.0 6.2 17.4 0.34 0.09
C.V - 16.20 121.8 15.6712.9 9.20 18.5 3.08 15.5 3.5 13.2
Some other researchers have reported that drought stress reduces grain yield in wheat (Sio-Se Marde et al., 2006; Li et al., 2011), the main results of which are reduction in photosynthesis rate and aging of leaves (reduction in source) and reduction in sink capacity (Ritchie et al., 1990).
Furthermore, stress treatment exhibited significant effects on the yield and all measured yield components. The interaction between drought stress and cultivars was significant for harvest index, plant height and fertile and infertile spikelet number traits and consequently it is expected that the cultivars will have different reactions to these traits.
Simple Correlation Coefficients
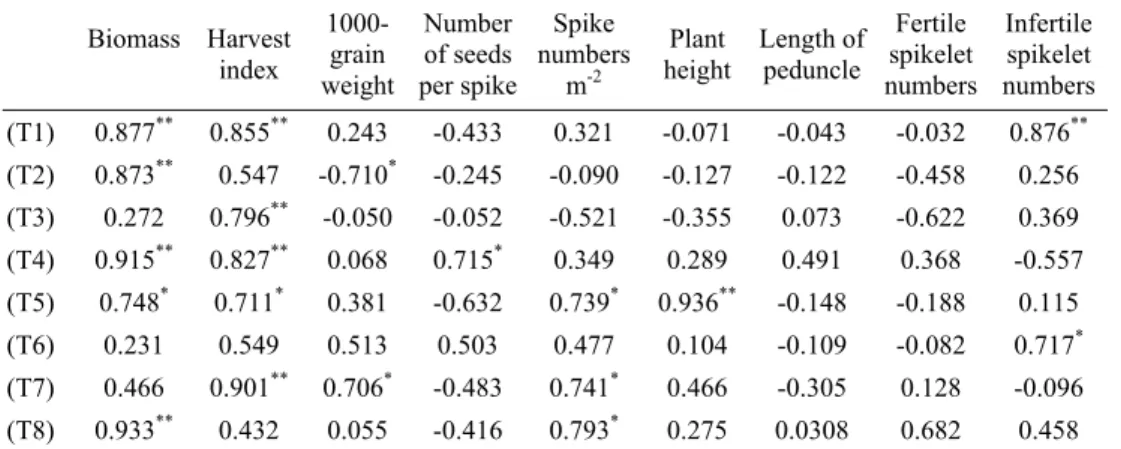
According to the results of simple correlation coefficients between wheat grain yield and other relevant traits, which are presented in Table 2, in case of no drought stress (treatment T1), the grain yield exhibited the most positive correlation with biological yield traits (0.877), number of infertile spikelets (0.876) and harvest index (0.855).
Table 2. Simple correlation coefficients between grain yield and 9 traits for wheat genotypes under drought stress.
Biomass Harvest index
1000- grain weight
Number of seeds per spike
Spike numbers
m-2
Plant height
Length of peduncle
Fertile spikelet numbers
Infertile spikelet numbers
(T1) 0.877** 0.855** 0.243 -0.433 0.321 -0.071 -0.043 -0.032 0.876** (T2) 0.873** 0.547 -0.710* -0.245 -0.090 -0.127 -0.122 -0.458 0.256 (T3) 0.272 0.796** -0.050 -0.052 -0.521 -0.355 0.073 -0.622 0.369 (T4) 0.915** 0.827** 0.068 0.715* 0.349 0.289 0.491 0.368 -0.557 (T5) 0.748* 0.711* 0.381 -0.632 0.739* 0.936** -0.148 -0.188 0.115 (T6) 0.231 0.549 0.513 0.503 0.477 0.104 -0.109 -0.082 0.717* (T7) 0.466 0.901** 0.706* -0.483 0.741* 0.466 -0.305 0.128 -0.096 (T8) 0.933** 0.432 0.055 -0.416 0.793* 0.275 0.0308 0.682 0.458 (T1) 40% moisture depletion throughout the growing season (control); (T2) 60% moisture depletion throughout the growing season; (T3) 80% moisture depletion throughout the growing season; (T4) no irrigation during the stem elongation stage followed by adequate irrigation to the end of the season; (T5) no irrigation from the stem elongation stage to the end of the season; (T6) no irrigation at flowering followed by adequate irrigation to the end of the season; (T7) no irrigation from the flowering stage to the end of the season; and (T8) no irrigation from the milk stage (70 in Zadoks scale) to the end of the season.
harvest index (Tables 2 and 3). Such a process of increasing the effect of harvest index on the yield might be observed when the finite stress treatment at the flowering stage is compared with infinite stress treatments (and consequently severe) from this stage up to the period end (Tables 2 and 3).
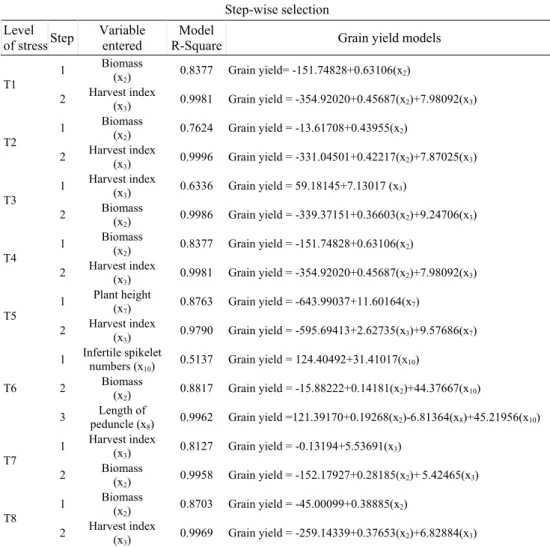
Table 3. A step-wise regression analysis between grain yield and 9 traits for wheat genotypes under drought stress.
Step-wise selection
Level of stressStep
Variable entered
Model
R-Square Grain yield models
T1
1 Biomass (x2)
0.8377 Grain yield= -151.74828+0.63106(x2)
2 Harvest index (x3)
0.9981 Grain yield = -354.92020+0.45687(x2)+7.98092(x3)
T2
1 Biomass (x2)
0.7624 Grain yield = -13.61708+0.43955(x2)
2 Harvest index (x3)
0.9996 Grain yield = -331.04501+0.42217(x2)+7.87025(x3)
T3
1 Harvest index (x3)
0.6336 Grain yield = 59.18145+7.13017 (x3)
2 Biomass (x2)
0.9986 Grain yield = -339.37151+0.36603(x2)+9.24706(x3)
T4
1 Biomass (x2)
0.8377 Grain yield = -151.74828+0.63106(x2)
2 Harvest index (x3)
0.9981 Grain yield = -354.92020+0.45687(x2)+7.98092(x3)
T5
1 Plant height (x7)
0.8763 Grain yield = -643.99037+11.60164(x7)
2 Harvest index (x3)
0.9790 Grain yield = -595.69413+2.62735(x3)+9.57686(x7)
T6
1 Infertile spikelet
numbers (x10) 0.5137 Grain yield = 124.40492+31.41017(x10)
2 Biomass
(x2) 0.8817 Grain yield = -15.88222+0.14181(x2)+44.37667(x10)
3 Length of
peduncle (x8) 0.9962 Grain yield =121.39170+0.19268(x2)-6.81364(x8)+45.21956(x10)
T7
1 Harvest index
(x3) 0.8127 Grain yield = -0.13194+5.53691(x3)
2 Biomass
(x2) 0.9958 Grain yield = -152.17927+0.28185(x2)+5.42465(x3)
T8
1 Biomass
(x2) 0.8703 Grain yield = -45.00099+0.38885(x2)
2 Harvest index (x
3) 0.9969 Grain yield = -259.14339+0.37653(x2)+6.82884(x3)
The most major factors affecting grain yield are biological yield and harvest index and with less effect, the number of grains per spike. However, the effect of drought stress, which will continue from this stage up to the end of growth period, was observed with less intensity; rather, plant height had the most positive relationship with grain yield (Table 2). The stress created during the stem elongation stage reduces plant height and peduncle length; however, because stem length is affected prior to peduncle length, it seems that the stem length might improve with the continuation of irrigation, but continuing this process causes the length of such plants affected by drought stress during the stemming stage to have the lowest rate (79 cm in the present study, Table 2). During drought stress, from the flowering stage to the end of growth period, the most negative effect on the number of grains per spike is observed, indicating the deleterious effects of drought on the grain formation, although this effect is not significant. On the whole, to have a drought stress at the flowering stage and then irrigating to the end of the season, did not show a negative effect. It might be attributed to differences in flowering stages between the main stems and tillers, compensating for the negative effects.
Step-wise Regression Analysis
According to Agrama (1996), a step-wise regression can reduce the effect of significantly non-important traits in regression model; in this way, traits accounting for considerable variations of dependent variables could be determined. The results of a step-wise regression analysis have been presented in Table 3 in order of priority of the most important and effective traits on the yield and separately in terms of appropriate irrigation conditions and different levels of drought stress.
Table 4. Direct and indirect effects of some yield components on grain yield based on path analysis.
Biomass Harvest
index
1000-grain weight
Plant height
Spike
numbers Total
Biomass 0.72 0.14 0.04 -0.15 0.12 0.87
Harvest index 0.18 0.56 0.04 -0.06 -0.05 0.68
1000-grain weight 0.28 0.21 0.10 -0.10 -0.03 0.46
Plant height 0.42 0.12 0.04 -0.25 0.19 0.51
Spike numbers 0.25 -0.10 -0.01 -0.15 0.32 0.31
Statements: underlined numbers indicate direct effects.
yield, respectively. Such results were observed in 60% moisture depletion stress treatment (T2), but in stress treatment with 80% moisture depletion (T3), harvest
index (0.6336) and biological yield (0.3650) had the greatest effect on grain yield, confirming the results reported in the simple correlation section. This finding necessitates the control of an increase in biomass under drought stress. Also in the second stage, plant height has a very important role.
Path analysis
In order to better explain the results of simple correlations and stage regression and also to determine the cause-and-effect relations to identify direct and indirect effects on components and enter the traits into a regression model, path analysis was applied following the method used by Dewey and Iu (Dewey and Iu, 1959). Considering the results of path analysis presented in Table 4, the greatest direct effect on the grain yield in the total treatments evaluated was related to the biological yield which justifies a total of 0.87 (the direct effect of this trait was 0.72) of grain yield variations (according to the findings of Singh et al., 2010). In this context, plant height traits had an indirect negative effect (-0.15) and harvest index traits (0.14), spike numbers (0.12) and grain weight (0.04) had direct positive effects. After this trait, harvest index with the direct effect of 0.56 had the greatest positive effect. According to the report of Jag Shoran et al. (2000), the next effective traits were spike numbers with 0.32 of positive effect and 1000-grain weight with 0.10 of positive effect, respectively. Meanwhile, the plant height trait with a direct negative effect of 0.25 had an important role.
Considering the results of comparison of the means (results not reported here), drought treatments, during the flowering stage, have the lowest grain yield rate, revealing the susceptibility of this stage to drought stress. Drought at flowering usually results in infertility, a major cause of which, though not the only one, is a reduction in assimilate flux to the developing ear below some threshold level necessary to sustain optimal grain growth (Yadav et al., 2004). Sangtarash (2010) reported the same results in different wheat genotypes. T3 treatment had a yield
equal to T8 drought stress treatment during grain filling, despite spending a major
quite significant correlation with the number of infertile spikelets, indicating probable source limitations in these two cultivars so that the limited substrate cannot support the large number of grains and upon its relative decrease, more appropriate distribution has occurred and finally grain yield has improved. The same result was shown in T6 (drought stress only during the flowering stage),
confirming previous results. A step-wise regression showed that increasing the irrigation intervals from irrigation in 40% moisture depletion to 80% moisture depletion, the drought stress resulted in a positive and significant relationship of grain yield with harvest index, indicating that upon a significant decrease in biological yield and grain yield, harvest index does not follow this trend and the decrease is so minor (Tables 2 and 3) because plant productivity under drought stress is strongly related to the processes of dry matter partitioning and temporal biomass distribution (Kage et al., 2004). On the other hand, in stress treatment from the stemming stage up to the end of attending stage, the plant height is very effective and considering this point, it might be suggested that in the regions where these varieties of stresses are common, it is better to use varieties with more height, and from among the applied varieties in this study, Marvdasht is better than Chamran.
According to direct and indirect effects of different traits on grain yield (Table 4), biomass and harvest index are the most important traits in these conditions. Habibi (2011) reported that, according to direct effects, characters under drought stress conditions, biomass and harvest index of wheat are the most important traits on grain yield. On the other hand, plant height has a negative direct effect on grain yield (Table 4) because reduced plant height in wheat, via the introduction of dwarfing genes (Rht-B1b and Rht-D1b) (Gale and Youssefian, 1985), has been associated with increased yield potential because of greater HI and lodging resistance (Araus et al., 2008). Totally simple correlation, a step-wise regression and path analysis concluded that biomass and harvest index could be the reliable criteria for selecting better cultivars in normal and drought areas. Therefore, emphasis on these traits during wheat breeding programs will be useful and a direct selection through this trait will be effective for yield improvement.
References
Agrama, H.A.S. (1996): Sequential path analysis of grain yield and its components in maize. Plant Breeding 115:343-346.
Ahmadizadeh, M., Shahbazi, H., Valizadeh, M., Zaefizadeh, M. (2011): Genetic diversity of durum wheat landraces using multivariate analysis under normal irrigation and drought stress conditions. African Journal of Agricultural Research 6:2294-2302.
Araus, J.L., Slafer, G.A., Royo, C., Dolores, S.M. (2008): Breeding for yield potential and stress adaptation in cereals. Critical Reviews in Plant Science 27:377-412.
Dewey, D.R., Iu, K.H. (1959): A correlation and path-coefficient analysis of crested wheat grass seed production. Agronomy Journal 51:515-519.
Cattivelli, L., Rizza, F., Badeck, F.W., Mazzucotelli, E., Mastrangelo, A.M., Francia, E., Marè, C., Tondelli, A., Stanca, A.M. (2008): Drought tolerance improvement in crop plants: An integrated view from breeding to genomics. Field Crops Research 105:1-14.
Gale, M.D., Youssefian, S. (1985): Dwarfing genes in wheat. In Rüssel, G. E. (ed.), Progress in Plant Breeding, Butterworth, London, pp. 1-35.
Habibi, G. (2011): Influence of drought on yield and yield components in white bean. World Academy of Science, Engineering and Technology 79:244-253.
Jag Shoran, A., Hariprasad, S., Kant, L., Mani, V.P., Chaudhan, V.S. (2000): Association and contribution of yield attributes to seed yield in wheat under varying environments in north western hills. Crop Research Hissar. 25:47-49.
Kage, H., Kochler, M., Stützel, H. (2004): Root growth and dry matter partitioning of cauliflower under drought stress condi-tions: measurement and simulation. Europian Journal of Agronomy 20:379-394.
Khayatnezhad, M., Zaefizadeh, M., Gholamin, R., Jamaati-e-Somarin, S. (2010): Study of genetic diversity and path analysis for yield in durum wheat genotype under water and dry conditions. World Applied Science Journal 9:655-665.
Li, P., Chen, J., Wu, P. (2011): Agronomic characteristics and grain yield of 30 spring wheat genotypes under drought stress and non-stress conditions. Agronomy Journal 103:1619-1628. Mirtaheri, S.M., Paknejad, F., Behdad, M., Tookalo, M.R (2013): Investigation of relationship
between yield and yield components of wheat under drought stress using multivariate analysis. International Journal of Biosciences 3(6):8-14.
Nofouzi, F., Rashidi, V., Tarinejad, A.R. (2008): Path Analysis of grain yield with its components in durum wheat under drought stress. Proceedings of the international meeting on soil fertility land management and agro climatology. Turkey, pp. 681-686.
Paknejad, F., Nasri, M., Tohidi Moghadam, H.R., Zahedi, H., Jami Alahmadi, M. (2007): Effects of drought stress on chlorophyll fluorescence parameters, chlorophyll content and grain yield of wheat cultivars. Journal of Biological Science 7:841-847.
Ritchie, S.W., Henry, T., Scott Holaday, A. (1990): Leaf water content and gas-exchange parameters of two wheat genotypes differing in drought resistance. Crop Science 30:105-111.
Sangtarash, M.H. (2010): Responses of different Wheat genotypes to drought stress applied at different growth stages. Pakistan Journal of Biological Science 13:114-119.
Sanjari, P.A., Yazdansepas, A. (2008): Mobilization of dry matter and its relation with drought stress in wheat genotypes. Journal of Agricultural Science and Technology 11:121-129.
Shahryari R, Gurbanov E, Gadimov A, Hassanpanah D (2008): Tolerance of 42 bread wheat genotypes to drought stress after anthesis. Pakistan Journal of Biological Science 11:1330-1335. Singh, B.N., Vishwakarma, S.R., Kumar Singh, V. (2010): Character association and path analisys in
elite lines of wheat (Triticum aestivum L.). Plant Archives 10:845-847.
Sio-se, Marde, A., Ahmadi, A., Poustini, K., Mohammadi, V. (2006): Evaluation of drought resistance indices under various environmental conditions. Field Crop Research 98:222-229. Yadav, R.S., Hash, C.T., Bidinger, F.R., Devos, K.M., Howarth, C.J. (2004): Genomic regions
associated with grain yield and aspects of post flowering drought tolerance in pearl millet across environments and tester background. Euphytica 136:265-27.
PRIMENA METODA MULTIVARIJACIONE ANALIZE NA NEKE OSOBINE PŠENICE U USLOVIMA STRESA IZAZVANOG SUŠOM
Seyed Mehdi Mirtaheri*1, Farzad Paknejad2 i Marieh Behdad3
1Mladi istraživači i Elitni klub, Ogranak u Karadžu,
Islamski slobodni univerzitet, Karadž, Iran
2Odsek za agronomiju, Centar za poljoprivredna istraživanja,
Ogranak u Karadžu, Islamski slobodni univerzitet, Karadž, Iran.
3Odsek za agronomiju, Ogranak u Karadžu, Islamski slobodni univerzitet,
Karadž, Iran R e z i m e
U cilju procene odnosa između prinosa i nekih relevantnih osobina i procene osobina koje najviše utiču na prinos zrna, sproveden je eksperiment sa podeljenim parcelama zasnovan na potpuno slučajnom blok sistemu sa četiri ponavljanja tokom 2006–2007. godine na istraživačkom polju Islamskog slobodnog univerziteta u Karadžu. Sheme navodjavanja planirane kao glavne parcele su uključivale sledeće tretmane: (T1) 40% smanjenje vlage tokom vegetacione sezone (kontrola); (T2) 60%
smanjenje vlage tokom vegetacione sezone; (T3) 80% smanjenje vlage tokom
vegetacione sezone; (T4) bez navodnjavanja u fazi intenzivnog porasta stabla i
nastavljenje adekvatnog navodnjavanja do kraja sezone; (T5) bez navodnjavanja od
faze intenzivnog porasta stabla do kraja vegetacione sezone; (T6) bez navodnjavanja
u fazi cvetanja i nastavljanje sa adekvatnim navodnjavanjem do kraja sezone; (T7)
bez navodnjavanja od faze cvetanja do kraja vegatacione sezone; i (T8) bez
navodnjavanja od faze mlečnog zrenja do kraja sezone; i dve sorte pšenice [Marvdasht (V1), Chamran (V2)] kao potparcele. Prema rezultatima jednostruke
korelacije, prinos zrna je bio u pozitivnoj korelaciji sa biomasom (0,877), brojem infertilnih klasića (0,876) i žetvenim indeksom (0,855). Rezultati delimične regresije su pokazali da, u odsustvu stresa izazvanog sušom, biomasa odnosno žetveni indeks imaju najvažnije uticaje na prinos zrna, ali da su oba pokazala različite rezultate u uslovima stresa izazvanog sušom. Rezultati path analize su pokazali da je najvažniji uticaj na prinos zrna kod svih proučavanih tretmana povezan sa biomasom, opravdavajući ukupno 87% varijacija prinosa zrna, od čega 72% predstavlja direktan uticaj ove osobine na prinos zrna.
Ključne reči: Hlebna pšenica, stres izazvan sušom, prinos zrna, multivarijaciona analiza, komponente prinosa.
Primljeno: 25. marta 2015. Odobreno: 28. maja 2015.