Helicobacter pylori
Infection in Human: Is it Head or Tail
of the Coin?
Fadi Al-Sammak
1, Thomas Kalinski
2, Sönke Weinert
3, Alexander Link
1, Thomas Wex
1,4*, Peter
Malfertheiner
11 Department of Gastroenterology, Hepatology and Infectious Diseases, Otto-von-Guericke University, Magdeburg, Germany, 2 Department of Pathology, Otto-von-Guericke University, Magdeburg, Germany, 3 Department of Cardiology, Angiology and Pneumology, Otto-von-Guericke University, Magdeburg, Germany, 4 Medical Laboratory for Clinical Chemistry, Microbiology and Infectious Diseases, Department of Molecular Genetics, Magdeburg, Germany
Abstract
Recently, there has been a growing interest in an expanding group of cytokines known as “IL-12 family”. The so far gained knowledge about these cytokines, as crucial playmakers in mucosal immunity, has not yet been sufficiently investigated in the context of Helicobacter pylori infection. All genes encoding the monomeric components of these cytokines and their corresponding receptors were examined in gastric epithelial cell lines (AGS and MKN-28) after being infected with 4 H. pylori strains: BCM-300, P1 wild-type, and P1-derived isogenic mutants lacking cytotoxin-associated gene A (cagA) or virulence gene virB7 (multiplicity of infection=50). Both infected and uninfected samples were analyzed after 24h and 48h using real-time quantitative polymerase chain reaction (RT-qPCR). Gene expression analysis demonstrated a strong upregulation of IL23A (encodes p19) by infection, whereas IL23R, Epstein–Barr virus-induced gene 3 (EBI3), IL6ST, IL12A, and IL27RA were found to be expressed, but not regulated, or to a lesser extent. Transcripts of IL12RB2, IL12B, IL12RB1, and IL27A were not detected. Interestingly, P1 resulted in stronger alterations of expression than CagA mutant and BCM-300, particularly for IL23A (59.7-fold versus 32.4- and 6.7-fold, respectively in AGS after 48h, P<.05), whereas no changes were seen with VirB7 mutant. In a proof-of-principle experiment, we demonstrated epithelial-derived expression of IL-12, p19, and Ebi3 in gastric mucosa of gastritis patients using immunohistochemistry (IHC). Unlike IL-12 and Ebi3, increased immunostaining of p19 was observed in H. pylori gastritis. Herein, we highlight the potential role of gastric epithelial cells in mucosal immunity, not only because they are predominant cell type in mucosa and initial site of host-bacterial interaction, but also as a major contributor to molecules that are thought to be primarily expressed by immune cells so far. Of these molecules, p19 was the most relevant one to H. pylori infection in terms of expression and localization.
Citation: Al-Sammak F, Kalinski T, Weinert S, Link A, Wex T, et al. (2013) Gastric Epithelial Expression of IL-12 Cytokine Family in Helicobacter pylori Infection in Human: Is it Head or Tail of the Coin? PLoS ONE 8(9): e75192. doi:10.1371/journal.pone.0075192
Editor: Josep Bassaganya-Riera, Virginia Tech, United States of America
Received February 11, 2013; Accepted August 14, 2013; Published September 17, 2013
Copyright: © 2013 Al-Sammak et al. This is an open-access article distributed under the terms of the Creative Commons Attribution License, which permits unrestricted use, distribution, and reproduction in any medium, provided the original author and source are credited.
Funding: This work was supported by a joint scholarship program between the German Academic Exchange Service (DAAD) and the Iraqi Ministry of Higher Education and Scientific Research in Baghdad (MoHESR); Al-Nahrain University, College of Medicine. This work was also supported in part by a grant from the BMBF (BMBF-0315905D) in the frame of ERA-Net PathoGenoMics project. The funders had no role in study design, data collection and analysis, decision to publish, or preparation of the manuscript.
Competing interests: The authors have declared that no competing interests exist. * E-mail: t.wex@schenk-ansorge.de
Introduction
The pathological spectrum associated with Helicobacter pylori infection is broad and ranges from asymptomatic chronic gastritis to gastric cancer. The outcome is defined by complex host-pathogen interactions. On the host part, a balance between gastric mucosal immunity and tolerance is maintained by intricate network of signaling pathways. A large body of evidence suggests that Th1, and most recently Th17, mediate a proinflammatory response against H. pylori infection towards clearance, whereas regulatory T (Treg) cells mediate
β chains. A summarizing diagram of these chains, composite cytokines, and their receptors is provided in Figure 1. Similar to IL-12 for Th1 cells, IL-23 can serve to expand and stabilize Th17 responses [2]. It has also been reported that IL-23 can activate Th1 memory cells [3] and inhibit accumulation of Treg cells in the intestine [4]. IL-27 was initially identified to be a proinflammatory cytokine by initiation of Th1 response [5]; however, subsequent studies revealed its pleiotropic nature mainly with an anti-inflammatory capacity as reviewed in 6. Finally, the most recent member of the family is IL-35 [7], which is known to be a potent inhibitor and secreted by Treg cells [8,9].
Virulent strains of H. pylori are associated with more severe inflammation of the gastric mucosa. The cytotoxin-associated gene pathogenicity island (cag PAI) encompasses 32 genes including cagA, which encodes CagA protein [10]. The other genes encode a type IV secretion system (T4SS), a sort of a molecular syringe to translocate CagA and other molecules into the eukaryotic cells (reviewed in 11). The translocation and phosphorylation of CagA are followed by activation of NF-κB, induction of the proinflammatory cytokine IL-8, and remodeling of the gastric epithelial cytoskeleton [12,13]. Other factors, not encoded by cag PAI, have also been linked with more severe clinical outcome like VacA (a secretory multi-functional toxin), OipA, and DupA.
In recent years, there has been an increasing amount of literature on IL-12 family using different models and approaches. Apart from the fact that the majority of these studies were out of H. pylori context, their results should be interpreted with caution because of unawareness of the heterodimeric structure and frequency of chain sharing. For instance, p40-/- mice lack both IL-12 and IL-23; consequently,
any observed phenotype might be due to lack of one or both of these cytokines. Likewise, the approach of using p40 neutralizing antibodies is less straightforward and needs to be re-evaluated. The unique approach of this study is the complete analysis of IL-12 family, distilled to its five currently known monomeric chains with their receptors, using real time quantitative PCR (RT-qPCR), to gain basic insight into the influence of different virulent strains of H. pylori on the expression of all studied transcripts in AGS and MKN-28 cell lines as a gastric epithelial cell model. To evaluate the epithelial expression of IL-12 family in gastric mucosa at the protein level, we performed immunohistochemical staining of gastric biopsies from gastritis patients with and without H. pylori
infection.
Materials and Methods
Ethics Statement
Gastric biopsies were obtained from patients who underwent upper gastrointestinal endoscopy at the Department of Gastroenterology, Hepatology and Infectious Diseases, Otto-von-Guericke University in the frame of ERA-Net PathoGenoMics project. The study protocol was approved by Institutional Review Board at Otto-von-Guericke University, and all subjects provided a written informed consent.
Cell Lines and H. pylori Strains
Human gastric epithelial cell lines were purchased from American Type Culture Collection (ATCC) and the Japanese Cancer Research Resources Bank: AGS (CRL-1739) and MKN-28 (JCRB-0253), respectively. Gastric cancer cells were maintained in 75cm2 cell culture flasks (NUNC GmbH,
Wiesbaden, Germany) in a cell incubator at 37°C and 5% CO2.
All cell lines were cultivated using RPMI-1640 containing 10% fetal calf serum (FCS), 100U/mL Penicillin, 100µg/mL streptomycin, and 100µg/mL gentamycin. All reagents were purchased from PAA (Cölbe, Germany). Infection studies were implemented using a previously described H. pylori cagA+ and vacA s1/m1 wild-type P1 strain along with its two isogenic mutants: P1∆cagA and P1∆virB7; we called them “M1” and “M2”, respectively. VirB7 protein is crucial for the assembly of the T4SS and its lack would render the whole T4SS non-functional [14]. Another strain was included in this study which is H. pylori ATCC® BAA-1606™ (cagA+, vacA s1/m1, babA2, oipA functional, and designated BCM-300), the same strain was previously used to challenge healthy volunteers in a vaccine trial against H. pylori [15]. These strains were cultivated on selective agar plates (bioMérieux, Marcy l’Etoile, France) under microaerophilic conditions at 37°C for 2 days. 2x10⁵ cells of AGS and MKN-28 were seeded in complete
medium in 6-well plates (Greiner Bio-One GmbH, Frickenhausen, Germany) and cultivated for 24h. After washing cells twice with medium without FCS and antibiotics, cells were infected with H. pylori strains at a multiplicity of infection (MOI) of 50 suspended in antibiotic-free medium containing 10% FCS. Bacterial suspensions were adjusted based on optical density at 535nm and 550nm for BCM-300 and other strains, respectively (OD=1 corresponds to 1x10⁹ bacteria). To ensure
functional active bacteria, suspensions were microscopically inspected for shape and motility. Uninfected cells were included as controls. All cells were cultivated and harvested for RNA extraction after 24h and 48h. Likewise, another experiment was performed in which only BCM-300 strain was used to infect AGS and MKN-28 cells in a 6-well plate either directly or indirectly by using a 0.22µm filter cap to separate the bacteria from the cells, while allowing its secretory factors to pass through. All cells were also harvested for RNA extraction after being cultivated for 24h and 48h. Both experiments were replicated 4 times.
Real-Time Quantitative PCR (RT-qPCR)
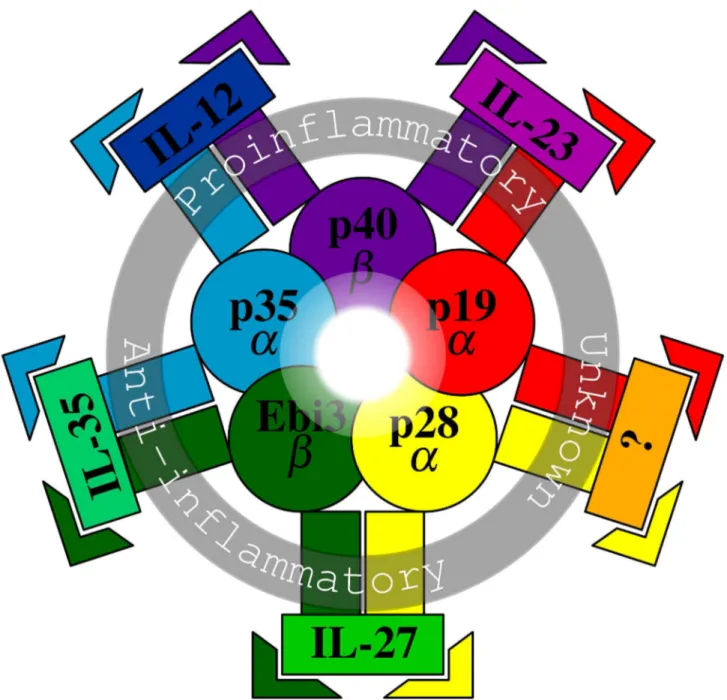
Figure 1. Schematic diagram of IL-12 family. The diagram illustrates the currently known 5 chains (the innermost zone), composite cytokines with their proposed functions (the middle zone), and their receptors (the outermost zone). The five color-coded chains are either α chains (p19, p35, and p28) or β chains (p40 and Ebi3). Each functional cytokine is made of one α and one β chain. IL-12 (p35/p40) is a proinflammatory Th1 activator and stabilizer. Similarly, IL-23 (p19/p40) is a proinflammatory Th1 activator and Th17 stabilizer. On the other hand, IL-27 (p28/Ebi3) is an immunoregulatory cytokine mainly with an anti-inflammatory capacity. IL-35 (p35/Ebi3) is again anti-inflammatory and secreted by Treg cells. Therefore, the four cytokines with their divergent functions can promote a representative model of the immunological spectrum ranging from inflammation to tolerance. The unknown cytokine is a theoretical one and symbolizes the possibility of unraveling other unknown family members in the future. Each chain (p19, p40, p35, Ebi3, p28) binds to its specific receptor (IL23R, IL12RB1, IL12RB2, IL6ST, and IL27RA, respectively) and is coded with the same color of the corresponding chain (receptor names are not shown). Typically, a composite cytokine would require a β chain receptor for high affinity binding and an α chain receptor for signal transduction. For alternative terminology of IL-12 family members refer to Table 1.
were determined by dilution curves. Only primer sets with an amplification factor of 1.9 or more were selected for the analysis. In addition to IL-12-related genes, we investigated the expression of IL8, for being well documented to be induced by gastric epithelial cells upon infection with H. pylori [16]. All primer details are provided in Table 1. PCR reaction setup and cycling conditions were set according to QuantiTect™ SYBR Green kit (Qiagen, Hilden, Germany) with reaction volume of 30µL, primer concentration at 0.3µM, and for 40 cycles (Table 1). All experimental replicates were analyzed in one 96-well plate along with negative (NTC) and positive controls. Quantification cycles (Cqs) of the studied transcripts were measured using CFX96-Cycler™ (BioRad, Munich, Germany). Melting curve analysis of the PCR products was also performed. Expression was normalized against two reference genes (ACTB and RPL29) in light of recent data [17]. Normalized relative quantities (NRQs) and fold changes were calculated using the geNorm algorithm [18] with the aid of R based ”SLqPCR” package [19]. Stability index (M) of the two reference genes was 0.5 and 0.7 for the two aforementioned cell line experiments, respectively.
Immunohistochemistry (IHC)
The formalin-fixed, paraffin-embedded specimens of gastric biopsies from antrum and corpus of gastritis patients with and without H. pylori infection (5 of each) were collected from the archive of the Pathology Department. Cases were classified as
H. pylori positive or negative only if all of the three tests (urease, histology, and microbiological culture) were positive or negative, respectively. Biopsies of atrophic gastritis and/or intestinal metaplasia were excluded. IHC was performed with avidin–biotin complex immunostaining method using automated Nexes slide stainer (Ventana Medical Systems, Tucson, AZ, USA). Sections of the specimens (3µm thick) were mounted on SuperFrost Plus glass slides (Menzel, Braunschweig, Germany), dewaxed by immersion in xylene, and rehydrated by descending concentrations of ethanol. Heat-mediated antigen retrieval was performed for 30sec at 120°C using DakoCytomation Pascal pressure chamber (DakoCytomation, Glostrup, Denmark) in 1mM citrate pH 6.0 for IL-12, or in 1mM EDTA pH 8.0 for both p19 and Ebi3. Slides were incubated at room temperature (RT) with anti-IL-12 antibody (ab9992; Abcam, Cambridge, UK), anti-p19 antibody (ab45420; Abcam), anti-Ebi3 antibody (ab83896; Abcam), diluted to 1/50, 1/100, 1/200, for 30min, 1h, and 1h, respectively. The reactions were visualized using 3,3’-diaminobenzidine (DAB) for IL-12 and Ebi3 or enhanced alkaline phosphatase (AP) for p19. The slides were counterstained with hematoxylin, embedded in mounting medium, and cover-slipped. Microscopic evaluation of the staining results was performed using a Zeiss Axioplan microscope (Zeiss, Oberkochen, Germany) and an Olympus DP26 digital camera (Olympus, Tokyo, Japan). Tissue sections from human astrocytoma tumor, normal kidney, and normal spleen were used as tissue positive controls for IL-12, anti-p19, and anti-Ebi3 antibodies, respectively. For negative controls, primary antibody was replaced with PBS buffer and did not reveal specific signals (data not shown).
Immunofluorescence (IF)
The same serial sections from gastritis cases were used for IF staining of p19. Dewaxing, rehydration, and heat-mediated antigen retrieval were performed the same way as in IHC for p19. Slides were blocked with PBS containing 10% FCS for 1h, followed by 1h incubation at RT with anti-19 antibody (ab45420; Abcam) diluted to 1/100. For negative controls, primary antibody was replaced by PBS buffer. Slides were then washed three times and incubated with anti-rabbit Cy3-conjugated F(ab')2 fragments (Sigma-Aldrich, Inc., St. Louis, MO, USA) at a dilution of 10µg/mL for another 1h, followed by additional washing, 4',6-diamidino-2-phenylindole (DAPI) staining, and mounting for fluorescence microscopy.
Microscopy and Image Processing
Microscopy was performed with Zeiss Axiovert 200m-based epi-fluorescence wide-field imaging system (Carl Zeiss MicroImaging GmbH, Jena, Germany), equipped with a fluorescence filter set; Zeiss No. 49, HQ-Cy3.5 (EX 565/30, BS 585, EM 620/60) (Chroma Technology Corp., Bellows Falls, VT, USA), a scanning stage (Märzhäuser Wetzlar GmbH & Co. KG, Wetzlar, Germany), and an AxioCam MRm camera (Carl Zeiss MicroImaging GmbH). Images were acquired with Neofluar 10x/0.30 Ph1 for stitched overviews, and EC, Plan-Neofluar 40x/0.75 Ph2 for higher magnified regions of interest (ROI). To prove the comparability between the sample section and its adjacent control section, all acquisition parameters, i.e., acquisition time, camera gain, and light intensity were kept constant. Acquisition and device control were performed using AxioVision 4.8.1 software (Carl Zeiss MicroImaging GmbH).
Statistical Analysis
Fold changes were logarithmically transformed before implementing statistical analysis. For comparisons among different H. pylori strains, non-parametric Kruskal-Wallis test was performed. Pairwise comparisons were then implemented using Mann-Whitney U test with multiple testing correction using Benjamini-Hochberg (BH) procedure. Correlation analysis was performed using non-parametric Spearman’s rho
test. For all tests, two-tailed P-values <.05 were considered significant. All statistical tests were conducted using R programming language [20] and graphs were generated with the aid of R based “ggplot2” package [21].
Results
Gene Expression Profile of IL-12-Related Molecules in Gastric Epithelial Cells
not detected in epithelial cells. Generally, both cell lines showed a similar expression pattern for all investigated transcripts (Figure 2).
Gene Expression of IL-12-Related Molecules in Context of H. pylori Infection
To evaluate the effect of H. pylori infection on expression of the investigated genes, we analyzed fold changes of the detected transcripts in AGS and MKN-28 cells after infection
Table 1. Primers used for RT-qPCR analysis.
Transcript Primer sequence1 RefSeq2 AnT3 Amplicon Exons4 Intron E5
(from 5’ to 3’) (°C) size (bp) size (bp)
ACTB (a reference gene that encodes a cytoskeletal actin)
fwd AAGGCCAACCGCGAGAAGATG NM_001101 57 100 f (3,4)-6 441 2
rev CAGAGGCGTACAGGGATAGCAC
RPL29 (a reference gene that encodes a ribosomal protein in the 60S subunit)
fwd GCCAAGTCCAAGAACCACAC NM_000992 57 133 f (2,4)-4 1233 2
rev CAAAGCGCATGTTCCTCAGG
IL8 (encodes a protein in the CXC chemokine family called IL-8)
fwd CTTCCTGATTTCTGCAGCTCTG NM_000584 57 193 f (1,3)-4 1090 2
rev GAGCTCTCTTCCATCAGAAAGC
IL23A (encodes p19 that pairs with p40 to form IL-23)
fwd GACACATGGATCTAAGAGAAGAG NM_016584 57 109 s (1,3)-4 385 1.95
rev AACTGACTGTTGTCCCTGAG
IL23R (encodes IL23A receptor which is required, along with IL12RB1, for signaling of IL-23 via p19)
fwd TCCTGTGAAATGAGATACAAGGC NM_144701 59 104 f (6,7)-11 12518 1.95
rev GGCTCCAAGTAGAATTCTGACTG
EBI3 (IL27B, encodes Ebi3 that pairs with p28 to form IL-27)
fwd AGCTTCGTGCCTTTCATAACAG NM_005755 57 140 f (3,4)-5 1359 2
rev AGTGAGAAGATCTCTGGGAAGG
IL6ST (gp130, oncostatin M receptor, CD130, encodes a signal transducer that is shared by many cytokines)
fwd ACTGTCCAAGACCTTAAACCT NM_001190981 57 145 f (7,8)-17 3110 1.98
rev AGAAACTTGGTGCTTTAGATGG
IL12A (NKSF1, CLMF1, encodes p35 that pairs with p40 and Ebi3 to form IL-12 and IL-35, respectively)
fwd AATGTTCCCATGCCTTCACC NM_000882 59 110 f (2,3)-7 2699 2
rev CAATCTCTTCAGAAGTGCAAGGG
IL12RB2 (encodes a protein that, along with IL12RB1, forms a high affinity receptor for IL-12 via p35)
fwd CCTCTTCACTTCCATCCACATTC NM_001559 57 137 f (5,6)-16 1202 1.96
rev AAGCAGTACCAGTCCCTCATC
IL12B (NKSF2, CLMF2, encodes p40 that pairs with p35 and p19 to form IL-12 and IL-23, respectively)
fwd GGACATCATCAAACCTGACC NM_002187 56 123 s (5,6)-8 1412 2
rev AGGGAGAAGTAGGAATGTGG
IL12RB1 (encodes a low affinity protein that, along with IL12RB2, forms IL-12 receptor)
fwd GCTGTACACTGTCACACTCTG NM_005535 57 132 f (4,5)-17 3176 1.9
rev AACTTGGACACCTTGATGTCTC
IL27A (IL30, encodes p28 that pairs with Ebi3 to form IL-27)
fwd CTCCCTGATGTTTCCCTGAC NM_145659 57 145 f (3,4)-5 1560 2
rev TCCTCTCCATGTTGGTCCAG
IL27RA (WSX1, CRL1, TCCR, zcytor1, encodes a glycosylated transmembrane protein)
fwd AGATGTGTGGGTATCAGGGAAC NM_004843 57 102 f (6,7)-14 3364 2
rev ACTTTGTAGCTCACCTGCAC
1 Letters in bold represent the spanning part of the sequence
2 RefSeq; the NCBI database of reference sequences (http://www.ncbi.nlm.nih.gov) 3 AnT; annealing temperature of the qPCR reaction (9515, 94´15, AnT´30, 72´30, 725)
4 Indicates which exons flanked (f) or spanned (s) by a primer set followed by the total number of exons for that transcript, e.g., ACTB primer set flanks exon 3 and exon 4
of 6 total exons
5 Amplification efficiency as determined by dilution curve
with different strains of H. pylori for 24h and 48h. Additionally,
IL8 was included as an internal control to our study for being constitutively expressed by gastric epithelial cells and induced upon H. pylori infection as well. Both CagA positive strains BCM-300 and P1, as well as P1-derived isogenic mutant M1, showed a consistent induction of IL8 transcript levels after 24h and 48h, whereas M2 mostly did not induce IL-8 mRNA levels (Table 2). The highest increase was seen in MKN-28 cells after 24h infection with P1 strain (median of 17.5-fold). Concerning IL-12-related genes, IL23A showed a pronounced expression pattern similar to that of IL8. In general, transcript levels of
IL23A in AGS were higher than those in MKN-28 cells. The highest expression levels in AGS were observed after 48h of infection with P1 and M1 strains (medians of 59.7-fold and
32.4-fold, respectively), lower levels were attained with BCM-300 infection (median of 6.7-fold), whereas no induced expression was seen with M2 strain (Figure 3). The upregulation of IL6ST and EBI3 was less pronounced after infection compared to that of IL8 and IL23A (Table 2). On the other hand, IL23R was found to be downregulated in MKN-28 cells after 48h of infection with P1 and its two isogenic mutants (P<.05), but not with BCM-300 strain. Of note, IL27RA
expression showed a decreasing trend over time, but this observation did not reach a significant level (Table 2). Finally, no significant alterations were found in IL12A after infection in both cell lines (P>.05). A consistent pattern was observed by comparing fold changes of most transcripts in P1 with those of its two isogenic mutants. Infection by P1 resulted in more and
Figure 2. Boxplots of raw Cqs of the detected transcripts by RT-qPCR in non-infected AGS and MKN-28. Each box represents the lower quartile, the median, and the upper quartile score (vertical lines of the box). Means (small white squares) and outliers are also shown (black dots). Expression levels of detected transcripts were ordered in AGS cell line from highest (ACTB) to lowest (IL23R) based on their median values. Similar ranking order was seen in MKN-28 cells except for the least four abundant transcripts: IL23A, IL12A, EBI3, and IL23R.
stronger alterations than M1, whereas M2 was mostly similar to controls (without H. pylori). Overall, BCM-300 strain demonstrated an expression pattern that was more or less similar to that of P1 and M1 (Table 2).
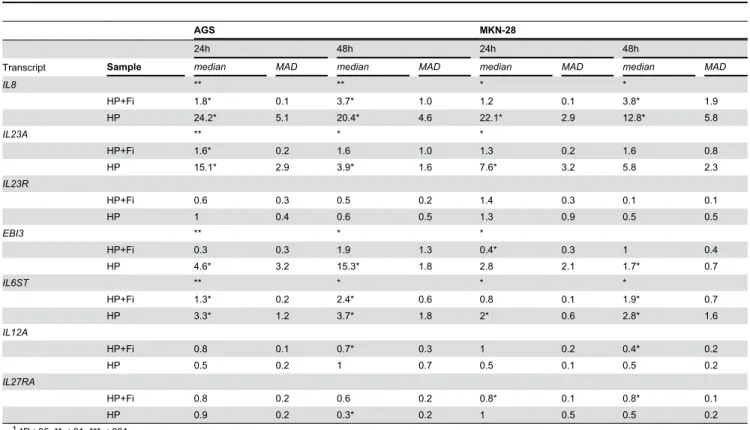
BCM-300-Induced Alterations Depend on Direct Contact with Gastric Epithelial Cells
Using a 0.22µm filter cap we studied whether direct contact between bacteria and epithelial cells is critical for the expression of IL-12-related transcripts. As summarized in Table 3, most altered gene expression patterns were found to be dependent on the direct contact between cells and bacteria. Application of the filter cap prevented most of these alterations; however, some of the alterations remained significant even after application of the filter cap (e.g., IL23A; 1.6-fold, P<.05), but the magnitude of the fold change was minute compared to that observed with the direct contact (15.1-fold, P<.05).
Exploring the Relationship between IL23A and Other Transcripts after Infection with Different H. pylori
Strains in Gastric Epithelial Cells
In order to discover important relationships between IL23A
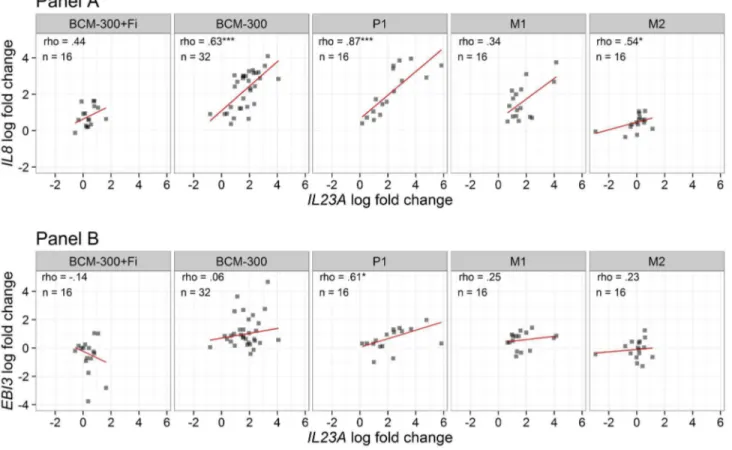
and other studied transcripts we implemented a Spearman’s correlation analysis of the logarithmically transformed fold changes of the transcripts. Data are exemplarily illustrated in Figure 4 and summarized in Table 4. The correlation between
IL23A and IL8 as illustrated in Figure 4A was the highest with P1 and BCM-300 strains (ρ=.87 and ρ=.63, respectively, P<. 001) and less pronounced with M2 (ρ=.54, P<.05), whereas this correlation was lost when CagA protein is not expressed in M1 isogenic strain, or after application of the filter cap (P>.05). Remarkably, IL23A was positively correlated with EBI3 after infection with P1 strain only (P<.05, Figure 4B). As shown in Table 4, the correlation between IL23A and IL6ST was only seen after infection with BCM-300 and P1 strains (P<.05). On
Figure 3. Barcharts of IL23A median fold change by RT-qPCR in AGS and MKN-28 (n=4). BCM-300, P1, M1, and M2 are H. pylori strains. Both BCM-300 and P1 (wild-type) are CagA strains, whereas M1 and M2 are P1-derived isogenic mutants lacking CagA and VirB7, respectively. Generally, higher expression levels were seen in AGS more than MKN-28 cells. Significant upregulation of IL23A was seen in both cells with BCM-300, P1 (the highest), and M1 strain (P<.05), whereas no alteration was seen after M2 infection (non-functional T4SS) similar to that of the non-infected control samples (CO).
the other hand, no correlation was found between IL23A and
IL27RA.
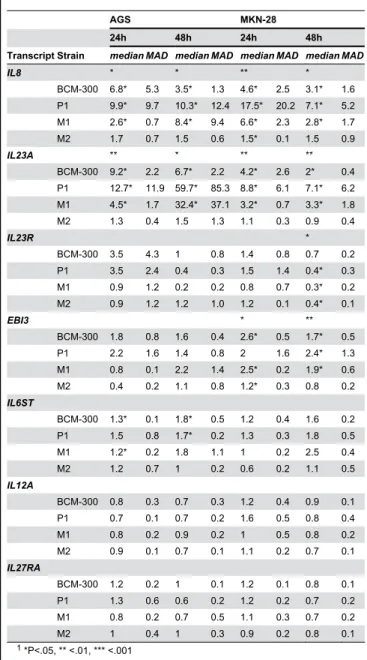
Table 2. Median and median absolute deviation (MAD) of fold change of IL-12-related transcripts by RT-qPCR in AGS and MKN-28 cells after infection with different H. pylori strains (n=4).
AGS MKN-28
24h 48h 24h 48h
Transcript Strain median MAD median MAD median MAD median MAD
IL8 * * ** *
BCM-300 6.8* 5.3 3.5* 1.3 4.6* 2.5 3.1* 1.6 P1 9.9* 9.7 10.3* 12.4 17.5* 20.2 7.1* 5.2 M1 2.6* 0.7 8.4* 9.4 6.6* 2.3 2.8* 1.7 M2 1.7 0.7 1.5 0.6 1.5* 0.1 1.5 0.9
IL23A ** * ** **
BCM-300 9.2* 2.2 6.7* 2.2 4.2* 2.6 2* 0.4 P1 12.7* 11.9 59.7* 85.3 8.8* 6.1 7.1* 6.2 M1 4.5* 1.7 32.4* 37.1 3.2* 0.7 3.3* 1.8 M2 1.3 0.4 1.5 1.3 1.1 0.3 0.9 0.4
IL23R *
BCM-300 3.5 4.3 1 0.8 1.4 0.8 0.7 0.2 P1 3.5 2.4 0.4 0.3 1.5 1.4 0.4* 0.3 M1 0.9 1.2 0.2 0.2 0.8 0.7 0.3* 0.2 M2 0.9 1.2 1.2 1.0 1.2 0.1 0.4* 0.1
EBI3 * **
BCM-300 1.8 0.8 1.6 0.4 2.6* 0.5 1.7* 0.5 P1 2.2 1.6 1.4 0.8 2 1.6 2.4* 1.3 M1 0.8 0.1 2.2 1.4 2.5* 0.2 1.9* 0.6 M2 0.4 0.2 1.1 0.8 1.2* 0.3 0.8 0.2
IL6ST
BCM-300 1.3* 0.1 1.8* 0.5 1.2 0.4 1.6 0.2 P1 1.5 0.8 1.7* 0.2 1.3 0.3 1.8 0.5 M1 1.2* 0.2 1.8 1.1 1 0.2 2.5 0.4 M2 1.2 0.7 1 0.2 0.6 0.2 1.1 0.5
IL12A
BCM-300 0.8 0.3 0.7 0.3 1.2 0.4 0.9 0.1 P1 0.7 0.1 0.7 0.2 1.6 0.5 0.8 0.4 M1 0.8 0.2 0.9 0.2 1 0.5 0.8 0.2 M2 0.9 0.1 0.7 0.1 1.1 0.2 0.7 0.1
IL27RA
BCM-300 1.2 0.2 1 0.1 1.2 0.1 0.8 0.1 P1 1.3 0.6 0.6 0.2 1.2 0.2 0.7 0.2 M1 0.8 0.2 0.7 0.5 1.1 0.3 0.7 0.2
M2 1 0.4 1 0.3 0.9 0.2 0.8 0.1
1 *P<.05, ** <.01, *** <.001
2 Asterisks of significance levels in the row of the transcript name correspond to
the global Kruskal-Wallis test among different strains for that particular transcript, whereas asterisks in the row of the strain name correspond to Benjamini-Hochberg (BH) adjusted P values of pair-wise contrasts with Mann-Whitney U test
3 BCM-300, P1, M1, and M2 are H. pylori strains. Both BCM-300 and P1
(wild-type) are CagA strains, whereas M1 and M2 are P1-derived isogenic mutants lacking CagA and VirB7, respectively.
doi: 10.1371/journal.pone.0075192.t002
Immunostaining of IL-12, p19, and Ebi3 in Human Gastric Mucosa
To examine protein expression of IL-12, p19, and Ebi3 in gastric biopsies of gastritis cases we used IHC (Figure 5). IL-12 was detected in gastric epithelial cells and immune cells in antrum and corpus mucosae of all specimens, irrespective of
H. pylori status (Figure 5B, F, J, and N). Immunostaining of p19 was detected in both gastric epithelial cells and immune cells of all specimens. However, in the antrum, more staining intensity was observed in the superficial foveolar epithelium and in the glandular neck zone of the mucosa (Figure 5C and k), whereas in the corpus, both foveolar and glandular compartments were stained almost alike (Figure 5G and O). In contrast to IL-12 and Ebi3, increased immunostaining of p19 was observed in H. pylori gastritis (Figure 5K and O) compared to that of H. pylori
negative mucosae of antrum and corpus (Figure 5C and G). In addition, higher amounts of p19-positive immune cells were detected in H. pylori gastritis. To better resolve protein localization of p19 in gastric mucosa we performed IF staining. Two distinct staining patterns could be identified: a membranous localization, which was more clearly seen in the superficial foveolar cells (Figure 6J), and a cytoplasmic localization, which was more obviously seen in the glands of the gastric corpus mucosa (Figure 6D). Interestingly, Ebi3 immunostaining was detected in the glandular neck part of the antrum (Figure 5D and L), but not in the corpus (Figure 5H and P). However, the staining pattern was almost the same between H. pylori positive (Figure 5L) and H. pylori negative gastritis cases (Figure 5D).
Discussion
In this study we report a differentially regulated epithelial-derived expression of IL23A, EBI3, and their receptors: IL23R
versus a literature review of the currently known cell types to express these transcripts in human. In our study, the differentially regulated epithelial-derived expression of IL23A
and EBI3 with their receptors upon infection with different strains of H. pylori suggests a possible biological role for these molecules either alone or in combination with other molecules. In support of the latter hypothesis, it has been shown that an individual chain of IL-12 family could deliver a biological function like p28 (IL-30) [22], or a functional homodimer could be obtained by self-pairing like p40 (IL-12p80) [23], another added layer of complexity is the ability to bind other relatives of IL-6 superfamily of cytokines like p28 with cytokine like factor CLF [24]. A similar complexity has also been described for receptors of these chains making the exact biological function of these molecules enigmatic. Furthermore, the possibility of other combinations like (p19/Ebi3) and (p28/p40) cannot be excluded and can be physiologically relevant in favor of the previously described propensity of chain sharing. Interestingly, our analysis revealed a significant positive correlation between
IL23A and EBI3 after infection with P1 strain only (Figure 4B). It remains unclear whether this correlation implies an upregulated p19/Ebi3 heterodimer (IL-35) that might be elicited by certain virulence factor(s) exclusively expressed in P1 strain. In
accordance with previous reports, our results showed a consistent induction of IL8 by H. pylori infected gastric epithelial cells. Remarkably, both IL8 and IL23A shared a pronounced and similar pattern of expression, in which the strongest alterations were seen with P1, whereas M2 infection or application of the filter cap after infection were associated with minimal alterations almost similar to that of controls (no H. pylori). This pattern was not evident for other regulated genes investigated in our study (IL23R, EBI3, and IL6ST). This further supports the importance of T4SS to mediate cellular alterations through translocation of CagA protein and other molecules into epithelial cells. It can be deduced that about half of the IL23A
upregulation was attributed to CagA protein alone by comparing expression folds between wild-type (P1) and its CagA mutant (M1) (Table 2). However, small alterations in expression of both IL8 and IL23A could still be seen with M2 infection or after application of the filter cap (in case of BCM-300 strain). From the latter observation, it can be inferred that T4SS and direct epithelial contact were not indispensable and secretory factors by H. pylori, independent of the secretion apparatus, might be the culprits for these small persistent alterations.
Table 3. Median and median absolute deviation (MAD) of fold change of normalized relative quantities (NRQs) of IL-12-related transcripts by RT-qPCR in AGS and MKN-28 cells after infection with H. pylori BCM-300 strain (n=4).
AGS MKN-28
24h 48h 24h 48h
Transcript Sample median MAD median MAD median MAD median MAD
IL8 ** ** * *
HP+Fi 1.8* 0.1 3.7* 1.0 1.2 0.1 3.8* 1.9
HP 24.2* 5.1 20.4* 4.6 22.1* 2.9 12.8* 5.8
IL23A ** * *
HP+Fi 1.6* 0.2 1.6 1.0 1.3 0.2 1.6 0.8
HP 15.1* 2.9 3.9* 1.6 7.6* 3.2 5.8 2.3
IL23R
HP+Fi 0.6 0.3 0.5 0.2 1.4 0.3 0.1 0.1
HP 1 0.4 0.6 0.5 1.3 0.9 0.5 0.5
EBI3 ** * *
HP+Fi 0.3 0.3 1.9 1.3 0.4* 0.3 1 0.4
HP 4.6* 3.2 15.3* 1.8 2.8 2.1 1.7* 0.7
IL6ST ** * * *
HP+Fi 1.3* 0.2 2.4* 0.6 0.8 0.1 1.9* 0.7
HP 3.3* 1.2 3.7* 1.8 2* 0.6 2.8* 1.6
IL12A
HP+Fi 0.8 0.1 0.7* 0.3 1 0.2 0.4* 0.2
HP 0.5 0.2 1 0.7 0.5 0.1 0.5 0.2
IL27RA
HP+Fi 0.8 0.2 0.6 0.2 0.8* 0.1 0.8* 0.1
HP 0.9 0.2 0.3* 0.2 1 0.5 0.5 0.2
1 *P<.05, ** <.01, *** <.001
2 Asterisks of significance levels in the row of the transcript name correspond to the global Kruskal-Wallis test among samples for that particular transcript, whereas
asterisks in the row of the sample correspond to Benjamini-Hochberg (BH) adjusted P values of pair-wise contrasts with Mann-Whitney U test
3 “HP+Fi”; H. pylori BCM-300 strain with a 0.22µm filter cap, “HP”; the same strain without a filter cap
Another important observation was the detection of both
IL23A and IL12A in gastric epithelial cells without the co-expression of IL12B (encodes p40), which is necessary to form functional IL-23 (p19/p40) and IL-12 (p35/p40), respectively. In a striking analogy to our findings, a study by Maaser et al. showed epithelial-derived expression and regulation of IL23A,
EBI3, IL12A, but not IL27A, nor IL12B in human colon adenocarcinoma cell lines co-infected with Salmonella [25]. These analogous findings between gastric and colonic cell lines may denote a common, yet poorly understood innate epithelial defense mechanism against pathogens. In a different model, Schmidt et al. demonstrated an upregulation of IL27A in active Crohn’s disease (CD), but not in ulcerative colitis (UC). Likewise, upregulation of both EBI3 and IL27A was only specific to CD. However, all transcripts of monomeric chains were detected in colonic mucosa except IL12B [26]. Although the latter two studies didn’t investigate transcript levels of receptors, we can generally hypothesize that IL-12-related transcripts may demonstrate a distinct expression profile that is specific to type of tissue and related pathologies.
As a proof-of-principle experiment, we performed IHC analysis for a subset of IL-12 family in gastric biopsies of gastritis cases with and without H. pylori infection. IL-12, p19,
Table 4. Spearman’s rho correlation table between IL23A transcript and other detected transcripts of both IL8 and IL-12-related genes after infection with different H. pylori strains regardless of cell type or duration of infection.
Strain IL8 EBI3 IL23R IL6ST IL27RA n
IL23A BCM-300+Fi .44+ -.14 -.33 .44+ -.24 16
BCM-300 .63*** .06 -.15 .42* .15 32
P1 .87*** .61* .21 .58* .14 16
M1 .34 .25 -.07 .12 -.22 16
M2 .54* .23 .32 -.1 -.29 16
1 +P<.1, *P<.05, ** <.01, *** <.001
2 “BCM-300+Fi”; H. pylori BCM-300 strain with a 0.22µm filter cap
doi: 10.1371/journal.pone.0075192.t004
Figure 4. Correlation of IL23A with IL8 and EBI3 after infection with different H. pylori strains. Scatterplots of log-transformed fold changes of transcripts by RT-qPCR illustrate the relationship of IL23A with both IL8 (panel A) and EBI3 (panel B) transcripts after infection with different H. pylori strains using pair-wise Spearmen’s rho correlations. Robust regression line using an M estimator was plotted as well (red line). BCM-300, P1, M1, and M2 are H. pylori strains. Both BCM-300 and P1 (wild-type) are CagA strains, whereas M1 and M2 are P1-derived isogenic mutants lacking CagA and VirB7, respectively. BCM-300+Fi is infection with H. pylori BCM-300 bacteria after application of 0.22µm filter cap to prevent any physical contact with the cells, while permitting their secretory factors to pass through. Asterisks represent the significance levels (*P<.05, **<.01, ***<.001).
Figure 5. Immunohistochemical analysis of IL-12, p19, and Ebi3 in human gastric mucosa. Microscopic images from a typical case of H. pylori negative gastritis are shown in A-D (antrum) and E-H (corpus). The antrum mucosa (A) contains few immune cells (hematoxylin-eosin). Both immune and epithelial cells were stained with IL-12 in the antrum mucosa (B). Immunostaining of p19 was detected in both immune and epithelial cells with a tendency to be more localized in the superficial epithelial cells and glandular neck zone of the antrum mucosa (C; arrowheads). Immunostaining of Ebi3 was exclusively found in the glandular neck zone of the antrum mucosa (D). The corpus mucosa (E) contains also few immune cells and is rich in parietal cells (hematoxylin-eosin). Both immune and epithelial cells of the corpus mucosa were stained with IL-12 (F). Immune cells, foveolar epithelium, and corpus glands with parietal cells were all immunostained with p19 (G). No Ebi3 staining was detected in the corpus mucosa (H). Microscopic findings in H. pylori gastritis are shown in I-L (antrum) and M-P (corpus). The antrum mucosa in H. pylori
gastritis (I) contains higher amounts of immune cells (hematoxylin-eosin). No clear difference in IL-12 immunostaining was detected in epithelial cells (J) as compared to that of uninfected antrum mucosa (B). In contrast, a stronger immunostaining of p19 was observed in the foveolar epithelium and in immune cells including a lymph follicle (K). Ebi3 staining was only detected in the glandular neck zone of the antrum mucosa (L), similar to H. pylori negative mucosa (D). The corpus mucosa (M) contains increased immune cells (hematoxylin-eosin). No clear difference in IL-12 immunostaining was detected in epithelial cells (N) as compared to that of uninfected corpus mucosa (F). In contrast, a stronger immunostaining of p19 was observed in the foveolar epithelium, corpus glands with parietal cells, and immune cells (O). No Ebi3 staining was detected in the corpus mucosa (P). Scale bar=50µm.
and Ebi3 were stained by IHC, whereas p19 was additionally stained by IF to study its localization. Nevertheless, investigating the remaining chains, cytokines, and corresponding chain receptors in context of H. pylori infection is strongly recommended for future research. As summarized in Table 6, immunostaining of the gastric mucosa confirmed our gene expression findings in gastric epithelial cell lines.
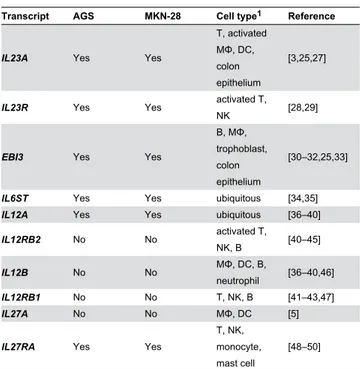
Table 5. Gene expression of IL-12-related transcripts in AGS and MKN-28 gastric epithelial cells versus the currently known cell types to express these transcripts in human from literature.
Transcript AGS MKN-28 Cell type1 Reference
IL23A Yes Yes
T, activated MΦ, DC, colon epithelium
[3,25,27]
IL23R Yes Yes activated T,
NK [28,29]
EBI3 Yes Yes
B, MΦ, trophoblast, colon epithelium
[30–32,25,33]
IL6ST Yes Yes ubiquitous [34,35]
IL12A Yes Yes ubiquitous [36–40]
IL12RB2 No No activated T,
NK, B [40–45]
IL12B No No MΦ, DC, B,
neutrophil [36–40,46]
IL12RB1 No No T, NK, B [41–43,47]
IL27A No No MΦ, DC [5]
IL27RA Yes Yes
T, NK, monocyte, mast cell
[48–50]
1 B; B lymphocyte, DC; dendritic cell, MΦ; macrophage, NK; natural killer cell, T;
T lymphocyte
doi: 10.1371/journal.pone.0075192.t005
Table 6. Summary of the five IL-12 family chains and their expression in AGS, MKN-23 gastric epithelial cells and in human gastric mucosa as detected by RT-qPCR and immunohistochemistry, respectively. Transcript RT-qPCR in AGS and MKN-28 Chain Immunohistochemistry in gastric mucosa
Epithelial cells Epithelial cells Immune cells
IL23A Yes p19 Yes Yes
EBI3 Yes Ebi3 Yes No
IL12A Yes p35 Yes Yes
IL12B No p40 ? ?
IL27A No p28 -
-doi: 10.1371/journal.pone.0075192.t006
IL-12 was found to be diffusely stained in gastric epithelial cells irrespective of H. pylori status (Figure 5B, F, J, and N). Since the used anti-IL-12 antibody gives signal by binding to the heterodimeric structure of IL-12 (IL-12p70) as well as to either of the monomeric chains (IL-12p35 or IL-12p40); therefore, the three interpretations of the result are possible. Nevertheless, immunostaining due to p35 chain alone is the mostly likely one, since its corresponding transcript, and not that of p40, was detected in our gene expression study. Immunostaining of p28 was discouraged as its transcript could not be detected by RT-qPCR. It is important to point out that the possibility of epithelial-derived expression of p40 is critical, and would imply the ability of epithelial cells to produce IL-12p70 and IL-23 cytokines upon pairing with p35 and p19, respectively. Consequently, these epithelial-derived cytokines could potentially drive T cell differentiation into Th1 or Th17 type of immune response. What opposes this possibility was the undetected gene expression of p40 transcript (IL12B) in gastric epithelial cell lines.
For Ebi3, which is a β chain known to be shared by two mainly anti-inflammatory cytokines: IL-27 (p28/Ebi3) and IL-35 (p35/Ebi3), it is interesting to see this molecule being only stained in the antrum; the primary habitat for H. pylori in the stomach. Moreover, the immunoreactivity of Ebi3 was clustered in the glandular neck zone of the antrum mucosa (Figure 5D and L); the same zone area where higher p19 immunoreactivity was detected (Figures 5C and 6A). Our gene expression analysis revealed induction of EBI3 by H. pylori co-infected gastric cell lines, and correlation with IL23A expression after P1 strain infection (Figure 4B). Putting all findings together, one might speculate a functional interaction between these two α and β chains, at least in the antrum. The detected p35 immunoreactivity in the same area of the antrum would add another possibility of IL-35 (p35/Ebi3) release by the mucosa. Nevertheless, the function of Ebi3, whether in a monomeric or a heterodimeric structure, is an intriguing one and needs to be explored in further research.
Considering the effect of H. pylori infection on the immunoreactivity of IL-12 and Ebi3 in gastritis, our qualitative assessment of the selected cases revealed similar staining patterns regardless of H. pylori infection. However, to better examine this effect, more cases need to be evaluated and semi-quantitatively scored in order to reach a sound statistical power.
In support of our gene expression analysis, an increased immunoreactivity of p19 was observed in H. pylori gastritis (Figure 5K and O) compared to that of H. pylori negative gastritis (Figure 5C and G), suggesting upregulation of p19 by
foveolar epithelium (Figure 6J), which is the main site of host-bacterial interaction. Added to that, p19 protein is bioinformatically predicted to undergo mucin-type O -glycosylation, but not N-glycosylation. Therefore, it is tempting to speculate that modified p19 protein may contribute to the gastric epithelial glycocalyx. Glycan profiling of this molecule would possibly provide more in-depth knowledge about its function in context of H. pylori infection.
In a nutshell, the most obvious finding to emerge from this study is the contribution of gastric epithelial cells to molecules that belong to the IL-12 family of cytokines, which is against the dogma that these molecules are primarily produced by immune cells. Since epithelial cells are the predominant cell type in gastric mucosa, hence, these findings provide support for a conceptual premise that epithelial cells could have a major impact on the type of immune response at any given point via epithelial-derived immune mediators whose exact function remains elusive. Furthermore, our gene expression and IHC/IF studies were in agreement to identify the importance of p19 as
the most relevant molecule in IL-12 family to H. pylori infection in terms of expression and localization.
Acknowledgements
The first author would like to thank the Lord for His gracious help and provision. We thank Ursula Stolz and Simone Philipsen (Department of Gastroenterology, Hepatology and Infectious Diseases); Claudia Miethke, Carola Kügler, and Katrin Frauenschläger (Department of Pathology), for their contribution to this study.
Author Contributions
Conceived and designed the experiments: FA TW. Performed the experiments: FA. Analyzed the data: FA TK. Contributed reagents/materials/analysis tools: PM TW AL TK SW. Wrote the manuscript: FA TW.
References
1. Vignali DAA, Kuchroo VK (2012) IL-12 family cytokines: immunological playmakers. Nat Immunol 13: 722–728. doi:10.1038/ni.2366. PubMed: 22814351.
2. Korn T, Bettelli E, Oukka M, Kuchroo VK (2009) IL-17 and Th17 Cells. Annu Rev Immunol 27: 485–517. doi:10.1146/annurev.immunol. 021908.132710. PubMed: 19132915.
3. Oppmann B, Lesley R, Blom B, Timans JC, Xu Y et al. (2000) Novel p19 protein engages IL-12p40 to form a cytokine, IL-23, with biological activities similar as well as distinct from IL-12. Immunity 13: 715–725. doi:10.1016/S1074-7613(00)00070-4. PubMed: 11114383.
4. Barnes MJ, Powrie F (2009) Regulatory T cells reinforce intestinal homeostasis. Immunity 31: 401–411. doi:10.1016/j.immuni. 2009.08.011. PubMed: 19766083.
5. Pflanz S, Timans JC, Cheung J, Rosales R, Kanzler H et al. (2002) IL-27, a heterodimeric cytokine composed of Ebi3 and p28 protein, induces proliferation of naive CD4+ T cells. Immunity 16: 779–790. doi: 10.1016/S1074-7613(02)00324-2. PubMed: 12121660.
6. Wojno EDT, Hunter CA (2012) New directions in the basic and translational biology of interleukin-27. Trends Immunol 33: 91–97. doi: 10.1016/j.it.2011.11.003. PubMed: 22177689.
7. Collison LW, Workman CJ, Kuo TT, Boyd K, Wang Y et al. (2007) The inhibitory cytokine IL-35 contributes to regulatory T-cell function. Nature 450: 566–569. doi:10.1038/nature06306. PubMed: 18033300. 8. Collison LW, Vignali DAA (2008) Interleukin-35: odd one out or part of
the family? Immunol Rev 226: 248–262. doi:10.1111/j.1600-065X. 2008.00704.x. PubMed: 19161429.
9. Vignali DAA, Collison LW, Workman CJ (2008) How regulatory T cells work. Nat Rev Immunol 8: 523–532. doi:10.1038/nri2343. PubMed: 18566595.
10. Censini S, Lange C, Xiang Z, Crabtree JE, Ghiara P et al. (1996) cag, a pathogenicity island of Helicobacter pylori, encodes type I-specific and disease-associated virulence factors. Proc Natl Acad Sci U S A 93: 14648–14653. doi:10.1073/pnas.93.25.14648. PubMed: 8962108. 11. Voth DE, Broederdorf LJ, Graham JG (2012) Bacterial type IV secretion
systems: versatile virulence machines. Future Microbiol 7: 241–257. doi:10.2217/fmb.11.150. PubMed: 22324993.
12. Covacci A, Rappuoli R (2000) Tyrosine-phosphorylated bacterial proteins. J Exp Med 191: 587–592. doi:10.1084/jem.191.4.587. PubMed: 10684850.
13. Stein M, Rappuoli R, Covacci A (2000) Tyrosine phosphorylation of the Helicobacter pylori CagA antigen after cag-driven host cell translocation. Proc Natl Acad Sci U S A 97: 1263–1268. doi:10.1073/ pnas.97.3.1263. PubMed: 10655519.
14. Backert S, Ziska E, Brinkmann V, Zimny-Arndt U, Fauconnier A et al. (2000) Translocation of the Helicobacter pylori CagA protein in gastric epithelial cells by a type IV secretion apparatus. Cell Microbiol 2: 155– 164. doi:10.1046/j.1462-5822.2000.00043.x. PubMed: 11207572. 15. Malfertheiner P, Selgrad M, Wex T, Bornschein J, Emanuela P et al.
(2012) Efficacy of an investigational recombinant antigen based
vaccine against a CagA H. pylori infectious challenge in healthy volunteers (abstract). Gastroenterology 142 Suppl 1: S–184.
16. Crabtree JE, Farmery SM, Lindley IJ, Figura N, Peichl P et al. (1994) CagA/cytotoxic strains of Helicobacter pylori and interleukin-8 in gastric epithelial cell lines. J Clin Pathol 47: 945–950. doi:10.1136/jcp. 47.10.945. PubMed: 7962609.
17. Rho H-W, Lee B-C, Choi E-S, Choi I-J, Lee Y-S et al. (2010) Identification of valid reference genes for gene expression studies of human stomach cancer by reverse transcription-qPCR. BMC Cancer 10: 240. doi:10.1186/1471-2407-10-240. PubMed: 20507635. 18. Vandesompele J, De Preter K, Pattyn F, Poppe B, Van Roy N et al.
(2002) Accurate normalization of real-time quantitative RT-PCR data by geometric averaging of multiple internal control genes. Genome Biol 3: 1–12. PubMed: 12184808.
19. Kohl Matthias (2007) SLqPCR: Functions for analysis of real-time quantitative PCR data at SIRS-Lab GmbH. R package, SIRS-Lab GmbH. Jena
20. Core R Team (2012) R: A Language and Environment for Statistical Computing. Vienna, Austria: R Foundation for Statistical Computing. 21. Wickham H (2009) ggplot2: Elegant Graphics for Data. Analysis. 2nd
Printing. Springer Verlag. 221 p
22. Stumhofer JS, Tait ED iii; Quinn WJ, Hosken N, Spudy B et al. (2010) A role for IL-27p28 as an antagonist of gp130-mediated signaling. Nat Immunol 11: 1119–1126. doi:10.1038/ni.1957. PubMed: 21057510. doi: 10.1038/ni.1957 PubMed: 21057510
23. Mattner F, Fischer S, Guckes S, Jin S, Kaulen H et al. (1993) The interleukin-12 subunit p40 specifically inhibits effects of the interleukin-12 heterodimer. Eur J Immunol 23: 2202–2208. doi:10.1002/ eji.1830230923. PubMed: 8103745.
24. Crabé S, Guay-Giroux A, Tormo AJ, Duluc D, Lissilaa R et al. (2009) The IL-27 p28 subunit binds cytokine-like factor 1 to form a cytokine regulating NK and T Cell activities requiring IL-6R for signaling. J Immunol 183: 7692–7702. doi:10.4049/jimmunol.0901464. PubMed: 19933857.
25. Maaser C, Egan LJ, Birkenbach MP, Eckmann L, Kagnoff MF (2004) Expression of Epstein–Barr virus-induced gene 3 and other interleukin-12-related molecules by human intestinal epithelium. Immunology 112: 437–445. doi:10.1111/j.1365-2567.2004.01895.x. PubMed: 15196212.
26. Schmidt C, Giese T, Ludwig B, Mueller-Molaian I, Marth T et al. (2005) Expression of interleukin-12-related cytokine transcripts in inflammatory bowel disease: elevated interleukin-23p19 and interleukin-27p28 in Crohn’s disease but not in ulcerative colitis. Inflamm Bowel Dis 11: 16– 23. doi:10.1097/00054725-200501000-00003. PubMed: 15674109. 27. McKenzie BS, Kastelein RA, Cua DJ (2006) Understanding the
IL-23-IL-17 immune pathway. Trends Immunol 27: 17–23. doi:10.1016/j.it. 2005.10.003. PubMed: 16290228.
and a novel cytokine receptor subunit, IL-23R. J Immunol 168: 5699– 5708. PubMed: 12023369.
29. Maul J, Zeitz M (2012) Ulcerative colitis: immune function, tissue fibrosis and current therapeutic considerations. Langenbecks Arch Surg 397: 1–10. doi:10.1007/s00423-011-0789-4. PubMed: 21479621. 30. Devergne O, Hummel M, Koeppen H, Le Beau, Nathanson EC et al.
(1996) A novel interleukin-12 p40-related protein induced by latent Epstein-Barr virus infection in B lymphocytes. J Virol 70: 1143–1153. PubMed: 8551575.
31. Eckmann L, Smith JR, Housley MP, Dwinell MB, Kagnoff MF (2000) Analysis by high density cDNA arrays of altered gene expression in human intestinal epithelial cells in response to infection with the invasive enteric bacteria Salmonella. J Biol Chem 275: 14084–14094. doi:10.1074/jbc.275.19.14084. PubMed: 10799483.
32. Devergne O, Coulomb-L’Herminé A, Capel F, Moussa M, Capron F (2001) Expression of Epstein-Barr virus-induced gene 3, an interleukin-12 p40-related molecule, throughout human pregnancy: involvement of syncytiotrophoblasts and extravillous trophoblasts. Am J Pathol 159: 1763–1776. doi:10.1016/S0002-9440(10)63023-4. PubMed: 11696437.
33. Li X, Mai J, Virtue A, Yin Y, Gong R et al. (2012) IL-35 is a novel responsive anti-inflammatory cytokine — a new system of categorizing anti-inflammatory cytokines. PLOS ONE 7: 1–13.
34. Taga T, Hibi M, Hirata Y, Yamasaki K, Yasukawa K et al. (1989) Interleukin-6 triggers the association of its receptor with a possible signal transducer, gp130. Cell 58: 573–581. doi: 10.1016/0092-8674(89)90438-8. PubMed: 2788034.
35. Müller-Newen G (2003) The cytokine receptor gp130: faithfully promiscuous. Sci Signal, 2003: 2003: 1–3 PubMed: 14506288. 36. Stern AS, Podlaski FJ, Hulmes JD, Pan YC, Quinn PM et al. (1990)
Purification to homogeneity and partial characterization of cytotoxic lymphocyte maturation factor from human B-lymphoblastoid cells. Proc Natl Acad Sci U S A 87: 6808–6812. doi:10.1073/pnas.87.17.6808. PubMed: 2204066.
37. Wolf SF, Temple PA, Kobayashi M, Young D, Dicig M et al. (1991) Cloning of cDNA for natural killer cell stimulatory factor, a heterodimeric cytokine with multiple biologic effects on T and natural killer cells. J Immunol 146: 3074–3081. PubMed: 1673147.
38. Bliss SK, Butcher BA, Denkers EY (2000) Rapid recruitment of neutrophils containing prestored IL-12 during microbial infection. J Immunol 165: 4515–4521. PubMed: 11035091.
39. Liu J, Cao S, Kim S, Chung EY, Homma Y et al. (2005) Interleukin-12: an update on its immunological activities, signaling and regulation of
gene expression. Curr. Immunol Rev 1: 119–137. doi: 10.2174/1573395054065115.
40. Airoldi I, Guglielmino R, Carra G, Corcione A, Gerosa F et al. (2002) The interleukin-12 and interleukin-12 receptor system in normal and transformed human B lymphocytes. Haematologica 87: 434–442. PubMed: 11940489.
41. Chizzonite R, Truitt T, Desai BB, Nunes P, Podlaski FJ et al. (1992) IL-12 receptor. I. Characterization of the receptor on phytohemagglutinin-activated human lymphoblasts. J Immunol 148: 3117–3124..
42. Desai BB, Quinn PM, Wolitzky AG, Mongini PK, Chizzonite R et al. (1992) IL-12 receptor. II. Distribution and regulation of receptor expression. J Immunol 148: 3125–3132..
43. Presky DH, Yang H, Minetti LJ, Chua AO, Nabavi N et al. (1996) A functional interleukin 12 receptor complex is composed of two β-type cytokine receptor subunits. Proc Natl Acad Sci U S A 93: 14002– 14007. doi:10.1073/pnas.93.24.14002. PubMed: 8943050.
44. Rogge L, Barberis-Maino L, Biffi M, Passini N, Presky DH et al. (1997) Selective expression of an interleukin-12 receptor component by human T helper 1 cells. J Exp Med 185: 825–832. doi:10.1084/jem. 185.5.825. PubMed: 9120388.
45. Szabo SJ, Dighe AS, Gubler U, Murphy KM (1997) Regulation of the interleukin (IL)-12R β2 subunit expression in developing T helper 1 (Th1) and Th2 cells. J Exp Med 185: 817–824. doi:10.1084/jem. 185.5.817. PubMed: 9120387.
46. Ma X, Chow JM, Gri G, Carra G, Gerosa F et al. (1996) The interleukin 12 p40 gene promoter is primed by interferon gamma in monocytic cells. J Exp Med 183: 147–157. doi:10.1084/jem.183.1.147. PubMed: 8551218.
47. Wu C, Warrier RR, Wang X, Presky DH, Gately MK (1997) Regulation of interleukin-12 receptor beta1 chain expression and interleukin-12 binding by human peripheral blood mononuclear cells. Eur J Immunol 27: 147–154. doi:10.1002/eji.1830270122. PubMed: 9022011. 48. Sprecher CA, Grant FJ, Baumgartner JW, Presnell SR, Schrader SK et
al. (1998) Cloning and characterization of a novel class I cytokine receptor. Biochem Biophys Res Commun 246: 82–90. doi:10.1006/ bbrc.1998.8576. PubMed: 9600072.
49. Chen Q, Ghilardi N, Wang H, Baker T, Xie M-H et al. (2000) Development of Th1-type immune responses requires the type I cytokine receptor TCCR. Nature 407: 916–920. doi:10.1038/35038103. PubMed: 11057672.