www.nat-hazards-earth-syst-sci.net/14/1169/2014/ doi:10.5194/nhess-14-1169-2014
© Author(s) 2014. CC Attribution 3.0 License.
Modelling the NO emissions from wildfires at the source level
Y. Pérez-Ramirez1, P.-A. Santoni1, and N. Darabiha2
1UMR CNRS 6134 – SPE, University of Corsica, Corte, France
2Laboratoire EM2C, CNRS UPR 288, Ecole Centrale Paris, Chatenay Malabry, France
Correspondence to:Y. Pérez-Ramirez (perez-ramirez@univ-corse.fr)
Received: 30 September 2013 – Published in Nat. Hazards Earth Syst. Sci. Discuss.: 4 December 2013 Revised: 19 October 2013 – Accepted: 8 April 2014 – Published: 20 May 2014
Abstract. There is a growing interest to characterize fire plumes in order to control air quality during wildfire episodes and to estimate the carbon and ozone balance of fire emis-sions. A numerical approach has been used to study the mechanisms of NO formation at the source level in wild-fires given that NO plays an important role in the formation of ground-level ozone. The major reaction mechanisms in-volved in NO chemistry have been identified using reaction path analysis. Accordingly, a two-step global kinetic scheme in the gas phase has been proposed herein to account for the volatile fuel-bound nitrogen (fuel-N) conversion to NO, considering that the volatile fraction of fuel-N is released as NH3. Data from simulations using the perfectly stirred
reac-tor (PSR) code from CHEMKIN-II package with a detailed kinetic mechanism (GDF-Kin®3.0) have been used to cal-ibrate and evaluate the global model under typical wildfire conditions in terms of the composition of the degradation gases of vegetation, the equivalence ratio, the range of tem-peratures and the residence time.
1 Introduction
Wildfires are a major emission source of CO, CO2, NOx
(NO+NO2) volatile organic compounds (VOCs) and
par-ticulates to the atmosphere (Barboni et al., 2010), which in turn can form secondary pollutants with implications at lo-cal/regional scale (i.e. air quality, human health) or at global scale (i.e. climate dynamics). This is the case for NOx, which
are major contributors of photochemical smog and thus of ground-level ozone (Grewe et al., 2012).
In the context of the present climate change scenario, there is a growing interest to characterize fire plumes in order to control air quality during wildfire episodes and to estimate
the carbon and ozone balance of fire emissions (Miranda, 2004; Strada et al., 2012).
Atmospheric emissions from wildfires have generally been assessed using bottom-up estimates which require explicit knowledge on fire behaviour, area burned, fuel consumption, fuel characteristics and pollutant-specific emission factors at the source level. Despite the recent improvements, these methods entail errors and uncertainties in each step (Ottomar et al., 2009), particularly concerning the emission factors. In this regard, in the literature average values of emission fac-tors can be found for a given pollutant and vegetation struc-ture. Nevertheless, there are wide variations in the values psented for the same type of vegetation; this is especially re-markable in the case of certain pollutants such as NOx
(Me-bust et al., 2011). This variability underlines the generally limited understanding of the combustion processes of vege-tation (Sullivan and Ball, 2012).
Average emission factors for a certain type of vegetation structure are useful to generate overall emission factors; how-ever they do not reflect the spatial and temporal variability of wildfires. The wide range in observed emissions from a sin-gle fire reflects the variable and changing combustion condi-tions (Jaffe and Wigder, 2012). Thus, studies focused on un-derstanding instantaneous emissions from wildfires require more detailed information on the emissions of pollutants at the source level and thus on the combustion processes of veg-etation.
Definition of input parameters and numerical methodologies
(Section 2)
Reaction path analysis
(Section 3)
Formulation of the NO global model
(Section 4.1)
Fitting of the kinetic parameters of the NO global model
(Section 4.2)
NO global model testing
(Section 5)
Definition of the gaseous mixture (Degradation gases of vegetation)
(Section 2.1)
Definition of the mixture burning conditions (Perfectly Stirred Reactor, temperature,
residence time, etc)
(Section 2.2)
Definition of the numerical methodologies (Reactions paths analysis, sensitivity analysis,
fitting of the reaction rate parameters)
(Section 2.2)
Presentation of the detailed reaction mechanism of reference (GDF-Kin)
(Section 2.3)
Presentation of the global model of combustion to be coupled with the NO global
model
(Section 2.4)
NO global model derivation
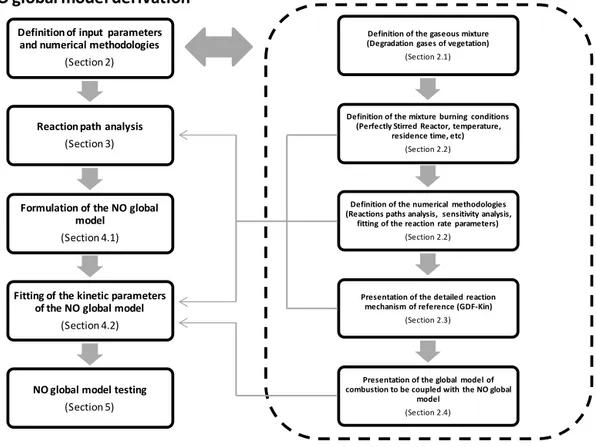
Figure 1.Flowchart of the workflow and the methodology steps.
However, the use of detailed kinetic mechanisms, which involve a large number of chemical species and reactions, results in an unfeasible solution to predict fire spread and its associated pollutant emissions at the landscape scale. The number of chemical species and reactions included in a ki-netic mechanism must be a balance of the competing needs of accuracy and simplicity to attain the computational time requirements. In this regard, global kinetic mechanisms at-tempt to simplify the detailed chemistry in order to predict important physical quantities, such as the concentration pro-file of the principal species or the rate of energy released.
The aim of this work is to improve the current knowledge on the combustion processes responsible for the emissions of pollutants of wildland fires at the source level by focusing on NO modelling. A two-step global oxidation scheme has been developed to account for the NO emissions in wildland fire conditions. The major reaction mechanisms involved in NO chemistry have been identified using reaction path analysis through reaction rate analysis and sensitivity analysis with a detailed kinetic mechanism (GDF-Kin®3.0). The kinetic parameters of the global model have been determined using numerical data obtained with GDF-Kin® 3.0 in a perfectly stirred reactor environment under typical wildfire conditions in terms of the inlet mixture composition, equivalence ratio and range of temperatures. Moreover, the model has been
tested in conditions other than the calibration conditions in terms of the residence time.
Section 2 is devoted to the procedures concerning the study of NO chemistry and the calibration of the global model. Next, Sect. 3 is focused on the reaction path analy-sis through rate-of-production and sensitivity analyses. Sec-tions 4 and 5 concern the derivation of the global model and the evaluation of the performances of the model in compar-ison with experimental data available in the literature and the numerical results obtained from a detailed kinetic mech-anism (GDF-Kin®3.0) for different residence times. Finally, conclusions are summarized in Sect. 6.
2 Materials and methods
The following subsections describe the procedures for the derivation of the global NO model and its calibration and testing, as summarized in Fig. 1.
2.1 Degradation gases of vegetation
assumed that the degradation gases of vegetation are com-posed only by the chemical species present in larger amounts, i.e. CO and CO2(Morvan and Dupuy, 2004). However, the
simplification of the composition of the degradation gas mix-ture can lead to a loss of accuracy of the model predictions (Tihay et al., 2009a) and also the estimation of pollutant emissions as NO.
Several mechanisms can lead to the formation of NO (Glarborg, 2007). These mechanisms imply either the fixa-tion of the molecular nitrogen contained in the combusfixa-tion air (i.e. thermal, prompt, N2O and NNH pathways) or the
oxidation of organic nitrogen chemically bound in the fuel (i.e. fuel-N pathway).
In the combustion of vegetation, the main path for NO for-mation is the fuel-N route (Salzmann and Nussbaumer, 2001; Rogaume et al., 2006; Glarborg, 2007). Vegetation contains small amounts of fuel-bound nitrogen; typical values range from 0.1 to 3.5 % weight (Glarborg, 2007). When vegeta-tion is exposed to a thermal source during the degradavegeta-tion, the parent fuel-N is partly released as volatile-N and partly transformed in char-N. The volatile fraction is essentially composed by HCN, NH3, HNCO and tars. Some authors
have reported that NH3is the main volatile-N species during
biomass pyrolysis and that the release of HCN from the fuel was always almost negligible (Weissinger et al., 2004; Zhou et al., 2006). Nevertheless, the extent of conversion of fuel-N to NO is nearly independent of the identity of the model com-pound (HCN, NH3, etc.), but it is strongly dependant on the
local combustion environment (temperature and stoichiome-try) and on the initial level of nitrogen compound in the fuel– air mixture (Sullivan et al., 2002).
The fuel-N mechanism is more complex than the other NO formation paths; even though the overall mechanism is fairly well established, details are still under investiga-tion especially for heterogeneous mixtures due to the sen-sitization effects between species, such as methane or carbon oxides to nitrogen oxides (Faravelli et al., 2003; Glarborg, 2007; Mendiara and Glarborg, 2009). This is the case for the gases released from the thermal degradation of vegetation, which form a mixture containing a great variety of chemical species. Indeed the complexity of the combustion processes involving the degradation gases of vegetation relies on their composition and the wide range of conditions occurring in a wildfire.
To our knowledge, there are no studies in the literature concerning the composition of the degradation gases of for-est fuels quantifying the volatile fraction of fuel-N. How-ever, Leroy et al. (2008) carried out a detailed study of the oxidation of a CH4/ CO / CO2gas mixture representative of
the thermal degradation of Pinus pinaster needles, which is a natural species frequently used in wildfires experimen-tation since it is a widespread species characteristic of the forests in the Mediterranean Basin. This gaseous mixture was obtained using a tubular furnace allowing the pyrolysis of Pinus pinasterneedles under an inert atmosphere (Tihay
et al., 2009b). Experiments were conducted in the tempera-ture range 563–723 K, which corresponds to the maximum yields of gas released observed in thermogravimetric analy-sis (TGA) on thermal degradation of forest fuels.
So we considered the gaseous mixture proposed by Leroy et al. (2008) but doped with the corresponding volatile-N fraction released from the thermal degradation of the pine needles. For this, we assumed that volatile-N was only com-posed by NH3because, although the nitrogen species (NH3,
HCN) initially follow different oxidation paths, the steps that determine the selectivity towards NO and N2are essentially
the same (Sullivan et al., 2002). Then, we considered that the volatile-N fraction corresponded to 80 % of the amount of fuel-bound nitrogen (Brink et al., 2001), which was obtained from an elementary analysis of a sample ofPinus pinaster
needles. The resulting mixture composition for the degra-dation gases ofPinus pinasterneedles was 0.23 % of NH3,
30.43 % of CO, 50.98 % of CO2, and 18.36 % of CH4(mole
fractions).
2.2 Numerical approach
Calculations were carried out using the perfectly stirred re-actor (PSR) code (Glarborg et al., 1986) from CHEMKIN-II package (Kee et al., 1989), which provides predictions of the steady-state temperature and species composition in a PSR. In a PSR the rate of conversion from reactants to products is kinetically controlled, and therefore combustion is only char-acterized by the residence time, the mixture composition and the temperature. Thus, the PSR configuration allows testing the global model at different temperatures and fuel equiva-lence ratios.
The global model formulation was derived from the full reaction mechanism through sensitivity analysis and rate-of-production analysis of PSR calculations covering the range of interest for the gaseous mixture previously detailed (Sect. 2.1). Only the reactions concerning species with a rate of production greater than 5 % and the reactions with sensi-bility greater than 5 % were considered.
Regarding the calibration of the reaction rate expressions, a regression analysis was performed whereby the global pa-rameters were adjusted by optimizing the match between the main species (i.e. NO and NH3)concentration profiles
(as a function of the temperature and fuel equivalence ra-tio) obtained by the global model and the reference detailed mechanism (GDF-Kin®3.0). For this, the NO global model was coupled to a five-step global kinetic mechanism (Pérez-Ramirez et al., 2012) in order to take into account the com-bustion of the CH4/ CO present in the degradation gases of
vegetation.
reactants were diluted in argon (dilution factor 9.2) to avoid temperature rise in the reactor.
The residence time was set at 1.3 s. This value was pro-posed by Jallais (2001) as an optimum value of time for con-trolling species to build up in a PSR of the same volume. In addition, this value is in accordance with the recommenda-tions of David and Matras (1975) to assure a homogeneous distribution of species in PSR devices.
In order to test the model in conditions other than the cal-ibration conditions, the model was evaluated for another res-idence time. In this case, the resres-idence time was set at 0.6 s. This value has been obtained from measurements performed at landscape scale in experimental fires across shrubland fu-els (Santoni et al., 2006), and it corresponds to the average transit time of the degradation gases through the flame, i.e. from the base to the tip of the flame (Santoni, 2008). It is worth noting that the residence time for PSR calculations is not equivalent to the residence time of the flame, which is defined as the average time that the flame stays in a certain position, and it is thus related to the rate of spread.
2.3 Reference detailed kinetic mechanism
To our knowledge, there are no experimental data in the literature concerning the NO formation in PSR devices for CH4/ CO / CO2/ NH3gas mixtures in the conditions of this
study. Indeed, experimental data available in the literature are very limited and concern gas mixtures of CH4(Bartok et
al., 1972; Duterque et al., 1981), CH4/ C2H6(Dagaut et al.,
1998) or other hydrocarbons such as C3H8, C6H6and C8H18
(Duterque et al., 1981) doped with different nitrogen com-pounds (e.g. NH3, NO, HCN, etc.). The experimental
condi-tions differ depending on the work, and only the experiments performed by Dagaut et al. (1998) are closer to the condi-tions encountered in the combustion of vegetation in terms of temperature and fuel equivalence ratio. In this regard, Da-gaut et al. (1998) carried out the experiments at temperatures ranging from 1100 to 1500 K and for fuel equivalence ratios in the range of 0.75–2.5. Dagaut et al. (1998) developed a detailed chemical kinetic model based on these experiments. Thus, due to the lack of experimental data, the kinetic pa-rameters of the reaction rate equations were fitted according to numerical results obtained with the detailed kinetic mecha-nism GDF-Kin®3.0 (El Bakali et al., 2006). This mechanism developed for the oxidation of natural gas takes into account the major and the minor alkanes present in the natural gas. Moreover, it incorporates the chemistry of nitrogen oxides from the mechanism developed by Dagaut et al. (1998).
Even though GDF-Kin®3.0 has not been specifically de-veloped for the gas-phase combustion processes of vegeta-tion, it has proven its performance for different test envi-ronments (e.g. shock tubes and jet-stirred reactors, premixed flames) and in various conditions of temperature, pressure and equivalence ratio (El Bakali et al., 2004, 2006).
2.4 Global kinetic mechanism for the combustion of CH4/ CO
The NO global model was implemented in conjunction with a five-step global mechanism (Pérez-Ramirez et al., 2012) to model the combustion of the CH4/ CO present in the
degra-dation gases of vegetation. This mechanism was developed for the conditions encountered in a wildfire scenario, and it was calibrated by using the experimental data obtained by Leroy et al. (2008) in a perfectly stirred reactor.
The first Reaction (R1) of this mechanism describes the breakdown of methane to an intermediate species, the methyl radical. The second and third reactions – Reactions (R2) and (R3) – describe the subsequent oxidation of the intermedi-ate species, the methyl radical and the formaldehyde, to car-bon monoxide. And the fourth and fifth steps (Reactions R4 and R5) correspond, respectively, to the oxidation of hydro-gen and carbon monoxide.
CH4⇒CH3+
1
2H2 (R1)
CH3+
1
2O2⇒CH2O+ 1
2H2 (R2)
CH2O+
1
2O2⇒CO+H2O (R3)
H2+
1
2O2⇔H2O (R4)
CO+1
2O2⇔CO2 (R5)
The reaction rate parameters of the CH4/ CO global model
are listed in Table 1.
3 Reaction analysis
3.1 Combustion of CH4/ CO / CO2mixture
The oxidation paths of CH4/ CO / CO2 mixture are similar
to the oxidation paths of methane as identified by Leroy et al. (2008). Two pathways for the oxidation of methane can be established (Fig. 2). The first one is direct oxidation to CH3, which subsequently oxidizes to CH3O and CH2O. The
second path is oxidation to CH3followed by the
recombina-tion of CH3molecules to the formation of C2hydrocarbons.
The selectivity to one or the other pathway is given by the fuel equivalence ratio. In fuel-rich conditions the formation of C2 hydrocarbons will be favoured, whereas in fuel-lean
conditions the direct oxidation will be preferential. Conse-quently, a different behaviour would also be expected for the oxidation of NH3 and thus the NO chemistry depending on
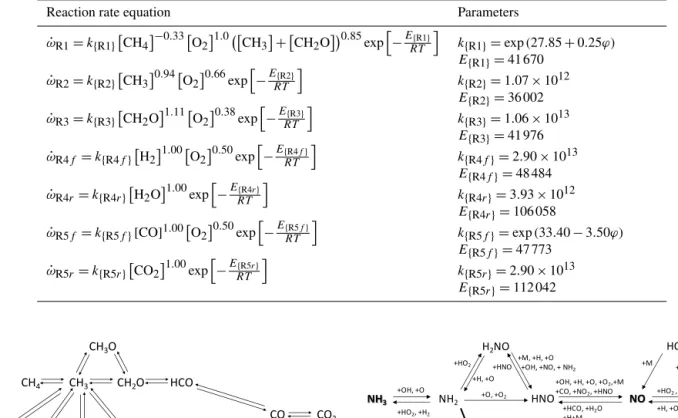
Table 1.Reaction rate equations and parameters of the global kinetic mechanism (ϕ: equivalence ratio; unitsω˙: mol cm−3s−1,E: cal mol−1,
k: consistent units) (Pérez-Ramirez et al., 2012).
Reaction rate equation Parameters
˙
ωR1=k{R1}CH4−0.33O21.0 CH3+CH2O0.85exp
h
−ERT{R1}i k{R1}=exp(27.85+0.25ϕ)
E{R1}=41 670
˙
ωR2=k{R2}
CH3
0.94
O2
0.66
exp
h
−ERT{R2}
i
k{R2}=1.07×10¹²
E{R2}=36 002
˙
ωR3=k{R3}
CH2O
1.11
O2
0.38
exp
h
−E{R3}
RT
i
k{R3}=1.06×10¹³
E{R3}=41 976
˙
ωR4f =k{R4f}
H21.00
O20.50
exph−E{R4f}
RT
i
k{R4f}=2.90×10¹³
E{R4f}=48 484
˙
ωR4r =k{R4r}
H2O1.00
exph−E{R4r}
RT
i
k{R4r}=3.93×10¹²
E{R4r}=106 058
˙
ωR5f =k{R5f}[CO]1.00
O20.50
exph−E{RTR5f}i k{R5f}=exp(33.40−3.50ϕ)
E{R5f}=47 773
˙
ωR5r =k{R5r}
CO21.00
exph−E{R5r}
RT
i
k{R5r}=2.90×10¹³
E{R5r}=112 042
CH4 CH3 CH2O
CH3O
HCO
CO CO2
C2H6 C2H5 C2H4 C2H3 C2H2 HCCO Figure 2.Reaction pathways for the combustion of methane.
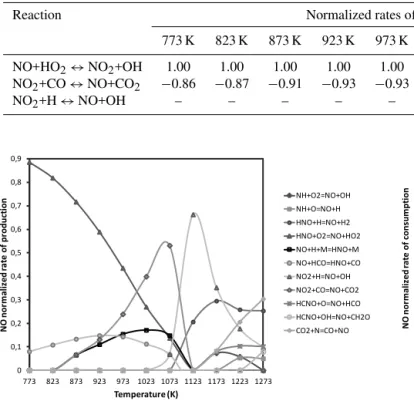
3.2 NO reaction path analysis 3.2.1 Fuel-lean conditions
Figure 3 presents the reaction path diagram of the principal reactions involved in the NO chemistry at fuel-lean condi-tions, which has been obtained from the results of both the rate-of-production analysis and the sensitivity analysis. As shown in Fig. 3, the oxidation of NH3 leads to two main
products: NO and N2. According to the data obtained from
the simulations with the detailed kinetic mechanisms, around 23 % of NH3 is converted to NO and 76 % is converted to
N2. The remaining amount, less than 1 %, comprises other
N-compounds such as NO2and N2O.
Concerning the reaction paths, NH3 is mainly converted
to NH2by hydrogen abstraction (Reaction R6). NH2is then
partly recycled back to NH3, essentially by reacting with the
hydroperoxyl radical (Reaction R7).
NH3+OH⇔NH2+H2O (R6)
NH2+HO2⇔NH3+O2 (R7)
NO2
NH3 NH2 HNO
H2NO
NO +OH, +O
+HO2, +H2 +H+M +HNCO +HNO +H2NO
N2
+H, +O, +CO, +M +OH, +H, +O, +O2,+M
+CO, +NO2, +HNO
+HCO, +H2O +H+M
+HO2 , +O+M +M, +H, +O
+OH, +NO, + NH2
+O, +O2 +HO2
+H, +O
+NO +HNO
HONO
+M +OH, +H
+HO2 +CH2O
+HNO
Figure 3.Reaction path diagram of the principal reactions involved in the NO chemistry at fuel-lean conditions.
The subsequent reactions of NH2largely determine the
for-mation of N2or NO. Formation of N2occurs mostly through
the reaction of NH2 with NO (Reaction R8). This pathway
accounts for 80 % of the total N2formation according to the
results of the rate-of-production analysis.
NH2+NO⇔N2+H2O (R8)
NO formation occurs essentially by the oxidation of nitroxyl (Reaction R9, Fig. 4) through the sequence NH3→NH2
(→H2NO)→ HNO→ NO (Fig. 3). Thus nitroxyl can be
formed directly by NH2or via H2NO species. The reaction
pathway involving H2NO has been identified as being
impor-tant only in the presence of high CO2concentrations
(Men-diara and Glarborg, 2009).
HNO+O2⇔NO+HO2 (R9)
Once NO is formed, some NO to NO2interconversion occurs
by the reaction of NO with the hydroperoxyl radical (Reac-tion R10).
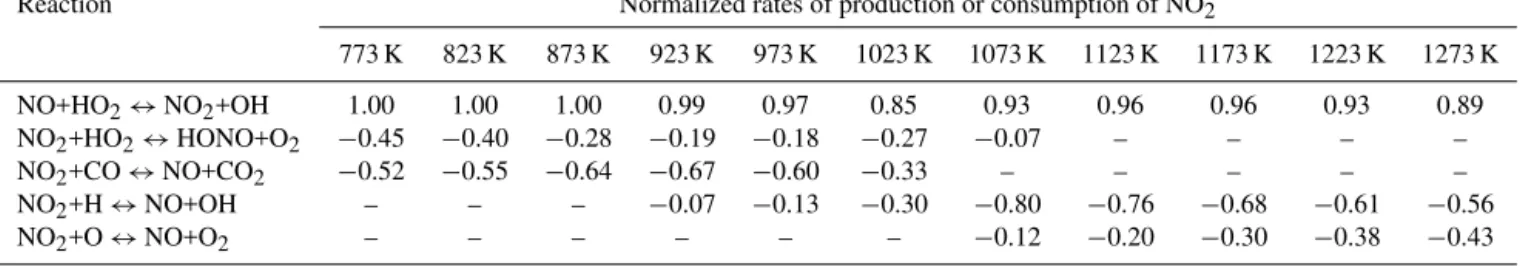
Table 2.Normalized rate of production or normalized rate of consumption (negative values) of NO2as a function of the temperature at fuel-lean conditions.
Reaction Normalized rates of production or consumption of NO2
773 K 823 K 873 K 923 K 973 K 1023 K 1073 K 1123 K 1173 K 1223 K 1273 K
NO+HO2↔NO2+OH 1.00 1.00 1.00 0.99 0.97 0.85 0.93 0.96 0.96 0.93 0.89
NO2+HO2↔HONO+O2 −0.45 −0.40 −0.28 −0.19 −0.18 −0.27 −0.07 – – – –
NO2+CO↔NO+CO2 −0.52 −0.55 −0.64 −0.67 −0.60 −0.33 – – – – –
NO2+H↔NO+OH – – – −0.07 −0.13 −0.30 −0.80 −0.76 −0.68 −0.61 −0.56
NO2+O↔NO+O2 – – – – – – −0.12 −0.20 −0.30 −0.38 −0.43
0 0,1 0,2 0,3 0,4 0,5 0,6 0,7 0,8 0,9 1
773 823 873 923 973 1023 1073 1123 1173 1223 1273
N
O
N
o
rm
a
li
zed
ra
te
o
f
p
ro
d
u
ct
io
n
Temperature (K)
HNO+OH=NO+H2O
HNO+O2=NO+HO2
NO+OH+M=HONO+M
NO+HCO=HNO+CO
NO2+H=NO+OH
NO2+O=NO+O2
NO2+CO=NO+CO2
Figure 4.Normalized rate of production of NO at fuel-lean
condi-tions (ϕ=0.6).
-0,6 -0,4 -0,2 0 0,2 0,4 0,6 H+O2 ⇌OH+O
H+O2+M ⇌HO2+M H2O+O ⇌2OH HO2+OH ⇌H2O+O2 H+HO2 ⇌2OH NH2+O ⇌HNO+H NH2+NO ⇌NNH+OH NH2+NO ⇌N2+H2O NH2+HO2 ⇌H2NO+OH NO+HO2 ⇌NO2+OH NO2+H ⇌NO+OH H2NO+O ⇌NH2+O2 H2NO+H ⇌NH2+OH H2NO+O ⇌HNO+OH H2NO+OH ⇌HNO+H2O
Figure 5.PSR code outputs for sensitivity analysis on NO at
fuel-lean conditions (ϕ=0.6) and 1073 K.
However, part of the NO2is converted back to NO directly
or via HONO (Table 2). For temperatures lower than 1023 K, NO2 reacts with CO to form NO and CO2 (Fig. 4,
Reac-tion R11). It worth noting that in this range of temperatures the oxidation of CO is not efficient. For temperatures higher than 1023 K, when the NO production is more efficient, NO2
is almost entirely converted back to NO by reacting with the
-0,6 -0,4 -0,2 0 0,2 0,4
H+O2 ⇌OH+O
H+O2+M ⇌HO2+M
HCO+M ⇌H+CO+M
HCO+O2 ⇌CO+HO2
CH3OH ⇌CH3+OH
NH+NO ⇌N2O+H
NH2+O ⇌NH+OH
NH2+O ⇌HNO+H
NH2+OH ⇌NH+H2O
NH2+NO ⇌NNH+OH
NH2+NO ⇌N2+H2O
Figure 6.PSR code outputs for sensitivity analysis on NO at
fuel-lean conditions (ϕ=0.6) and 1273 K.
H and O radicals (Reactions R12 and R13, Table 2). These two reactions are fast if their activation energy is considered (i.e. 362 and 600 cal mol−1, respectively). So in the presence of high concentrations of radicals, NO2is rapidly converted
back to NO (Miller and Bowman, 1989).
NO2+CO⇔NO+CO2 (R11)
NO2+H⇔NO+OH (R12)
NO2+O⇔NO+O2 (R13)
NO is also removed to form HNO by reacting with HCO at high temperatures (Reaction R14). However, as NO2, HNO
is almost entirely converted back to NO.
NO+HCO⇔HNO+CO (R14)
+HO2
NO2
NH3 NH2 HNO
H2NO
NO
NH
+OH, +O
+H2 +H+M + HO2 +OH +HNO
N2 +H, +CO +OH, +H, +O2,+M,+CO
+HCO, +H+M
+HO2 +H+M
+M +H
+O, +O2
+O2,+O +H
+NO +H+M
+O, +OH
+H, +NH2 +OH, +O2
HCNO +H
+OH, +O
+HCCO +CH2 +O2
+H
HCN
+HCCO +CH3
N2O
N
+NO +H
+CO +O2 +CO
+NH2 HNCO
+CO +H
+O2 +CO2
+CO +H
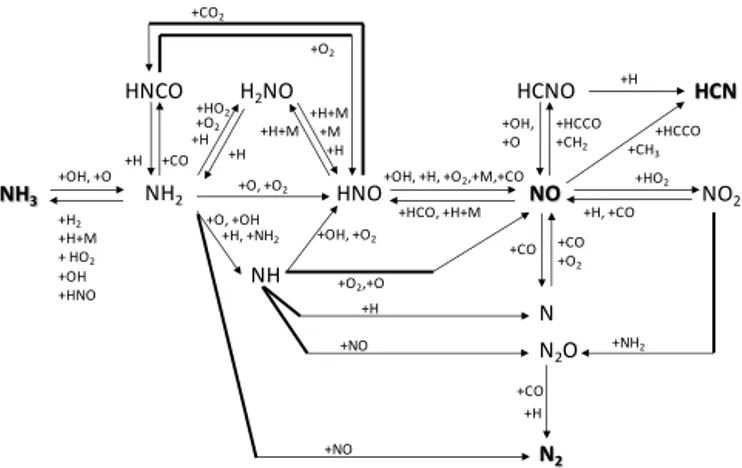
Figure 7.Reaction path diagram of the principal reactions involved in the NO chemistry at fuel-rich conditions.
The sensitivity analysis highlights how the NO chemistry strongly depends on reactions involving NH2, the influence
of the H2NO route and the importance of the composition of
the radical pool. As temperature increases, according to the results of the sensitivity analysis at 1273 K, reactions involv-ing hydrocarbon radicals and CO become relevant in the NO chemistry.
3.2.2 Fuel-rich conditions
At fuel-rich conditions NO chemistry is more complex than at fuel-lean conditions as indicated by the reaction path dia-gram presented in Fig. 7. In these conditions, 83 % of NH3
leads to the formation of N2and NO. The remaining amount
of NH3is principally converted to HCN.
As at fuel-lean conditions, NH3 is mainly converted to
NH2 by hydrogen abstraction (Reaction R6). Moreover, at
fuel-rich conditions and temperatures higher than 1073 K, reaction with oxygen atom (Reaction R15) also provides a non-negligible contribution to NH2formation.
NH3+O⇔NH2+OH (R15)
Part of NH2 may be recycled to NH3 by reacting with the
hydroperoxyl radical (Reaction R7), as at fuel-lean condi-tions. However, other reactions involving NH2participate in
the NH3formation (Reactions R16–R18).
NH2+H2⇔NH3+H (R16)
NH2+H+M⇔NH3+M (R17)
NH2+HNCO⇔NH3+NCO (R18)
The subsequent reactions of NH2largely determine the
for-mation of N-containing compounds since the forfor-mation of N2, N2O and NO mostly occur by reactions involving amine
radical species.
The formation of N2 follows essentially the same
path-ways as at fuel-lean conditions; this is through the reaction of NH2with NO (Reaction R8). In the same way, N2O is also
produced by the reaction of NH2with NO (Reaction R19).
This reaction represents a minor contribution in NO con-sumption in the conditions of this study. The normalized rate of consumption of NO due to this reaction at 1273 K is
−0.055. Moreover, N2O is almost entirely consumed to form
N2by reaction with CO and to a lower extent with H.
NH2+NO⇔N2O+H (R19)
Concerning NO, it is mostly produced by reactions involv-ing HNO (Fig. 8). Between 773 and 1023 K, the oxidation of HNO (Reaction R9) is the main source of NO, but also the reactions of HNO with CO (reverse Reaction R14) or the thermal dissociation of HNO (Reaction R20) contribute to the NO formation. For higher temperatures the reaction of HNO with the H radical (Reaction R21) becomes significant.
HNO+M⇔NO+H+M (R20)
HNO+H⇔NO+H2 (R21)
HNO is mainly formed by NH2and H2NO, but also by the
isocyanic acid (HNCO) due to the reaction NH2+CO. The
presence of CO in the degradation gases of vegetation en-hances this reaction. However, this route of HNO formation is only important for temperatures from 873 to 1073 K, where the CO oxidation is not efficient.
At high temperatures, from 1173 K and on, NO is also formed through other species than HNO. The most impor-tant reaction involves CO2 (Reaction R22), but HCNO and
NH also contribute to the NO formation.
CO2+N⇔CO+NO (R22)
As at fuel-lean conditions, once NO is formed, some NO to NO2interconversion occurs by the reaction of NO with the
hydroperoxyl radical (Reaction R10). However, NO2is
con-verted back to NO (Table 3) through reactions with CO (Re-action R11) and H radical (Re(Re-action R12). For temperatures higher than 1123 K, all the NO2produced is recycled back to
NO.
For temperatures higher than 1123 K, different reaction paths participate on the NO consumption (Fig. 9). The con-tribution of the sequence NO→ HNO (Reactions R14 and R20) in NO removal is lower than 20 %. It is worth noting that both reactions contribute to the NO production up to 1073 K, as previously detailed. So temperature changes the direction of the reaction. As at fuel-lean conditions, HNO is converted almost completely back to reform NO by reaction with the H atom.
Table 3.Normalized rate of production or normalized rate of consumption (negative values) of NO2as a function of the temperature at fuel-rich conditions.
Reaction Normalized rates of production or consumption of NO2
773 K 823 K 873 K 923 K 973 K 1023 K 1073 K 1123 K 1173 K 1223 K 1273 K
NO+HO2↔NO2+OH 1.00 1.00 1.00 1.00 1.00 1.00 1.00 0.99 0.99 0.99 0.99
NO2+CO↔NO+CO2 −0.86 −0.87 −0.91 −0.93 −0.93 −0.90 −0.81 – – – –
NO2+H↔NO+OH – – – – – – −0.10 −0.98 −0.99 −0.99 −0.99
0 0,1 0,2 0,3 0,4 0,5 0,6 0,7 0,8 0,9
773 823 873 923 973 1023 1073 1123 1173 1223 1273
N
O
n
or
m
a
li
ze
d
r
a
te
of
p
rod
u
ct
ion
Temperature (K)
NH+O2=NO+OH NH+O=NO+H HNO+H=NO+H2 HNO+O2=NO+HO2 NO+H+M=HNO+M NO+HCO=HNO+CO NO2+H=NO+OH NO2+CO=NO+CO2 HCNO+O=NO+HCO HCNO+OH=NO+CH2O CO2+N=CO+NO
Figure 8.Normalized rate of production of NO at fuel-rich
condi-tions (ϕ=1.4).
radicals (Reactions R23 and R24), which results from the in-teraction of hydrocarbon and nitrogen species. The impact of these reactions on NO consumption increases with tempera-ture. At 1273 K the normalized rate of consumption of NO to form HCNO is equal to−0.321, whereas to form HCN it is equal to−0.144.
HCCO+NO⇔HCNO+CO (R23)
HCCO+NO⇔HCN+CO2 (R24)
The importance of the branching ratio for the HCCO / NO reactions depends on the fate of HCNO (Glarborg et al., 1998). HCNO mostly reforms NO by reacting with oxy-genated radicals (Reactions R25 and R26), and produces HCN by reaction with hydrogen atoms (Reaction R27).
HCNO+O⇔NO+HCO (R25)
HCNO+OH⇔NO+CH2O (R26)
HCNO+H⇔HCN+OH (R27)
In the conditions of this study, the route HCNO→NO pre-vails over the route HCNO →HCN. At 1273 K where the reactions HCCO +NO (Reactions R23 and R24) are more significant, the normalized rate of consumption of HCNO to
-0,7 -0,6 -0,5 -0,4 -0,3 -0,2 -0,1 0
1123 1173 1223 1273
N
O
n
o
rm
a
li
zed
ra
te
o
f
co
n
su
m
p
ti
o
n
Temperature (K)
NH+NO=N2O+H NH2+NO=N2+H2O NO+HO2=NO2+OH NO+H+M=HNO+M NO+HCO=HNO+CO HCCO+NO=HCNO+CO HCCO+NO=HCN+CO2
Figure 9.Normalized rate of consumption of NO at fuel-rich
con-ditions (ϕ=1.4).
form NO (Reactions R25 and R26) is equal to 0.569, while to form HCN (Reaction R27) it is equal to 0.425. For lower temperatures the difference between both values is higher.
It is worth noting that even the well-known reaction of for-mation of HCN by means of the reaction of CH3and NO
(Re-action R28) participates in the HCN production; its contribu-tion to the NO consumpcontribu-tion represents less than 5 % of the total NO consumption according to the rate-of-production analysis. Moreover, this reaction is only important at tem-peratures lower than 1123 K, where neither the production of HCN nor the production of NO is efficient.
CH3+NO⇔HCN+H2O (R28)
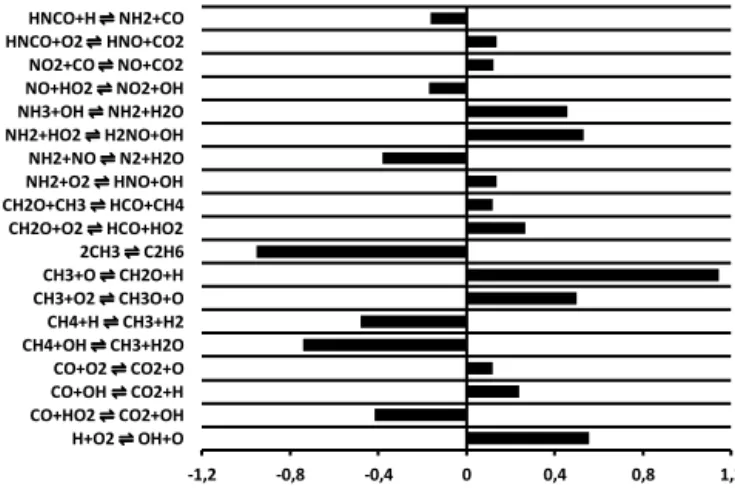
The sensitivity analysis results at 1073 K (Fig. 10) and 1273 K (Fig. 11) illustrate the complex chemistry of NO at fuel-rich conditions. Results of the sensitivity analysis em-phasize the importance of the fate of the hydrocarbon radi-cals on the NO chemistry. The branching reactions leading either to C2H6or CH2O (CH3O) enhance the removal or the
-1,2 -0,8 -0,4 0 0,4 0,8 1,2
H+O2 ⇌OH+O
CO+HO2 ⇌CO2+OH
CO+OH ⇌CO2+H
CO+O2 ⇌CO2+O
CH4+OH ⇌CH3+H2O
CH4+H ⇌CH3+H2
CH3+O2 ⇌CH3O+O
CH3+O ⇌CH2O+H
2CH3 ⇌C2H6
CH2O+O2 ⇌HCO+HO2
CH2O+CH3 ⇌HCO+CH4
NH2+O2 ⇌HNO+OH
NH2+NO ⇌N2+H2O
NH2+HO2 ⇌H2NO+OH
NH3+OH ⇌NH2+H2O
NO+HO2 ⇌NO2+OH
NO2+CO ⇌NO+CO2
HNCO+O2 ⇌HNO+CO2
HNCO+H ⇌NH2+CO
Figure 10.PSR code outputs for sensitivity analysis on NO at
fuel-rich conditions (ϕ=1.4) and 1073 K.
4 NO modelling
4.1 Derivation of the NO global kinetic model
The growing concern for the environment and the increas-ingly stringent emissions standards in both Europe and the United States have promoted the development of global ki-netic mechanisms to study the NO formation in combustion processes, particularly those associated with industrial appli-cations. Thus, the oxidation of NH3has been modelled in the
simplest way by a two-step scheme (Reactions R29 and R30) as proposed by several authors (De Soete, 1975; Mitchell and Tarbell, 1982).
N1:NH3+O2⇒NO+H2O+
1
2H2 (R29)
N2:NH3+NO⇒N2+H2O+
1
2H2 (R30)
This two-step mechanism represents fairly well the NO chemistry at fuel-lean conditions in relation with the reaction path analysis and the sensitivity analysis. At fuel-rich condi-tions the sensitization of hydrocarbon radicals and CO / CO2
to NO is more significant. Moreover, the consumption of NO to form HCN through the sequence HCCO (→HCNO)→
HCN acquires more importance as temperature increases. The number of chemical species and global steps included in the kinetic mechanism must be a balance of the compet-ing needs of accuracy and simplicity to attain the computa-tion time requirements. Moreover, the kinetic model has to be suitable for all different conditions encountered in a wildfire (i.e. both fuel-lean and fuel-rich conditions, different degra-dation gas composition and temperatures, etc.).
So to keep the kinetic mechanism simple, we decided to model the NO chemistry from fuel-bound nitrogen by the re-action scheme presented in Rere-actions (R29) and (R30) and therefore to omit the consumption of NO to form HCN. It is worth noting that this mechanism is only important at
fuel--0,4 -0,3 -0,2 -0,1 0 0,1 0,2 0,3
O+H2 ⇌OH+H H+O2+M ⇌HO2+M CH4 ⇌CH3+H C2H3+O2 ⇌CH2O+HCO CH2CO+H ⇌CH3+CO HCCO+H ⇌SCH2+CO HCCO+O2 ⇌2CO+OH NH+H ⇌N+H2 NH+NO ⇌N2O+H NH2+H ⇌NH+H2 NH2+NO ⇌N2+H2O HCCO+NO ⇌HCNO+CO HCCO+NO ⇌HCN+CO2 HCNO+H ⇌HCN+OH
Figure 11.PSR code outputs for sensitivity analysis on NO at
fuel-rich conditions (ϕ=1.4) and 1273 K.
rich conditions and temperatures higher than 1173 K. More-over, the contribution of this reaction pathway to the con-sumption of NO varies between 10 % at 1173 and 28 % at 1273 K, as already detailed in the previous section.
To determine the rate of NH3 oxidation reaction
(Reac-tion R29), the classical steady-state assump(Reac-tion was used to relate the OH radical to the main components, since the most important reaction on the consumption of ammonia in the conditions of this study is that with the OH radical (Reac-tion R6). Consequently the OH radical was supposed to be proportional to the square root of the product of O2and H2
concentrations.
Concerning the reaction of NO consumption (Reac-tion R30), it was assumed that its reac(Reac-tion rate was first order in NH3 and NO. In addition, due to the different reaction
pathways of NO consumption depending on the fuel equiv-alence ratio, as indicated by the results of the reaction path analysis and previously mentioned, a function of the equiva-lence ratio was added to the formal expression corresponding to the reaction rate of NO consumption.
Both global mechanisms were coupled without taking into account the possible effects of sensitization of CH4 and
CO / CO2to NO.
4.2 Model fitting
The reaction rate expressions of the global model obtained from the calibration are given by Eqs. (1) and (2), whereω˙is expressed in mol×cm−3×s−1.
˙
ω{N1}=k{N1}T2[NH3]1.00[H2]0.50[O2]0.50exp
−62 000
RT
(1)
˙
ω{N2}=k{N2}T−1.3[NH3]1.00[NO]1.00exp
−37 000
RT
0,00E+00 1,00E-05 2,00E-05 3,00E-05 4,00E-05 5,00E-05 6,00E-05 7,00E-05 0,00E+00 5,00E-05 1,00E-04 1,50E-04 2,00E-04 2,50E-04 3,00E-04
773 873 973 1073 1173 1273
M ol e f ra ct ion N O M o le f ra ct io n N H3 Temperature [K]
GDF-kin, φ=0.6
NH3 NO 0,00E+00 1,00E-05 2,00E-05 3,00E-05 4,00E-05 5,00E-05 6,00E-05 7,00E-05 0,00E+00 5,00E-05 1,00E-04 1,50E-04 2,00E-04 2,50E-04 3,00E-04
773 873 973 1073 1173 1273
M ol e f ra ct ion N O M o le f ra ct io n N H3 Temperature [K]
2-steps model, φ=0.6
NH3 NO 0,00E+00 1,00E-05 2,00E-05 3,00E-05 4,00E-05 5,00E-05 0,00E+00 5,00E-05 1,00E-04 1,50E-04 2,00E-04 2,50E-04 3,00E-04
773 873 973 1 073 1 173 1 273
Mo le f ra c ti o n N O Mo le f ra c ti o n N H3 Temperature [K]
GDF-kin, ɸ= ,
NH3 NO 0,00E+00 1,00E-05 2,00E-05 3,00E-05 4,00E-05 5,00E-05 0,00E+00 5,00E-05 1,00E-04 1,50E-04 2,00E-04 2,50E-04 3,00E-04
773 873 973 1 073 1 173 1 273
M o le fr a c ti o n N O Mo le fr a c ti o n N H3 Temperature [K]
2-steps model, φ=1.0
NH3 NO 0,00E+00 1,00E-06 2,00E-06 3,00E-06 4,00E-06 5,00E-06 6,00E-06 0,00E+00 5,00E-05 1,00E-04 1,50E-04 2,00E-04 2,50E-04 3,00E-04
773 873 973 1073 1173 1273
M ol e f ra ct ion N O M ol e f ra ct ion N H3 Temperature [K]
GDF-kin, ɸ= .4
NH3 NO 0,00E+00 1,00E-06 2,00E-06 3,00E-06 4,00E-06 5,00E-06 6,00E-06 0,00E+00 5,00E-05 1,00E-04 1,50E-04 2,00E-04 2,50E-04 3,00E-04
773 873 973 1073 1173 1273
M ol e f ra ct ion N O M ol e f ra ct ion N H3 Temperature [K]
2-steps model, φ=1.4
NH3
NO
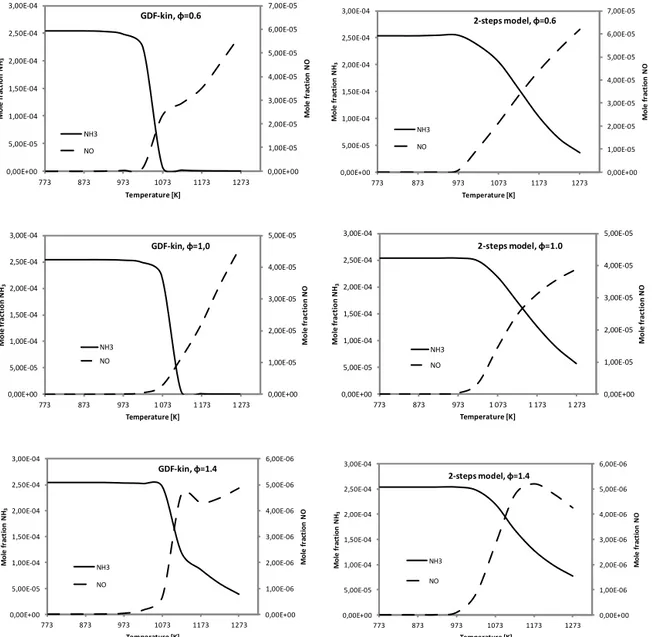
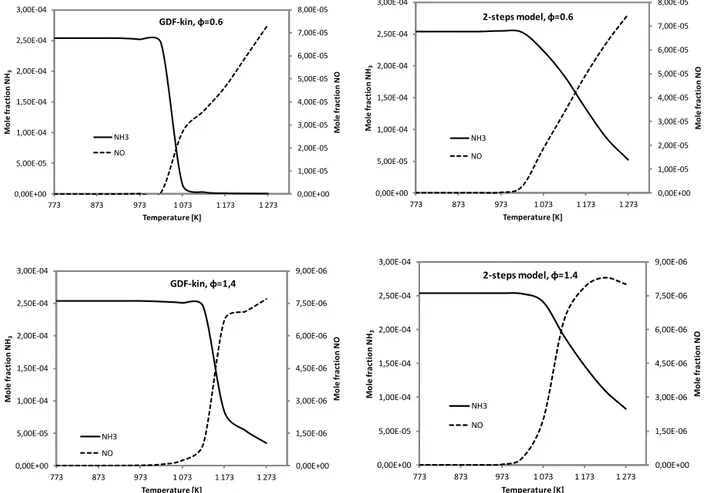
Figure 12.Comparison between the NO and NH3mole fractions concentrations obtained with the detailed mechanism GDF-Kin®3.0 and
the global model developed in the present work as a function of the temperature, and for different equivalence ratios (i.e.ϕ=0.6, 1.0 and
1.4), for a residence time of 1.3 s.
where k{N1} is equal to 3.22 1012 and k{N2} is given by Eq. (3).
k{N2}=exp
45.7+Ŵ (φ−1)·φ2, (3) whereϕis the fuel equivalence ratio andŴ(x)is the unit step function (Eq. 4).
Ŵ (x)=
0 1
x≤0
x >0 (4)
Figure 12 shows the comparison between the calculated NH3
and NO concentrations (mole fraction), as a function of the temperature using the global reaction mechanism, and the
reference detailed chemistry, for the different fuel equiva-lence ratios (i.e. 0.6, 1.0 and 1.4).
As it can be seen in this figure, the NO concentration pro-files are properly predicted with the global model both at fuel-lean and fuel-rich conditions. The differences between the overall production of NO at 1273 K obtained with the global and the detailed mechanism are 7.4, 11.7 and 12.6 %, respectively, for an equivalence ratio of 0.6, 1.0 and 1.4.
Regarding NH3, there is also a good agreement in
gen-eral terms between the predicted concentration profiles by the global model and the detailed mechanism. However, the oxidation of NH3as a function of the temperature is sharper
fuel-Table 4.Percentage of NH3conversion to NO.
ϕ GDF-Kin®3.0 Two-step global
model
0.6 22.8 28.5
1.0 18.1 19.8
1.4 2.3 2.4
0,00E+00 5,00E-03 1,00E-02 1,50E-02 2,00E-02 2,50E-02 3,00E-02 3,50E-02 4,00E-02 4,50E-02
773 873 973 1073 1173 1273 1373
M
o
le
f
ra
ct
io
n
Temperature [K]
O2 GM
O2 GDF
CH4 GM
CH4 GDF
Figure 13.Comparison between the CH4and O2 mole fractions
concentrations obtained with the detailed mechanism GDF-Kin®
3.0 (GDF on the legend) and the global model (GM on the legend) as a function of the temperature at fuel-rich conditions.
lean and stoichiometric conditions. As a result, the global model is not able to predict the entire consumption of NH3.
The relative errors in the prediction of the global consump-tion of NH3by the global model in comparison with the
de-tailed mechanisms are 14.1, 9.5 and 17.8 %, respectively, for an equivalence ratio of 0.6, 1.0 and 1.4.
If the percentage of NH3converted into NO is computed,
the values obtained with GDF-Kin®3.0 and the global model are fairly similar (Table 4). The largest divergence is ob-served at fuel-lean conditions, where the global model over-predicts the conversion of NH3to NO because of the error
induced by the NH3predictions.
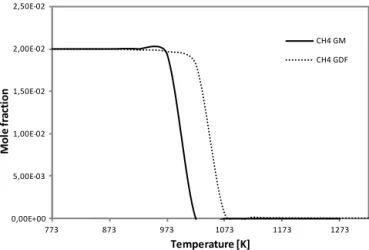
Concerning the other major chemical species present in the gas mixture of the degradation gases of vegetation, Figs. 13 and 14 show, respectively, the CH4and O2; and CO and CO2
concentration profiles as a function of the temperature at a fuel equivalence ratio of 1.4. In these conditions, there is a good agreement between the results obtained with both kinetic mechanisms. At stoichiometric and fuel-lean condi-tions, results show that the predicted temperature at which CH4, CO, CO2 and O2 start being consumed or produced
is higher when using the detailed mechanism, as it can be seen in Fig. 15 for the particular case of CH4 at fuel-lean
conditions. The reaction temperature has shifted 50 K due to the sensitization of these species to NO. The discrepancy be-tween the predictions of the global model and the detailed
0,00E+00 1,00E-02 2,00E-02 3,00E-02 4,00E-02 5,00E-02 6,00E-02 7,00E-02 8,00E-02 9,00E-02
773 873 973 1073 1173 1273 1373
M
ol
e
f
ra
ct
ion
Temperature [K]
CO GM
CO GDF
CO2 GM
CO2 GDF
Figure 14.Comparison between the CO and CO2mole fractions
concentrations obtained with the detailed mechanism GDF-Kin®
3.0 (GDF on the legend) and the global model (GM on the legend) as a function of the temperature at fuel-rich conditions.
0,00E+00 5,00E-03 1,00E-02 1,50E-02 2,00E-02 2,50E-02
773 873 973 1073 1173 1273
M
o
le
f
ra
ct
io
n
Temperature [K]
CH4 GM CH4 GDF
Figure 15.Comparison between the CH4mole fractions
concentra-tions obtained with the detailed mechanism GDF-Kin®3.0 (GDF
on the legend) and the global model (GM on the legend) as a func-tion of the temperature at fuel-lean condifunc-tions.
mechanism is only in terms of the temperature of oxida-tion/production of CH4, CO, CO2and O2; since this
differ-ence is only about 50 K, predictions of the global model can reasonably be considered as fairly accurate predictions.
5 Discussion 5.1 Model testing
0,00E+00 1,00E-05 2,00E-05 3,00E-05 4,00E-05 5,00E-05 6,00E-05 7,00E-05 8,00E-05 0,00E+00 5,00E-05 1,00E-04 1,50E-04 2,00E-04 2,50E-04 3,00E-04
773 873 973 1 073 1 173 1 273
Mo le fr a c ti o n N O Mo le f ra ct io n N H3 Temperature [K] GDF-kin, ɸ= .6
NH3 NO 0,00E+00 1,00E-05 2,00E-05 3,00E-05 4,00E-05 5,00E-05 6,00E-05 7,00E-05 8,00E-05 0,00E+00 5,00E-05 1,00E-04 1,50E-04 2,00E-04 2,50E-04 3,00E-04
773 873 973 1 073 1 173 1 273
M o le f ra c ti o n N O M o le f ra c ti o n N H3 Temperature [K] 2-steps model, φ=0.6
NH3 NO 0,00E+00 1,50E-06 3,00E-06 4,50E-06 6,00E-06 7,50E-06 9,00E-06 0,00E+00 5,00E-05 1,00E-04 1,50E-04 2,00E-04 2,50E-04 3,00E-04
773 873 973 1 073 1 173 1 273
M o le f ra c ti o n N O Mo le f ra c ti o n N H3 Temperature [K] GDF-kin, ɸ= ,4
NH3 NO 0,00E+00 1,50E-06 3,00E-06 4,50E-06 6,00E-06 7,50E-06 9,00E-06 0,00E+00 5,00E-05 1,00E-04 1,50E-04 2,00E-04 2,50E-04 3,00E-04
773 873 973 1 073 1 173 1 273
Mo le f ra c ti o n N O Mo le f ra c ti o n N H3 Temperature [K] 2-steps model, φ=1.4
NH3 NO
Figure 16.Comparison between the NO and NH3mole fractions concentrations obtained with the detailed mechanism GDF-Kin®3.0 and
the global model developed in the present work as a function of the temperature, and for different equivalence ratios (i.e.ϕ=0.6 and 1.4),
for a residence time of 0.6 s.
Figure 16 presents the results of the calculated NH3and
NO concentrations (mole fraction) as a function of the tem-perature by using the global model and the reference detailed mechanism at fuel-lean and fuel-rich conditions, correspond-ing to fuel equivalence ratios of 0.6 and 1.4, respectively. As it can be seen in this figure, the NO concentration profiles are accurately predicted with the global model. The differences between the overall production of NO at 1273 K obtained with the global and the detailed mechanisms are 2.0 and 4.3 %, respectively, for an equivalence ratio of 0.6 and 1.4.
Concerning NH3, as for a residence time of 1.3 s, even
though there is also a general good agreement between the predicted concentration profiles by the global model and the detailed mechanism, the concentration of NH3as a function
of the temperature drops sharply when predicted by the de-tailed mechanism compared to when predicted by the global model. Thus, the global model is not able to predict the en-tire consumption of NH3. In this case, the relative errors in
the predictions of the global NH3consumption by the global
model in comparison with the detailed mechanisms are, re-spectively, for an equivalence ratio of 0.6 and 1.4, 20.6 and 22.0 %.
Conversion factors of NH3to NO computed by the values
obtained with the global model are 37.3 and 4.7 % for fuel-lean and fuel-rich conditions, respectively. The correspond-ing values obtained with the detailed kinetic mechanism are 29 and 3.5 %. As for a residence time of 1.3 s, the observed differences between prediction with the global model and the detailed kinetic mechanism are due to the error in the predic-tion of the entire consumppredic-tion of NH3by the global model.
For the other major chemical species present in the gas mixture of the degradation gases of vegetation, CH4, O2, CO
and CO2, the concentration profiles as a function of the
tem-perature are properly predicted at both fuel-lean and fuel-rich conditions. In this case no shift of the reaction temperature is produced as it was observed for a residence time of 1.3 s. Thus, the NO global model coupled to the CH4/ CO model
captures the essential features of the NO chemistry. 5.2 Comparison to experimental data available
in the literature
CH4/ CO / CO2/ NH3gas mixtures in the conditions of this
study. An experimental study performed in a PSR device that presents conditions close to the present work is that of Dagaut et al. (1998). The experimental data of this work were used to develop the model for the NO chemistry included in the detailed mechanism of reference. Therefore, comparing our results with these data will not actually provide new in-formation.
Thus, in order to back up at least in the order of magnitude the present results with experimental data, we have compared the results of this work in terms of NH3 conversion to NO
with the work of Mendiara and Glarborg (2009).
Mendiara and Glarborg (2009) studied the ammonia chemistry in the oxy-fuel combustion of methane. Experi-ments were performed in a flow reactor at temperatures rang-ing between 973 K and 1773 K, at different fuel equivalence ratios and for CH4/ NH3 mixtures highly diluted in CO2or
N2. The residence time in the reactor was of the order of 1 s.
According to their results, conversion factors of NH3 to
NO strongly depend on the presence of CO2in the mixture.
For CH4/ NH3 mixtures diluted in CO2, the conversion of
NH3to form NO varied between 27 % at fuel-lean conditions
and 15 % at fuel-rich conditions. For CH4/ NH3mixtures
di-luted in N2, these values were 47 and 4 %, respectively. Thus,
as stated by Mendiara and Glarborg (2009), CO2enhances
the formation of NO under fuel-rich conditions while it in-hibits the NO formation under stoichiometric and fuel-lean conditions.
The corresponding values predicted by the global model varied between 28.5 % at fuel-lean conditions and 2.4 % at fuel-rich conditions for a residence time of 1.3 s, and between 37.3 and 4.7 % for a residence time of 0.6 s.
The results obtained with the two-step global mechanisms are consistent with the experimental data, especially concern-ing the simulations run for a residence time of 1.3 s, which is a value closer to the conditions in which experimental data were obtained. However, a major difference is observed at fuel-rich conditions, since a greater amount of NO forma-tion would be expected according to the experimental data of Mendiara and Glarborg (2009). Clearly, the high content of CO present in the gaseous mixture of degradation gases, but not in the mixture studied by Mendiara and Glarborg (2009), and the derived sensitization effects to CH4and NO are
re-sponsible for this divergence. According to Glarborg and Bentzen (2008), high concentrations of CO in the oxidation of CH4led to alterations in the amount and partitioning of
O / H radicals with implications on the NH3conversion.
6 Conclusions
NO emissions from the combustion of vegetation at the source level have been studied numerically, considering that the volatile fraction of fuel-N released due to the ther-mal degradation of vegetation is composed by NH3. The
main chemical pathways of NO formation and their occur-rence depending on the conditions of this study have been established. NO is mainly produced through the sequence NH3→NH2(→H2NO)→HNO→NO (↔NO2).
How-ever, at fuel-rich conditions NO chemistry is more com-plex, and a larger number of chemical species and thus re-action pathways are involved in the processes of NO forma-tion and consumpforma-tion. Moreover, in these condiforma-tions the ef-fects of sensitization of hydrocarbons and CO / CO2on NO
are more significant. Thus, the conversion of NH3 (fuel-N) to NO strongly depends on the compounds present in the gaseous mixture, this is on the composition of the degrada-tion gases. The conversion of NH3 to NO depends on the
fuel-equivalence ratio as well.
According to the reaction path analysis through rate-of-production and the sensitivity analyses, a two-step global ki-netic model has been proposed for the oxidation of ammo-nia. The obtained mechanism succeeds in predicting the fi-nal concentrations of NO and NH3with reasonable accuracy
in comparison with the numerical values obtained with the detailed kinetic mechanism GDF-Kin®3.0 for different con-ditions in terms of temperatures, fuel equivalence ratio and residence time.
Different gaseous mixtures containing CH4, CO, CO2and
NH3 could be studied with the coupling of the two-step
mechanism developed herein and the five-step mechanism for CH4/ CO.
The results of this work highlight the importance of im-proving the present knowledge on the combustion processes of vegetation in order to improve the modelling of wildfire emissions. Caution has to be observed with the simplifica-tions of the composition of the degradation gases of vege-tation because minor compounds, such as fuel-N, can have relevant implications on the chemistry of the pollutants emit-ted by wildfires.
Acknowledgements. This research was supported by the French National Research Agency (ANR), under the project ANR-09-COSI-006 and by the French National Center for Scientific Research (CNRS).
Edited by: R. Lasaponara
Reviewed by: I. Gitas and one anonymous referee
References
Barboni, T., Cannac, M., Pasqualini, V., Simeoni, A., Leoni, E., and Chiaramonti, N.: Volatile and semi-volatile organic compounds in smoke exposure of firefighters during prescribed burning in the Mediterranean region. Int. J. Wildland Fire, 19, 606–612, 2010. Bartok, W., Engleman, V. S., Goldstein, R., and del Valle, E. G.:
Brink, A., Boström, S., Kilpinen, P., and Hupa, M.: Modeling nitro-gen chemistry in the freeboard of biomass-FBC, IFRF Combus-tion Journal, Article No 200107, 1–14, 2001.
Dagaut, P., Lecomte, F., Chevailler, S., and Cathonnet, M.: Experi-mental and detailed kinetic modeling of nitric oxide reduction by a natural gas blend in simulated reburning conditions. Combust. Sci. Technol., 139, 329–363, 1998.
David, R. and Matras, D.: Règles de construction et d’extrapolation des réacteurs auto-agités par jets gazeux. Can. J. Chem. Eng., 53, 297–300, 1975.
De Soete, G. G.: Overall Reaction Rates of NO and N2Formation
from Fuel Nitrogen, P. Combust. Inst., 15, 1093–1102, 1975. Duterque, J., Avezard, N., and Borghi, R.: Further Results on
Ni-trogen Oxides Production in Combustion, Zones. Combust. Sci. Technol., 25, 85–89, 1981.
El Bakali, A., Dagaut, P., Pillier, L., Desgroux, P., Pauwels, J. F., Rida, A., and Meunier, P.: Experimental and modeling study of the oxidation of natural gas in a premixed flame, shock tube and jet-stirred reactor, Combust. Flame, 137, 109–128, 2004. El Bakali, A., Pillier, L., Desgroux, P., Lefort, B., Gasnot, L.,
Pauwels, J. F., and da Costa, L.: NO prediction in natural gas
flames using GDF-Kin®3.0 mechanism NCN and HCN
contri-bution to prompt-NO formation, Fuel 85, 896–909, 2006. Faravelli, T., Frassoldati, A., and Ranzi, E.: Kinetic modeling of the
interactions between NO and hydrocarbons in the oxidation of hydrocarbons at low temperatures, Combust. Flame, 132, 188– 207, 2003.
Glarborg, P.: Hidden interactions – Trace species governing com-bustion and emissions, P. Combust. Inst., 31, 77–98, 2007.
Glarborg, P. and Bentzen, L. L. B.: Chemical effects of high CO2
concentration in oxy-fuel combustion of methane, Energ. Fuel., 22, 291–296, 2008.
Glarborg, P., Kee, R. J., Grcar, J. F., and Miller, J. A.: PSR: A FORTRAN Program for Modeling Well-Stirred Reactors. Report No.SAND 86-8209, Sandia National Laboratories, Albuquerque, NM, 1986.
Glarborg, P., Alzueta, M. U., Dam-Johansen, K., and Miller, A.: Ki-netic modeling of hydrocarbon/nitric oxide interactions in a flow reactor, Combust. Flame, 115, 1–27, 1998.
Grewe, V., Dahlmann, K., Matthes, S., and Steinbrecht, W.:
At-tributing ozone to NOxemissions: Implications for climate
miti-gation measures, Atmos. Environ., 59, 102–107, 2012.
Jaffe, D. A. and Widger, N. L.: Ozone production from wildfires: A critical review, Atmos. Environ., 51, 1–10, 2012.
Jallais, S.: Etude expérimentale et modélisation de l’oxydation d’hydrocarbures légers, PhD Thesis ENSMA, Poitiers, 2001. Kee, R. J., Rupley, F. M., and Miller, J. A.: CHEMKIN-II: A
FOR-TRAN Chemical Kinetics Package for the Analysis of Gas-Phase Chemical Kinetics, Report No. SAND 89-8009, Sandia National Laboratories, Livermore, CA, USA, 1989.
Leroy, V., Leoni, E., and Santoni, P. A.: Reduced mechanism for the combustion of evolved gases in forest fires, Combust. Flame, 154, 410–433, 2008.
Mebust, A. K., Russell, A. R., Hudman, R. C., Valin, L. C., and Cohen, R. C.: Characterization of wildfire NOx emissions
us-ing MODIS fire radiative power and OMI tropospheric NO2
columns, Atmos. Chem. Phys., 11, 5839–5851, doi:10.5194/acp-11-5839-2011, 2011.
Mendiara, T. and Glarborg, P.: Ammonia chemistry in oxy-fuel combustion of methane, Combust. Flame, 156, 1937–1949, 2009.
Miller, J. and Bowman, C.: Mechanism and modeling of nitrogen chemistry in combustion, Prog. Energ. Combust., 15, 287–338, 1989.
Miranda, A. I.: An integrated numerical system to estimate air qual-ity effects of forest fires, Int. J. Wildland Fire, 13, 1–10, 2004. Mitchell, J. W. and Tarbell, J. M.: A kinetic model of nitric
ox-ide formation during pulverized coal combustion. AICHE J., 28, 302–311, 1982.
Morvan, D. and Dupuy, J. L.: Modelling the propagation of a wild-fire through a Mediterranean shrub using a multiphase Formula-tion, Combust. Flame, 138, 199–210, 2004.
Ottomar, R., Miranda, A. I., and Sandberg, D.: Characterizing sources of emissions from wildland fires, Chapter 3, in: Wild-land Fires and Air Pollution, Developments in Environmental Science, edited by: Bytnerowicz, A., Arbaugh, M., Riebau, A., and Andersen. C., vol 8. Elsevier, Amsterdam, ISBN 978-0-08-055609-3, 2009.
Pérez-Ramirez, Y., Santoni, P. A., Darabiha, N., Leroy-Cancellieri, V., and Leoni, E.: A Global Kinetic Model for the Combustion of the Evolved Gases in Wildland Fires, Combust. Sci. Technol., 184, 1380–1394, 2012.
Rogaume, T., Koulidiati, J., Richard, F., Jabouille, F., and Torero,
J.: A model of the chemical pathways leading to NOxformation
during combustion of mixtures of cellulosic and plastic materials, Int. J. Therm. Sci., 45, 359–366, 2006.
Salzmann, R. and Nussbaumer, T.: Fuel Staging for NOx Reduc-tion in Biomass CombusReduc-tion: Experiments and Modeling, Energ. Fuel., 15, 575–582, 2001.
Santoni, P. A.: Introduction à la problématique des feux de forêt. Ecole de combustion, Ecole thématique du CNRS, Fréjus, France, 2008.
Santoni, P. A., Simeoni, A., Rossi, J. L., Bosseur, F., Morandini, F., Silvani, X., Balbi, J. H., Cancellieri, D., and Rossi, L.: In-strumentation of wildland fire: Characterization of a fire spread-ing through a Mediterranean shrub. Fire Safety J., 41, 171–184, 2006.
Strada, S., Mari, C., Filippi, J.-B., and Bosseur, F.: Wildfire and the atmosphere: Modelling the chemical and dynamic interactions at the regional scale, Atmos. Environ., 51, 234–249, 2012. Sullivan, A. L.: A review of wildland fire spread modelling, 1990–
present. 1. Physical and quasi-physical models, Int. J. Wildland Fire, 18, 349–368, 2009.
Sullivan, A. L and Ball, R.: Thermal decomposition and combustion chemistry of cellulosic biomass, Atmos. Environ., 47, 133–141, 2012.
Sullivan, N., Jensen, A., Glarborg, P., Day, M. S., Grcar, J. F., Bell, J. B., Pope, C. J., and Kee, R. J.: Ammonia conversion and NOx formation in laminar coflowing nonpremixed methane-air flames, Combust. Flame, 131, 285–298, 2002.
Tihay, V., Santoni, P. A., Simeoni, A., Garo, J. P., and Vantelon, J. P.: Skeletal and global mechanisms for the combustion of gases released by crushed forest fuels, Combust. Flame, 156, 1565– 1575, 2009a.
by the Homogenization of Three Forest Fuels, Int. J. Therm. Sci., 48, 488–501, 2009b.
Weissinger, A., Fleckl, T., and Obernberger, I.: In situ FT-IR spectroscopic investigations of species from biomass fuels in a laboratory-scale combustor: the release of nitrogenous species, Combust. Flame, 137, 403–417, 2004.