Glioma Related to Epilepsy and Cognition
Edwin van Dellen1*, Linda Douw1, Arjan Hillebrand2, Irene H. M. Ris-Hilgersom2, Menno M. Schoonheim3, Johannes C. Baayen5, Philip C. De Witt Hamer5, Demetrios N. Velis6, Martin Klein4, Jan J. Heimans1, Cornelis J. Stam2, Jaap C. Reijneveld1
1Department of Neurology, VU University Medical Center, Amsterdam, The Netherlands,2Department of Clinical Neurophysiology and MEG Center, VU University Medical Center, Amsterdam, The Netherlands,3Department of Radiology, VU University Medical Center, Amsterdam, The Netherlands,4Department of Medical Psychology, VU University Medical Center, Amsterdam, The Netherlands,5Neurosurgical Center Amsterdam, VU University Medical Center, Amsterdam, The Netherlands, 6Department of Clinical Neurophysiology and Epilepsy Monitoring Unit, Dutch Epilepsy Clinics Foundation, Heemstede, The Netherlands
Abstract
Objective:To reveal possible differences in whole brain topology of epileptic glioma patients, being low-grade glioma (LGG) and high-grade glioma (HGG) patients. We studied functional networks in these patients and compared them to those in epilepsy patients with non-glial lesions (NGL) and healthy controls. Finally, we related network characteristics to seizure frequency and cognitive performance within patient groups.
Methods:We constructed functional networks from pre-surgical resting-state magnetoencephalography (MEG) recordings of 13 LGG patients, 12 HGG patients, 10 NGL patients, and 36 healthy controls. Normalized clustering coefficient and average shortest path length as well as modular structure and network synchronizability were computed for each group. Cognitive performance was assessed in a subset of 11 LGG and 10 HGG patients.
Results:LGG patients showed decreased network synchronizability and decreased global integration compared to healthy controls in the theta frequency range (4–8 Hz), similar to NGL patients. HGG patients’ networks did not significantly differ from those in controls. Network characteristics correlated with clinical presentation regarding seizure frequency in LGG patients, and with poorer cognitive performance in both LGG and HGG glioma patients.
Conclusion: Lesion histology partly determines differences in functional networks in glioma patients suffering from epilepsy. We suggest that differences between LGG and HGG patients’ networks are explained by differences in plasticity, guided by the particular lesional growth pattern. Interestingly, decreased synchronizability and decreased global integration in the theta band seem to make LGG and NGL patients more prone to the occurrence of seizures and cognitive decline.
Citation:van Dellen E, Douw L, Hillebrand A, Ris-Hilgersom IHM, Schoonheim MM, et al. (2012) MEG Network Differences between Low- and High-Grade Glioma Related to Epilepsy and Cognition. PLoS ONE 7(11): e50122. doi:10.1371/journal.pone.0050122
Editor:Dante R. Chialvo, National Research & Technology Council, Argentina
ReceivedJanuary 23, 2012;AcceptedOctober 19, 2012;PublishedNovember 14, 2012
Copyright:ß2012 van Dellen et al. This is an open-access article distributed under the terms of the Creative Commons Attribution License, which permits unrestricted use, distribution, and reproduction in any medium, provided the original author and source are credited.
Funding:E. van Dellen is supported by the Dutch Epilepsy Foundation (NEF) grant 09–09. L. Douw is supported by the Dutch Epilepsy Foundation (NEF) grant 08–08. M. Schoonheim is supported by the Dutch MS Research Foundation grant 08–650. Authors report no other disclosures. The funders had no role in study design, data collection and analysis, decision to publish, or preparation of the manuscript.
Competing Interests:The authors have declared that no competing interests exist.
* E-mail: [email protected]
Introduction
Symptoms in patients with brain tumors and in other lesional epilepsy patients are to some extent correlated with histological characteristics of the lesion. For example, most low-grade glioma (LGG; WHO grade 2) patients suffer from seizures. The faster and more invasively growing high-grade gliomas (HGG; WHO grade 3 and 4) more often lead to focal neurological deficits and symptoms due to raised intracranial pressure [1,2]. Moreover, patients with cerebral lesions suffer from cognitive deficits, for example in the attention domain, that cannot be explained by local disturbance due to infiltration of the lesion [3].
Cerebral lesions such as brain tumors can lead to global alterations in functional interactions, even between brain regions remote from the tumor [4,5]. This recent insight may increase our understanding of the symptoms in these patients. Differences in
symptom patterns might be explained by specific neural network alterations induced by these lesions, possibly depending on pathological background and growth patterns. The brain can be approached as a complex network of interacting brain regions [6]. Functional networks can be studied using neurophysiological recordings such as magnetoencephalography (MEG). Once functional connections between brain areas have been estimated, the resulting brain network can be characterized by concepts originating from graph theory [6,7,8]. Several studies have shown that small-world networks, which combine local segregation with global integration, facilitate optimal (brain) network functioning [6,9,10,11].
patients with brain tumors and/or epilepsy [4,12,13,14,15,16,17,18,19]. However, at this point the picture is far from complete. Previous studies on functional networks in brain tumor patients were mostly based on MEG recordings obtained after neurosurgical intervention or biopsy, while tumor resection has been described to alter functional connectivity [20]. Moreover the contributions of other factors on these network changes, such as genetic predisposition [21], the duration of epilepsy [15,16], but also the pathology of the underlying lesion, are largely unknown, let alone their interactions. Other network measures than the small-world characteristics described above may yield additional crucial information related to brain functioning in healthy controls and patients suffering from brain diseases. Synchronizability, defined as the stability of the synchronous state [22], , may be of special interest in lesional epilepsy patients, because a seizure can be seen as a temporary transition to a global synchronized state. Indeed, it has been shown that network synchronizability is dynamically altered during epileptic seizures [23]. Synchronizability is related to the topology of the underlying network, but this interaction is complex [24]. The loss of small-world characteristics in the functional networks of brain tumor patients can therefore not be seen as a direct explanation for the vulnerability for epileptic seizures in these patients. Characterization of synchronizability during interictal MEG may provide additional insights on the relation between epilepsy and altered functional networks. Furthermore, functional modules have been identified in the human brain that change during the aging process [25,26]. Dynamic changes in modularity are related to learning ability, suggesting that the underlying modular structure determines cognitive performance [27]. It has recently been shown that modularity is altered in patients with absence seizures during interictal MEG recordings [28], but no previous work has studied modular characteristics in relation to brain tumors and lesional epilepsy.
In this paper we investigate functional brain networks in LGG and HGG patients. We compare these patients to healthy controls and epilepsy patients with non-glial lesions (NGL). Since epilepsy burden is a known correlate of altered network topology [15,16], we only studied glioma patients suffering from epilepsy. We hypothesize that networks differ between LGG and HGG patients. We speculate that plasticity effects are reflected in the networks of patients with relatively slow growing lesions such as LGG, in such a way that their networks are more similar to networks of NGL patients than to those in healthy controls or in patients with rapidly growing lesions such as HGG [29]. We expect that changes are mostly seen in the theta band, as functional connectivity in this frequency range is most constantly described to be altered in brain tumor and epilepsy patients [14,15,18,20]. Finally, we aim to show that a change in synchronizability is related to higher seizure frequency, and that disrupted modular network organization is related to poorer cognitive performance.
Methods
Subjects
Patients were referred for MEG recordings as part of presurgical evaluation by the Neurosurgical Center Amsterdam between January 2006 and October 2009. Inclusion criteria were: (i) age 18 years or older, (ii) a radiologically identified cerebral lesion confirmed by neuropathology, (iii) a history of seizures. Exclusion criteria for patients and healthy controls were i) prior neurosur-gical treatment and ii) a history of neuroloneurosur-gical disease (other than the inclusion criteria). MEG recordings were obtained prior to neurosurgical intervention. MEG recordings of healthy control
subjects were obtained. We divided the patient group into three subgroups according to the subsequent pathological diagnosis of the lesion after surgery: low-grade glioma (LGG; WHO classifi-cation grade II), high-grade glioma (HGG; WHO classificlassifi-cation grade III and IV) and non-glioma. Seizure frequency (defined as number of seizures per month) and epilepsy duration (defined as time in months since first seizure) at time of MEG recording were calculated to determine the burden of these factors for every patient.
Ethics statement
Ethical approval was granted by the VU University Medical Ethics Committee. All data were analysed anonymously. Subjects who underwent MEG recordings for research purposes had given written informed consent before participating. All clinical inves-tigations were conducted according to the Declaration of Helsinki.
Neuropsychological screening
We preoperatively assessed the Stroop color-word test (atten-tion, executive functioning, mental flexibility, mental processing speed), categoric verbal fluency (executive functioning), and the visual verbal learning test (storage and retrieval of verbal memory) in a subset of patients. Scores were compared to those of a healthy control subject (individually matched for age, sex, and educational level) derived from a normative sample [30]. Educational level was assessed with an 8-point scale scoring system, ranging from not having finished primary education (level 1) to having obtained a university degree (level 8) [31]. Patients’ cognitive performance z-scores were calculated for each neuropsychological test score by comparing each person’s score with the mean and standard deviation of the matched healthy controls. In order to obtain a single score on each subtest, different aspects of each test were averaged after conversion to z-scores.
Magnetoencephalography (MEG)
beta (13–30 Hz), lower gamma (30–45 Hz) and higher gamma (55–80 Hz) [32].
Functional connectivity
Functional connectivity was calculated by means of the phase lag index (PLI), a measure that is insensitive to the effects of volume conduction (see [33] for a detailed description). The PLI calculates synchronization between time series based on the consistency with which one signal is leading or lagging with respect to another signal. It uses the asymmetry of the distribution of instantaneous phase differences between two signals, since a nonzero phase lag between these signals cannot be explained by volume conduction. The PLI ranges between 0 (no asymmetric phase distribution) and 1 (completely asymmetric phase distribu-tion), and has proven to be a useful measure of functional connectivity in several recent MEG studies in our department [14,15,34]. An index of the asymmetry of the phase distribution can be obtained from a time series of phase differences DW(tk),
k = 1 … Nsin the following way:
PLI~DSsign sin (½ DW(tk))TD,
where the phase difference is defined in the interval [-p,p],,.
denotes the mean value, Nsis the number of samples and tkis the
sample index. For each subject, the PLI was calculated between all MEG channels. The overall level of functional connectivity was then computed by averaging all PLI values over all channels. This overall PLI value was used to analyze correlations between the average level of connectivity and lesion pathology.
Graph analysis
We constructed weighted graphs, in which the edge weight represents the strength of the connection between the vertices. The MEG sensors were considered as vertices (nodes) and the PLI between sensors as edge weights. We calculated the most fundamental network measures, as described by Watts and Strogatz [11], namely the average weighted clustering coefficient Cw and average weighted shortest path length Lw [34]. The
unweighted clustering coefficient describes the likelihood that neighbours of a vertex are also connected, and it quantifies the tendency of network elements to form local clusters. We used the weighted equivalent of this measure to characterize local clustering.
For each vertex i, it is defined as:
Cw,i~
P k=i
P l=i l=k
wikwilwkl
P k=i
P l=i l=k
wikwil
,
where wikand wilis the weight between vertex i and vertices k and
l, respectively, and wklis the weight between vertices k and l. The
average weighted clustering coefficient is computed by averaging Cw,iover all vertices.
The average (weighted) shortest path length indicates the level of global integration of the network. In unweighted networks, it depends on the average number of edges used to connect any two vertices in the network [11]. The average weighted shortest path length (Lw) is defined as the harmonic mean of shortest paths
between all possible vertex pairs in the network, where the shortest path Lijbetween vertices i and j is defined as the path with the
largest total weight [34].
Lw~
1 1=N Nð {1Þ
ð ÞPN
i~1 PN j=i
1=Lij
,
withNthe number of vertices.
Network properties are determined not only by edge weights and network topology, but also by network size. In order to facilitate comparison of results with other studies, we compared the calculated Cw and Lw values to a reference, Cws and Lws,
derived from 1000 surrogate networks of the same size. The surrogate networks were constructed by randomly shuffling the edge weights over the network. The resulting Cw/Cwsand Lw/Lws
are thus the normalized average weighted clustering coefficient and normalized average weighted shortest path length of the network.
Modularity quantifies how a network can be optimally divided in subgroups or modules and was calculated as described by [35], modified for weighted networks by [36]:
Qwm~ Xm
s~1
Ws Wtotal { dw,s 2Wtotal 2# ,
where m is the number of modules, Wsis the sum of the weights of
all links in the module s, Wtotalis the total sum of all weights in the
network, and dw,sis the sum of the weighted degrees of the vertices
in module s.
Simulated annealing
The optimal way to divide the network into modules was then determined using a simulated annealing algorithm [35,36]. Simulated annealing is an optimization technique that can be used to find an optimal network configuration while considering a cost C. An optimal modularityQwm, which consists of the largest possible modules, is found for the configuration with the lowest cost C, which is therefore defined as-Qwm. Each ofNvertices was randomly assigned to one of m possible clusters, where the initial m was taken as the square of N. At each step one of the vertices was randomly chosen and assigned to a different random module number from the interval [1, N]. The new partitioning was preserved with probability:
p~ 1
e({Cf{TCi)
if CfƒCi
if CfwCi (
,
where Cf is the final cost and Ci is the initial cost, and the
temperature T describes to what extent the system allows the exploration of high-cost regions. The temperature T was initially set at 1, and was lowered every 100 steps with Tnew= 0.995 Told.
The simulated annealing algorithm ran for 106steps in total.
Within-module degree and participation coefficient We can describe the role of a vertex within a module by calculating its connectivity within that module. The within-module degree (zwi) was used to describe to what extend vertex i is connected to other vertices in the same module [37]. A highzwi
reflects a high within-module degree. The weighted within-module degree is defined as follows:
zw i~
kwi(mi){kkw(mi)
where miis the module containing node i, kwi(mi) is the within module degree of node i (the sum of all links between node i and all other nodes in module mi, and k
w
(mi) and skw(mi) are the respective mean and standard deviation of the within-module degree distribution.
We can also determine to what extend a vertex connects different modules, [37]. The participation coefficientPwi describes how the connections of vertex i are distributed among all modules. The participation coefficientPwi is defined as:
Pwi~1{ X
m[M
kwi(m) kwi
2
,
where M is the set of modules, kwi(m) is the sum of all links between node i and all other nodes in module m, andkwi is the sum of all links between i and all other nodes in the network. The
Pwi ranges from 0 to 1.
Between-module connectivity Pw for the whole network was
calculated by averaging allPw
i, which was used as a measure of connectivity between modules.
Network synchronizability
We calculated network synchronizability as measured by the eigenvalue ratio R = lN/l2 to characterize the stability of the
synchronous state [22]. For a detailed description we refer to [22], and [38]. In brief, we determined the spectrum of eigenvalues of the graph Laplacian L, which is the difference between the diagonal matrix of vertex degrees and the adjacency matrix. The eigenvalues are then ordered from largest to smallest, beingl1
= 0. Networks are more synchronizable when the eigenvalue ratio R is smaller [22]. In order to make results easier to interpret, we define synchronizability S = R21. The synchronizability S is higher for networks with a more stable synchronous state, and S ranges between 0 and 1.
Statistical analysis
All statistical analyses were performed using PASW 18.0 for Windows (SPSS Inc., Chicago, USA). A one-way ANOVA was performed to test for differences in age between groups. Pearson’s Chi square test was performed to test for differences in gender between groups. The PLI and network variables do not follow a normal distribution, hence Kruskal-Wallis tests were performed to explore differences concerning these variables between patients and healthy controls for each frequency band. We corrected for multiple testing using the false discovery rate (FDR) because we performed tests for 5 network characteristics. When a Kruskal-Wallis test showed significant results (p,0.05), post-host analysis was performed by means of Mann-Whitney U tests. Correlations with epilepsy characteristics and cognitive performance were calculated using Kendall’s tau tests.
Results
Subject characteristics
We included 35 patients (20 male; 13 LGG, 12 HGG, 10 NGL) and 36 healthy controls (18 male). Patient characteristics are shown in table 1. There was a difference in age between groups (F (3,67) = 6.59; p = 0.001); NGL patients were significantly younger than patients in the other groups. No significant differences in gender were found between groups (Pearson’s chi square = 5.49; p = 0.145). No significant differences regarding epilepsy duration and seizure frequency were found between LGG and HGG patients (Mann-Whitney U = 44.5; p = 0.069 and U = 64.5;
p = 0.473, respectively), although epilepsy duration tended to be longer in LGG patients. NGL patients had longer epilepsy duration than LGG (Mann-Whitney U = 12; p,0.001) and HGG patients (Mann-Whitney U = 5; p,0.001). Similarly, NGL patients had higher seizure frequency than LGG (Mann-Whitney U = 28,5; p = 0.022) and HGG patients (Mann-Whitney U = 17.5; p = 0.004). We found no group differences in the number of anti-epileptic drugs (AEDs) used (Pearson’s chi square = 5.90; p = 0.207).
Neuropsychological assessment
Cognitive test scores were available for 11 LGG and 10 HGG patients. Cognitive data for NGL patients were available for only 2 patients due to different test paradigms in other patients, and we therefore excluded this group from further analysis. Cognitive performance z-scores based on healthy controls matched for age, gender and educational level are given in table 1. No significant differences in cognitive performance were found between LGG and HGG patients.
Lesion pathology and functional connectivity
No significant differences were found between any of the patient groups and healthy controls regarding overall PLI level. A non-significant trend was found of higher overall PLI in the theta band in LGG patients compared to HGG patients (Mann Whitney U = 44.5; p = 0.068).
Lesion pathology and network characteristics
Kruskal Wallis tests showed that lesion type had a significant effect on normalized weighted clustering coefficient (Cw/Cws),
normalized average weighted path length (Lw/Lws),
synchroniz-ability (S), modularity (Qwm) and between-module connectivity (Pw)
in the theta band (Table 2; Figure 1 and 2). Analysis for other frequency bands showed no significant differences between groups. Post-hoc analyses were performed to reveal how the groups differed on these theta band parameters (Table S1). Normalized average weighted clustering was higher in LGG than in healthy controls and HGG patients. Also, LGG patients had lower between-module connectivity than healthy controls, HGG and NGL patients. NGL patients showed higher theta band normal-ized weighted path length than healthy controls and HGG patients, as well as higher modularity than healthy controls. We found no difference between HGG patients and healthy controls regarding network characteristics.
The number of modules ranged between 5 and 10 for all subjects depending on frequency band, and showed no significant differences between patients and controls (Table S2). Upper alpha band normalized average weighted clustering coefficient (Ken-dall’s tau =20.214; p = 0.009) and normalized weighted shortest path length (Kendall’s tau = 20.184; p = 0.024) were found to be negatively correlated with age, but we found no significant correlations between age and theta band network characteristics.
As is shown in figure 1, the findings suggest that differences between patient groups regarding network characteristics may be (partly) explained by differences in average PLI levels. We therefore analyzed possible correlations between PLI and theta band Cw/Cws, Lw/Lws, and Pw(Table S3). Theta band Cw/Cws
and Lw/Lwswere indeed positively correlated to theta band PLI,
whereas a negative correlation was found between Pw and theta
Epilepsy, cognition and network characteristics
Post-hoc analysis was performed on network characteristics in the theta band. Higher seizure frequency was associated with lower synchronizability (Kendall’s tau = 20.448; p = 0.036) in LGG patients, but not in HGG patients (Kendall’s tau = 0.048; p = 0.833) or NGL patients (Kendall’s tau = 0.000; p = 1.000) (Figure 3).
Average cognitive test scores correlated positively with theta band synchronizability (Kendall’s tau = 0.661; p = 0.005) in LGG patients, but not in HGG patients (Kendall’s tau = 0.200; p = 0.421). Further analysis showed that in LGG patients, theta band synchronizability correlated positively with attention (Stroop test) and executive functioning (verbal fluency test) (Kendall’s tau = 0.697; p = 0.003 and Kendall’s tau = 0.559; p = 0.020, respec-tively; Figure 4). Executive functioning was also negatively correlated with normalized average weighted clustering coeffi-cients (Kendall’s tau = 20.544; p = 0.025), while verbal memory (visual verbal learning test) was positively correlated with modularity (Kendall’s tau = 0.477; p = 0.042) in LGG patients. In HGG patients, we found that higher between-module
connectivity correlated positively with better attention test scores (Kendall’s tau = 0.511; p = 0.040).
We found correlations between several theta band network parameters and both cognitive performance and seizure frequency in LGG patients, and it may therefore be that these clinical parameters are also correlated. We calculated the correlation between seizure frequency and cognitive performance in LGG patients and found a non-significant negative trend (Kendall’s tau = 20.419; p = 0.081).
Discussion
Our study is the first to show that LGG patients have different neural network characteristics compared to HGG patients (table 3). Functional networks in LGG patients show theta band alterations similar to lesional epilepsy patients with non-glial lesions, while networks in HGG patients are more similar to those in healthy controls. Interestingly, we found topological network differences but no significant differences in general connectivity levels.
We observed increased normalized theta band path lengths in NGL patients. In contrast, two previous functional MRI studies found smaller normalized average path lengths and lower Table 1.Patient characteristics.
Characteristic LGG HGG non-Glioma Controls
N 13 12 10 36
Age (years) 44.1 (6SD 9.7) 50.3 (6SD 11.5) 30.1 (6SD 6.8) 43.9 (6SD 11.9)
Gender
Male 6 10 4 18
Female 7 2 6 18
Lesion type Grade II: 13 Grade III: 4 DNET: 3
Grade IV: 8 MTS: 4
HEM: 1
HAM: 1
DYS: 1
Lateralization (lesion)
Left 5 3 6
Right 8 9 4
Seizure frequency 8.2 (6SD 9.9) 17.4 (6SD 43.6) 28.9 (6SD 31.1)
Epilepsy duration 44 (6SD 64) 20 (6SD 39) 228 (6SD 141)
Seizure type
Part. simple 4 2 1
Part. complex 0 0 2
(Sec.) Generalized 9 10 7
AED use
None 2 0 0
Single AED 5 9 4
Multiple AEDs 6 3 6
Cognitive performance 20.5 (6SD 1.1) 20.2 (6SD 0.8)
Attention 21.1 (6SD 1.8) 20.5 (6SD 1.1)
Executive functioning 21.2 (6SD 1.1) 21.0 (6SD 0.8)
Verbal memory 0.0 (6SD 0.9) 0.0 (6SD 0.7)
Seizure frequency is given per month; Epilepsy history is defined as months passed since first seizure. Cognitive performance scores are presented as z-scores based on individual matched healthy controls. Also, cognitive performance is presented of the domains attention (Stroop test), executive functioning (Verbal Fluency test) and verbal memory (Visual Verbal Learning test). Abbreviations: AED = anti-epileptic drug; DNET = Dysembryoplastic Neoepithelial Tumor; MTS = Mesiotemporal Sclerosis; HEM = Hematoma; HAM = Hamartoma; DYS = Dysplasia.
clustering coefficients in localization-related (non-glioma) epilepsy patients compared to healthy controls [17,39]. Another MEG study did not find any consistent network differences between NGL patients with epilepsy and healthy controls [40]. As was shown in the current study, differences in lesion pathology between the patient populations in these studies may partially explain these contradictory findings, as well as effects of anti-epileptic drug use and duration of disease [16].
Previous MEG studies comparing functional networks in post-operative glioma patients to those in healthy controls also reported contradicting findings (summarized in table 3). It is important to note here that these studies, especially when reporting on network analysis, were performed after surgical intervention, which has been shown to affect (theta band) connectivity patterns [20]. Patient heterogeneity as well as differences in (network) analysis approaches between these MEG studies and the current study make it even harder to compare results. Some of those previous studies used the synchronization likelihood (SL) as a measure of functional connectivity, which is less conservative than the PLI used in our study, or performed unweighted network analysis. It may thus be that previous studies revealed different aspects of functional network organization in different stages of disease and treatment, rather than being contradictory.
We found the aforementioned differences between LGG and HGG patients in the theta band, while average PLI levels showed a non-significant trend towards higher PLI in LGG patients. The network characteristics were significantly correlated to the overall PLI, even after normalization using random networks of the same size. The possibly higher PLI levels in LGG patients may therefore partly explain the observed differences in network measures. There is currently no optimal method of network construction from functional connectivity matrices that is completely free from biases [41]. The purpose of this study was to find sensitive measures based on functional connectivity between brain areas to differentiate between LGG and HGG patients. We therefore suggest that the network parameters presented here are of additional value compared to the calculation of overall PLI only, and may also provide additional information about the type of connections that are strengthened in LGG patients.
It is hypothesized that plasticity is guided by the particular lesional growth pattern [29]. A recent computational modeling study allowing both growth- and synchronization-dependent plasticity showed that acute lesioning of functional networks leads to increased local clustering levels [36]. Although the model only considered an acute lesion which limits comparability with our study, this is consistent with the increased clustering that we found in LGG patients. However, we found no network differences between HGG patients and healthy controls. A possible explana-tion is that it might take time before plasticity effects become evident on a global scale, and HGG patients tended to have shorter time between first symptoms and MEG recordings [29]. In the model of Stam and others, however, increased path lengths and decreased modularity were particularly found directly after emergence of the lesion, subsequently normalizing over time [36]. Alternatively, our results may also have been affected by epilepsy characteristics and use of AEDs [15,16,17]. Patient groups in our study were relatively small to analyze within group correlations between epilepsy and network characteristics, but we did find a correlation between network synchronizability and seizure fre-quency in LGG patients. It would be interesting to compare glioma patients with and without epilepsy, and find possible differences in the functional networks of these patients. However, since we found no significant differences between LGG and HGG patients regarding epilepsy duration, seizure frequency and AED use, we consider it unlikely these characteristics would explain differences between these groups.
We found decreased theta band synchronizability, defined as the stability of the synchronous state, in both LGG and NGL patients, and found that lower synchronizability correlated with higher seizure frequency and poorer attention test-scores in LGG patients. Although extremely interesting, these results should be interpreted with caution, as synchronizability was characterized as the stability of the synchronous state, where others use the same terminology to characterize the threshold value of a network for global synchronization [24]. Schindler and others showed that at seizure onset, synchronizability decreases, and increases again at seizure termination [23]. These changes coincided with increased clustering coefficients and path lengths. We suggest that modeling studies on the interaction between network structure and dynamics during seizures are needed to clarify the exact meaning of our observed correlations. The existence of hub nodes with a pathologically increased central role should also be taken into account, as this may be crucial for spreading of epileptic synchronized activity over the network [24,42,43,44,45]. Future work in which MEG functional networks may be reconstructed in source space is crucial in this respect, which would also allow the identification of anatomical correlates of these pathological hubs, and would increase comparability between subjects [17,40,46,47,48].
Our findings suggest that in glioma patients a modular brain organization, less local clustering, higher stability of the synchro-nized state and high between-module connectivity favor cognitive performance. A previous study using post-operative MEG recordings in LGG patients showed that a shorter path length in the delta band was related to better performance in the attention and executive functioning domain, while less local clustering in the lower alpha band was related to better verbal memory test scores, in line with our results [14]. However, another previous study in healthy controls showed an opposite correlation of better attention, working memory and processing speed performance in subjects with higher theta band clustering coefficients [9]. Although that study found correlations with different cognitive domains as compared to our study, and, moreover, healthy Table 2.Differences between patients and healthy controls
regarding theta band network characteristics.
Measure LGG HGG NGL Controls p-value
PLI 0.146 0.133 0.136 0.136 0.216
Cw/Cws 1.072q 1.058 1.066 1.058 *0.019
Lw/Lws 1.105 1.084 1.101q 1.087 *0.023
S 0.343Q 0.374 0.355Q 0.367 *0.009
Qmw 0.071 0.072 0.075q 0.070 *0.025
Pw 0.727Q 0.750 0.745 0.756 *0.005
Results are given as mean values of network characterstics and p-values of Kruskall-Wallis tests. P-values were considered significant for (p,0.05) after correction using the false discovery rate. Note that the within-module degree z-score (not shown) did not differ significantly.
Results are marked (qorQ) when significantly different from other groups based on post-hoc analyses using Mann-Whitney U tests. Significance levels are given in table S1.
Abbreviations: NGL = non-glial lesion; LGG = low-grade glioma; HGG = high-grade glioma; PLI = phase lag index; Cw/Cws = normalized average weighted clustering coefficient; Lw/Lws= normalized average weighted shortest path length; S = synchronizability;Qwm = modularity; Pw= between-module connectivity.
subjects instead of brain tumor patients were studied, these findings appear to be contradicting ours. Several other studies have been performed in healthy controls. The most consistent finding seems to be that of a correlation between shorter path
lengths and better memory performance or higher intelligence, as this has been established in DTI, MRI and MEG studies [9,49,50]. However, an EEG study showed that people with lower education have networks with higher small-world charac-Figure 1. Theta band PLI and network characteristics for patients and healthy controls.Parameters were averaged for each sensor on a group level and displayed on a helmet-shaped surface to show global patterns of differences between patient groups. Note that particularly in LGG patients, theta band clustering and participation coefficients show global alterations irrespective of local PLI values. Abbreviations: CTL = healthy controls; LGG = low-grade glioma patients; HGG = high-grade glioma patients; NGL = non-glioma patients; PLI = phase lag index; Cw,i* = nodal clustering coefficient; Lw,i* = nodal path length; zwi = within-module degree z-score; Pwi = participation coefficient. *In the analysis we use
normalized average weighted clustering coefficient (Cw/Cws) and normalized average weighted shortest path length (Lw/Lws) instead of the unnormalized
values for each vertex i, Cw,iand Lw,iwhich are visualized here. Cw/Cwsand Lw/Lwsare calculated by first averaging over nodes and then dividing Cwand Lw
by a reference value Cwsand Lws, in order to get normalized values. However, this normalization does not affect the spatial distribution of Cw,iand Lw,i, and
teristics during a memory task compared to higher educated subjects [51]. This may be interpreted as a reflection of the bigger effort made by subjects with lower education to deliver an equal performance as the subjects with higher education on the task. In general, it could be hypothesized that a small-world topology may be the optimal resting-state organization of healthy brain networks, but that this is not automatically the case for networks in the damaged brain. It could also be that other network characteristics of network topology, such as hierarchical
modular-ity, need to be taken into account in order to capture all the complex interactions between network topology and cognitive performance [52].
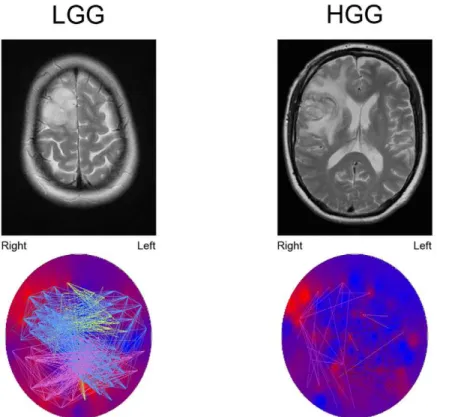
The studied domains (attention, executive functioning and verbal memory) specifically require global integration of informa-tion. We speculate that modularity and between-module connec-tivity reflect the facilitation of functional communication. Inter-estingly, we observed correlations between these network Figure 2. Example of theta band connection differences between a LGG patient and a HGG patient, both suffering from a tumor located in the right frontal lobe.The upper images show T2-weighted MRI images of the tumor. The lower images show theta band PLI levels (background colors; red colors represent high PLI levels, blue colors represent low PLI levels). Note that the tumor region seems to have the highest theta band PLI. The colored lines represent connections between sensors, each color representing another module. Connections are shown when their strength passes an arbitrary threshold chosen for optimal connection visualization. In HGG patients, only few connections exist above the threshold. Note that especially connections to the tumor region in LGG patients pass the threshold. However, two other modules are also clearly shown that are not found in the HGG patient, suggesting that the differences between LGG and HGG patients networks are not restricted to the tumor region.
doi:10.1371/journal.pone.0050122.g002
Figure 3. Theta band synchronizability and seizure frequency in low grade glioma patients.Note that seizure frequency is plotted on a logarithmic scale. See tables S4 and S5 for seizure frequency and synchronizability values for each patient.
doi:10.1371/journal.pone.0050122.g003
Figure 4. Theta band synchronizability and attention as measured by Stroop tests.Attention scores are presented as z-scores gained by comparison with healthy controls matched for age, gender and educational level. See table S4 for attention scores and synchronizability values for each patient.
parameters and cognition in the same frequency range, the theta band, as where we observed network differences between LGG patients and healthy controls. The network alterations therefore seem to reflect the less optimal communication within the brain that leads to the impaired cognitive performance in patients with brain lesions. Other cognitive deficits in these patients may also be expected, but no standardized test scores were available in the current study.
We found a non-significant trend towards a negative correlation between epilepsy frequency and cognitive performance. Epilepsy itself can lead to cognitive deficits in brain tumor patients [53]. It might thus be that the network characteristics that we found in these patients are related to either one of these symptoms. Another hypothesis is that the network characteristics may contain information about how recurrent seizures lead to cognitive deficits. The non-parametric distribution of the parameters synchroniz-ability and seizure frequency and the relatively small sample size make the current dataset unsuitable for a regression analysis to clarify these interactions more thoroughly. Also, We corrected for multiple testing per frequency band, as the connectivity matrices provide different information for each frequency band. We performed a Kruskall Wallis test in order to find possible differences regarding any of the metrics, and post-hoc analysis were performed to further interpret results. We suggest that stronger statistical correction would lead to an underestimation of possible group differences and correlations. We note that a correction for multiple testing is not commonly performed for
multiple network measures, or average connectivity per frequency band [17,40,48].
In conclusion, this study shows that theta band functional networks based on MEG recordings differ in epileptic glioma patients depending on histopathology of the lesion. Lesion type effects are more explicitly seen in LGG and NGL (e.g. MTS) patients when compared to HGG patients, possibly due to plasticity effects that alter brain networks over time. Interestingly, seizure frequency and cognitive decline also correlate with these network alterations. Future studies with larger patient groups should elucidate in more detail the interactions between these clinical characteristics, plasticity and network topology.
Supporting Information
Table S1 Network differences between patients and healthy controls.
(DOC)
Table S2 Overview of modularity analysis of patient groups and healthy controls.
(DOC)
Table S3 Correlations between PLI and several network characteristics in the theta band for all subjects.
(DOC)
Table S4 Theta band synchronizability values.
(DOC)
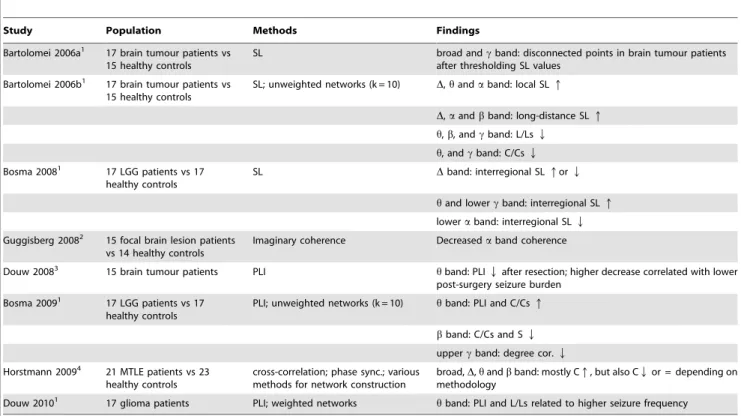
Table 3.Overview of MEG functional connectivity studies on lesional epilepsy patients.
Study Population Methods Findings
Bartolomei 2006a1 17 brain tumour patients vs 15 healthy controls
SL broad andcband: disconnected points in brain tumour patients after thresholding SL values
Bartolomei 2006b1 17 brain tumour patients vs 15 healthy controls
SL; unweighted networks (k = 10) D,handaband: local SLq
D,aandbband: long-distance SLq
h,b, andcband: L/LsQ
h, andcband: C/CsQ
Bosma 20081 17 LGG patients vs 17 healthy controls
SL Dband: interregional SLqorQ
hand lowercband: interregional SLq
loweraband: interregional SLQ
Guggisberg 20082 15 focal brain lesion patients vs 14 healthy controls
Imaginary coherence Decreasedaband coherence
Douw 20083 15 brain tumour patients PLI hband: PLIQafter resection; higher decrease correlated with lower post-surgery seizure burden
Bosma 20091 17 LGG patients vs 17 healthy controls
PLI; unweighted networks (k = 10) hband: PLI and C/Csq
bband: C/Cs and SQ
uppercband: degree cor.Q
Horstmann 20094 21 MTLE patients vs 23 healthy controls
cross-correlation; phase sync.; various methods for network construction
broad,D,handbband: mostly Cq, but also CQor = depending on methodology
Douw 20101 17 glioma patients PLI; weighted networks
hband: PLI and L/Ls related to higher seizure frequency
Overview of functional connectivity and network studies based on MEG recordings in brain tumour and TLE patients. The measure for functional connectivity used in the study is given in the Methods column. Abbreviations: SL = Synchronization Likelihood; PLI = Phase Lag Index; L/Ls = normalized average path length; C/Cs = normalized average clustering coefficient; degree cor. = degree correlation (measure for the tendency of vertices to connect to other vertices with a similar degree). 1MEG recordings used in these studies were obtained after surgery, which might also have had an impact on functional connectivity levels and network topology. 2No information available on epilepsy incidence in these patients.
3This study did not compare patients to healthy controls, but compared MEG recordings of patients before and after resection of the brain tumour. 4This study analyzed patients with non-glial lesions, and should therefore be considered only as a reference for patients with NGL in the present study.
Table S5 Values of attention z-scores, seizure frequency (per month) and synchronizability in LGG patients that were used to construct figures 3 and 4.
(DOC)
Acknowledgments
The authors thank G.W.G.A de Vos and the MEG technicians of the Department of Clinical Neurophysiology, P.J. Ris, K. Plugge, N. Sijsma and S. Oudkerk, for technical assistance.
Author Contributions
Conceived and designed the experiments: EvD LD AH MMS JJH CJS JCR MK. Performed the experiments: EvD LD AH IRH MMS. Analyzed the data: EvD LD AH IRH MMS JCB PDWH MK CJS JCR. Contributed reagents/materials/analysis tools: EvD LD AH MK CJS. Wrote the paper: EvD LD AH IRH MMS JCB PDWH DNV MK JJH CJS JCR.
References
1. Behin A, Hoang-Xuan K, Carpentier AF, Delattre JY (2003) Primary brain tumours in adults. Lancet 361: 323–331.
2. Brogna C, Gil Robles S, Duffau H (2008) Brain tumors and epilepsy. Expert Rev Neurother 8: 941–955.
3. Heimans JJ, Reijneveld JC (2012) Factors affecting the cerebral network in brain tumor patients. J Neurooncol.
4. Bartolomei F, Bosma I, Klein M, Baayen JC, Reijneveld JC, et al. (2006) Disturbed functional connectivity in brain tumour patients: evaluation by graph analysis of synchronization matrices. ClinNeurophysiol 117: 2039–2049. 5. Bartolomei F, Bosma I, Klein M, Baayen JC, Reijneveld JC, et al. (2006) How
do brain tumors alter functional connectivity? A magnetoencephalography study. AnnNeurol 59: 128–138.
6. Stam CJ (2010) Characterization of anatomical and functional connectivity in the brain: a complex networks perspective. Int J Psychophysiol 77: 186–194. 7. Bullmore E, Sporns O (2009) Complex brain networks: graph theoretical
analysis of structural and functional systems. Nat Rev Neurosci 10: 186–198. 8. Reijneveld JC, Ponten SC, Berendse HW, Stam CJ (2007) The application of
graph theoretical analysis to complex networks in the brain. ClinNeurophysiol 118: 2317–2331.
9. Douw L, Schoonheim MM, Landi D, van der Meer ML, Geurts JJ, et al. (2011) Cognition is related to resting-state small-world network topology: an magnetoencephalographic study. Neuroscience 175: 169–177.
10. Bassett DS, Bullmore E (2006) Small-world brain networks. Neuroscientist 12: 512–523.
11. Watts DJ, Strogatz SH (1998) Collective dynamics of ‘small-world’ networks. Nature 393: 440–442.
12. Ponten SC, Bartolomei F, Stam CJ (2007) Small-world networks and epilepsy: graph theoretical analysis of intracerebrally recorded mesial temporal lobe seizures. ClinNeurophysiol 118: 918–927.
13. Stam CJ, Reijneveld JC (2007) Graph theoretical analysis of complex networks in the brain. NonlinearBiomedPhys 1: 3.
14. Bosma I, Reijneveld JC, Klein M, Douw L, van Dijk BW, et al. (2009) Disturbed functional brain networks and neurocognitive function in low-grade glioma patients: a graph theoretical analysis of resting-state MEG. Nonlinear Biomed Phys 3: 9.
15. Douw L, Van Dellen E, De Groot M, Heimans JJS, C.J., Reijneveld JC (2010) Epilepsy is related to theta band brain connectivity and network topology in brain tumor patients. BMC Neuroscience 11.
16. van Dellen E, Douw L, Baayen JC, Heimans JJ, Ponten SC, et al. (2009) Long-term effects of temporal lobe epilepsy on local neural networks: a graph theoretical analysis of corticography recordings. PLoS One 4: e8081. 17. Vlooswijk MC, Vaessen MJ, Jansen JF, de Krom MC, Majoie HJ, et al. (2011)
Loss of network efficiency associated with cognitive decline in chronic epilepsy. Neurology.
18. Douw L, de Groot M, van Dellen E, Heimans JJ, Ronner HE, et al. (2010) ’Functional connectivity’ is a sensitive predictor of epilepsy diagnosis after the first seizure. PLoS One 5: e10839.
19. Ponten SC, Douw L, Bartolomei F, Reijneveld JC, Stam CJ (2009) Indications for network regularization during absence seizures: Weighted and unweighted graph theoretical analyses. Exp Neurol.
20. Douw L, Baayen H, Bosma I, Klein M, Vandertop P, et al. (2008) Treatment-related changes in functional connectivity in brain tumor patients: A magnetoencephalography study. ExpNeurol 212: 285–290.
21. Smit DJ, Boersma M, van Beijsterveldt CE, Posthuma D, Boomsma DI, et al. (2009) Endophenotypes in a dynamically connected brain. Behav Genet 40: 167–177.
22. Barahona M, Pecora LM (2002) Synchronization in small-world systems. PhysRevLett 89: 054101.
23. Schindler KA, Bialonski S, Horstmann MT, Elger CE, Lehnertz K (2008) Evolving functional network properties and synchronizability during human epileptic seizures. Chaos 18: 033119.
24. Arenas A, DA˜ -az-Guilera A, Kurths J, Moreno Y, Zhou C (2008) Synchronization in complex networks. Physics Reports 469: 93–153. 25. Meunier D, Achard S, Morcom A, Bullmore E (2009) Age-related changes in
modular organization of human brain functional networks. Neuroimage 44: 715–723.
26. Meunier D, Lambiotte R, Fornito A, Ersche KD, Bullmore ET (2009) Hierarchical modularity in human brain functional networks. Front Neuroinfor-matics 3: 37.
27. Bassett DS, Wymbs NF, Porter MA, Mucha PJ, Carlson JM, et al. (2011) Dynamic reconfiguration of human brain networks during learning. Proc Natl Acad Sci U S A 108: 7641–7646.
28. Chavez M, Valencia M, Navarro V, Latora V, Martinerie J (2009) Functional modularity of background activities in normal and epileptic brain networks. http://arxivorg/abs/08113131v3.
29. Desmurget M, Bonnetblanc F, Duffau H (2007) Contrasting acute and slow-growing lesions: a new door to brain plasticity. Brain 130: 898–914. 30. Jolles J, van Boxtel MP, Ponds RW, Metsemakers JF, Houx PJ (1998) [The
Maastricht aging study (MAAS). The longitudinal perspective of cognitive aging]. Tijdschr Gerontol Geriatr 29: 120–129.
31. Klein M, Heimans JJ, Aaronson NK, van der Ploeg HM, Grit J, et al. (2002) Effect of radiotherapy and other treatment-related factors on mid-term to long-term cognitive sequelae in low-grade gliomas: a comparative study. Lancet 360: 1361–1368.
32. Stam CJ, Jones BF, Manshanden I, van Cappellen van Walsum AM, Montez T, et al. (2006) Magnetoencephalographic evaluation of resting-state functional connectivity in Alzheimer’s disease. Neuroimage 32: 1335–1344.
33. Stam CJ, Nolte G, Daffertshofer A (2007) Phase lag index: assessment of functional connectivity from multi channel EEG and MEG with diminished bias from common sources. HumBrain Mapp 28: 1178–1193.
34. Stam CJ, de Haan W, Daffertshofer A, Jones BF, Manshanden I, et al. (2009) Graph theoretical analysis of magnetoencephalographic functional connectivity in Alzheimer’s disease. Brain 132: 213–224.
35. Guimera R, Mossa S, Turtschi A, Amaral LA (2005) The worldwide air transportation network: Anomalous centrality, community structure, and cities’ global roles. Proc Natl Acad Sci U S A 102: 7794–7799.
36. Stam CJ, Hillebrand A, Wang H, Van Mieghem P (2010) Emergence of Modular Structure in a Large-Scale Brain Network with Interactions between Dynamics and Connectivity. Front Comput Neurosci 4.
37. de Haan W, van der Flier WM, Koene T, Smits LL, Scheltens P, et al. (2012) Disrupted modular brain dynamics reflect cognitive dysfunction in Alzheimer’s disease. Neuroimage 59: 3085–3093.
38. Boccaletti S, latora V, Moreno Y, Chavez M, Hwang DU (2006) Complex Networks: Structure and dynamics. Physics reports: 175–308.
39. Liao W, Zhang Z, Pan Z, Mantini D, Ding J, et al. (2010) Altered functional connectivity and small-world in mesial temporal lobe epilepsy. PLoS One 5: e8525.
40. Horstmann MT, Bialonski S, Noennig N, Mai H, Prusseit J, et al. (2010) State dependent properties of epileptic brain networks: Comparative graph-theoretical analyses of simultaneously recorded EEG and MEG. Clin Neurophysiol 121: 172–185.
41. van Wijk BC, Stam CJ, Daffertshofer A (2010) Comparing brain networks of different size and connectivity density using graph theory. PLoS One 5: e13701. 42. Morgan RJ, Soltesz I (2008) Nonrandom connectivity of the epileptic dentate gyrus predicts a major role for neuronal hubs in seizures. ProcNatlAcadSciUSA 105: 6179–6184.
43. Bonifazi P, Goldin M, Picardo MA, Jorquera I, Cattani A, et al. (2009) GABAergic hub neurons orchestrate synchrony in developing hippocampal networks. Science 326: 1419–1424.
44. Ortega GJ, Menendez de la PL, Sola RG, Pastor J (2008) Synchronization clusters of interictal activity in the lateral temporal cortex of epileptic patients: intraoperative electrocorticographic analysis. Epilepsia 49: 269–280. 45. Wilke C, Worrell G, He B (2010) Graph analysis of epileptogenic networks in
human partial epilepsy. Epilepsia 52: 84–93.
46. Hillebrand A, Barnes GR, Bosboom JL, Berendse HW, Stam CJ (2012) Frequency-dependent functional connectivity within resting-state networks: an atlas-based MEG beamformer solution. Neuroimage 59: 3909–3921. 47. Ioannides AA (2007) Dynamic functional connectivity. Curr Opin Neurobiol 17:
161–170.
48. Martino J, Honma SM, Findlay AM, Guggisberg AG, Owen JP, et al. (2011) Resting functional connectivity in patients with brain tumors in eloquent areas. Ann Neurol 69: 521–532.
50. van den Heuvel MP, Stam CJ, Kahn RS, Hulshoff Pol HE (2009) Efficiency of functional brain networks and intellectual performance. J Neurosci 29: 7619– 7624.
51. Micheloyannis S, Pachou E, Stam CJ, Breakspear M, Bitsios P, et al. (2006) Small-world networks and disturbed functional connectivity in schizophrenia. SchizophrRes 87: 60–66.
52. Stam CJ, van Straaten EC (2012) The organization of physiological brain networks. Clin Neurophysiol.