Classifier Ensembling
NAWAZISH NAVEED*, MUHAMMAD ARFAN JAFFAR*, AND FAISAL KARIM SHAIKH**
RECEIVED ON 18.03.2011 ACCEPTED ON 07.06.2011
ABSTRACT
The breast cancer detection and diagnosis is a critical and complex procedure that demands high degree of accuracy. In computer aided diagnostic systems, the breast cancer detection is a two stage procedure. First, to classify the malignant and benign mammograms, while in second stage, the type of abnormality is detected. In this paper, we have developed a novel architecture to enhance the classification of malignant and benign mammograms using multi-classification of malignant mammograms into six abnormality classes. DWT (Discrete Wavelet Transformation) features are extracted from preprocessed images and passed through different classifiers. To improve accuracy, results generated by various classifiers are ensembled. The genetic algorithm is used to find optimal weights rather than assigning weights to the results of classifiers on the basis of heuristics. The mammograms declared as malignant by ensemble classifiers are divided into six classes. The ensemble classifiers are further used for multi-classification using one-against-all technique for multi-classification. The output of all ensemble classifiers is combined by product, median and mean rule. It has been observed that the accuracy of classification of abnormalities is more than 97% in case of mean rule. The Mammographic Image Analysis Society dataset is used for experimentation.
Key Words: Breast Cancer, Mammogram, Support Vector Machine, Discrete Wavelet Transforms, Ensemble Classifier.
* National University of Computer & Emerging Sciences, Islamabad, Pakistan.
* * Assistant Professor, Department of Telecommunication Engineering, Mehran University of Engineering & Technology, Jamshoro.
1.
INTRODUCTION
G
lobally among cancers, the breast cancer is the most common in women. According to American National Cancer Institute the new breast cancer cases in USA for the year 2008 is around 179600 while the deaths were more than 40,700 [1]. The statistics claims that breast cancer held the second position of appearance in diagnosed new cases followed by prostate cancer comparing to other forms of cancer. Over the past decades it has become alarming that breast cancer incidence rates are increasing steadily. However,causes high penalty in the form of biopsy. Image interpretation of mammograms can be improved using computational advancements. Many computer-aided systems are proposed to improve the accuracy of interpretation. Many researchers had worked on the abnormalities of breast cancer. A few of them address calcification, some talked about masses (like circumscribed lesion, stellate lesion etc) in breast, Cheng, H., et. al. [4] depict only asymmetry because of breast cancer but nobody has taken all these abnormalities of cancer as a complete problem. This paper proposes a novel approach in which efficient classification methods for detection of breast cancer abnormalities is used. The main complexity about digital mammogram diagnosis is the detection of malignant images and its classification on the basis of abnormalities present. This paper investigates the accuracy of a detection methodology that uses DWT features as an input to different classifiers, i.e. ANN (Artificial Neural Networks), SVM (Support Vector Machine), KNN (K Nearest Neighbor), Bayesian and ensemble the results generated by these classifiers. Next, the malignant images are passed through a bank of these ensemble classifiers which are again trained for classification of different abnormalities. The one-against-all approach is used for multi-classification. Each ensemble classifier is trained for one abnormality. It assigns probability to the abnormality for which it is trained. Median, mean and product rules are used to combine the result of binary classifiers. A very efficient technique for pre-processing the mammograms is used, Jaffar, M.A., et. al. [5] which involves the automatic cropping of the mammograms, extracting breast region and remove other spots which are not part of breast. The proposed technique is fully automatic and very robust. The resultant accuracy is enhanced using ensembling of classifiers. The strong automatic abnormality detection method is proposed. The one-against-all approach is efficiently used for multi-classification. DWT features are used for classification. Different rules for combining the results of ensemble classifiers experimented to enhance the probability of selection of exact class. There
exist different techniques like majority voting, weighted majority voting, min, max, product and median rule. We have compared the min, product and median rule. The median rule provides better results. This is a supervised method for diagnosing breast cancer. The most important and novel work done in this paper is use of DWT features and ensembling of classifiers to achieve good accuracy for the classification of mammograms as malignant and benign. The remainder of paper is organized as follows: Section 2 discusses the related work. Section 3 describes the proposed architecture. Section 4 presents the experimental results followed by the conclusions and future work in Section 5.
2.
RELATED WORK
distortion whereas, Matsubara, T., et. al. [10] mathematical
morphology is used. Kom, G., et. al. [11] introduced an algorithm for detection of suspicious masses in mammographic images that shows a sensitivity of 95.91% for mass detection with ROC area of 0.946. Eltonsy, N., et. al. [7] presented an automatic computational tool for mass detection. Miller, P., et. al. [12] bilateral asymmetry is addressed by measuring brightness and shape in the fibroglandular disk. Campanini, R., et. al. [13] presented an approach for detection of masses in digital mammograms that reach sensitivity around 80.
3.
THE PROPOSED ARCHITECTURE
The proposed architecture presents a CAD system for breast cancer detection, its stage and type of abnormality in mammograms. The digital mammogram images are taken as input and passed through the system. The system identifies malignant mammograms and also mentions the type of abnormality in it. The whole system is divided into six major blocks namely pre-processing, feature extraction, ensembling of classifiers, malignancy detection, abnormality type detection and combination of performance of classifiers (one-against-all approach). The complete system is depicted in Fig. 1. In first block, image of a mammogram is input to the system for pre-processing. Four simple steps lead to feature extraction from an image. These four steps are noise removal, background removal, image enhancement and pectoral muscle removal. The feature extraction is done using DWT. The technique is made time efficient by dimension reduction using PCA. Using DWT features, the classification accuracy of ensemble classifier wins from all other presented techniques. The abnormality type of malignant mammogram is also detected. For multi-classification of images the ensemble classifier is used using one-against-all approach. This block shows the novelty of the architecture because it has been observed in literature that nobody presented a single algorithm which can identify all types of abnormalities. However,
the techniques for detection of any single abnormality at a time are presented. The last block discusses how to combine the results of all these parallel binary classifiers.
3.1
The Preprocessing Block
The pre-processing plays an important role in any CAD
system. It minimizes the computational cost and also
finds the ROI (Region Of Interest). In breast imaging pre-processing is very necessary, since the parts which are
not part of breast can misguide the classification phase. The procedure of noise removal using fuzzy filter,
Hussain, A., et. al. [14], background removal and pectoral muscle detection is discussed Jaffar, M.A., et. al. [5].
Only the histogram equalization method for image enhancement discussed Jaffar, M.A., et. al. [5] is replaced
with retinex method, Rahman, Z., et. al. [15] because
sometimes when histogram of image is tilted toward one side, histogram equalization method does not perform
well. The retinex is an image enhancement technique which tries to model the scene at a constant light. This
enhancement is very important for the visibility of image properties. The image is formed of two components
illumination and reflectance, i.e.
S(x; y) = R(x; y):L(x; y)
where R(x,y) and L(x,y) are reflectance and illumination
parts respectively.
If we subtract the illumination part from the image, then we can see it at a constant light. By using retinex the dark
portion of the image is enhanced and bright portion is suppressed, so that details are more visible. By taking log,
reflectance and illumination parts are separated out so that we can easily subtract illumination part from original
image. By taking exponent of this difference, we will get
the reflectance image.
Retinex is full scale automatic contrast enhancement technique that enhances the blur and degraded image non-linearly and provide good results for mammogram images. The visual results of complete preprocessing phase are given in the Fig. 2.
3.2
The Feature Extraction Block
The feature extraction plays a critical role in the performance of any classifier. Different techniques can be used such as gabor features, Eltonsy, N., et. al. [7], DWT, PCA (Principal Component Analysis) and spectral mixture analysis for feature extraction. We have used DWT features for our proposed architecture due to its easy
implementation. The dimensionality reduction is process of elimination of closely related data with other data items in a set, as a result a smaller set of features is generated which preserves all the properties of the original large data set. Commonly used dimensionality reduction techniques are PCA, DCT (Discrete Cosine Transformation), DWT and Random Projection. In our system we have applied DWT and PCA for dimensionality reduction. The CWT (Continuous Wavelet Transform) for square-integral and continuous function f(x) comparative to the real valued wavelet Ψ(x) is defined as:
WΨ
b g
p q, = f xb g
p q x dx,b g
−∞ ∞
z
ψΨ
Ψ
p q x
p x q
p ,
b g
= −1
where p and q are scale and translation parameters.
The image information is divided into detailed and approximation components in DWT. The linear transformation of these components can be obtained by applying a high and low pass filters i.e.
a j p
n l n p a j p
+ = =−∞ +∞
∑ −
1 2
d j p
n h n p a j
n
+ = =−∞ +∞
∑ −
1 2
3.3
The Malignancy Detection/
Classification Block
The classification can be done by unsupervised and supervised way. The unsupervised classification extracts regions within multi-spectral data. Whereas, in supervised classification the unknown samples are classified by using known samples. We have used four well known classifiers to classify the malignant and benign mammograms, i.e. ANN, Sivandam, S., et. al. [16], KNN, and Bayesian
Classifier, Mitchell, T., et. al. [17], SVM, Gunn, S.R., et. al. [18]. Using more than one classifier provides basis for improved accuracy and better understanding of mammograms compared to using only a single classifier.
3.4
The Ensemble Classification Block
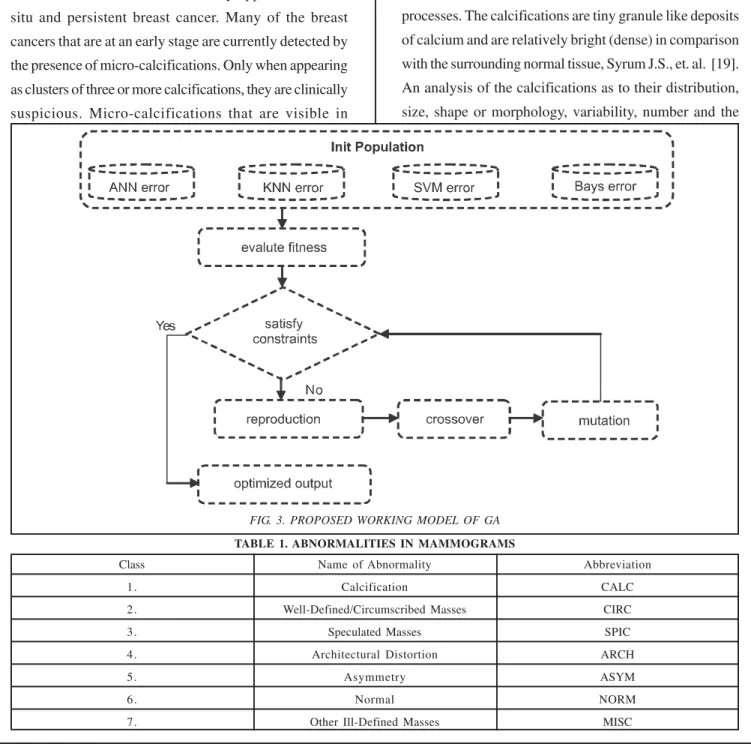
Ensemble is process of combining the results of multiple base learners to improve the accuracy. There are two major types of ensemble, bagging and boosting. Bagging is a voting method in which base learners have been trained over slightly different training sets. The training samples are being generated by bootstrap. Boosting is another kind of ensemble which is different from bagging in a way that it uses multiple classifiers in a sequence, i.e. this technique start with one classifier and pass the data to second classifier which is incorrectly classified by the first classifier and then to third which is incorrectly classified by the second one and so on. Ensemble is applied on the results from malignancy detection block for improved accuracy. For further improvement in results and avoid guessing and hit and trial we have used GA (Genetic Algorithm) to assign weights to the classifiers as shown in Fig. 3.
(a) Original (b) Noisy (c) Restored
(d) Background Removal (e) Enhancement via Retinex (f) Pectoral Muscle
3.5
The Abnormality Detection Block
The major challenge is to diagnose the severity of breast
cancer. The class of abnormality present in data set tells us about its severity. However, in MIAS (Mammographic Image Analysis Society) dataset abnormality of breast cancer is divided into seven classes as listed in Table 1.
The micro-calcification clusters may appear in both
in-situ and persistent breast cancer. Many of the breast
cancers that are at an early stage are currently detected by
the presence of micro-calcifications. Only when appearing
as clusters of three or more calcifications, they are clinically
suspicious. Micro-calcifications that are visible in
mammograms vary in diameter roughly from 0.1-0.5mm.
Fig. 4(a) shows an example of micro-calcification clusters.
These clusters can be benign as well as malignant. The
differentiation between malignant and benign clusters
based on mammographic appearance is not trivial. The
classification of micro-calcifications is important, because
recalling all micro-calcification clusters will result in many
false positives since 80% of all clusters are due to benign
processes. The calcifications are tiny granule like deposits
of calcium and are relatively bright (dense) in comparison
with the surrounding normal tissue, Syrum J.S., et. al. [19].
An analysis of the calcifications as to their distribution,
size, shape or morphology, variability, number and the
TABLE 1. ABNORMALITIES IN MAMMOGRAMS
Class Name of Abnormality Abbreviation
1. Calcification CALC
2. Well-Defined/Circumscribed Masses CIRC
3. Speculated Masses SPIC
4. Architectural Distortion ARCH
5. Asymmetry ASYM
6. Normal NORM
7. Other Ill-Defined Masses MISC
presence of associated findings, such as ductal dilatation
or a mass, will assist one in deciding which are benign,
which should be followed carefully and which should be
biopsied, Paredes, E.S., et. al. [20].
Apart from micro-calcification clusters, one can classify
the visual signs for which radiologists search during
mammographic screening into three basic categories: masses, architectural distortions and asymmetric
densities. These abnormalities may indicate invasive
breast cancer. Masses that are sharply defined (circumscribed masses) are usually benign. However, if a
mass has a faint jagged edge it can be malignant. If a
mass is surrounded by a radiating pattern of spicules, it is called a spiculated mass or stellate lesion. The stellate
lesions are highly suspicious indicators of breast cancer.
A mass is defined as space occupying lesion in more
than one projection [21]. The fat containing radiolucent and mixed-density circumscribed lesions are benign,
whereas isodense to high-density masses may be of
benign or malignant origin [20]. A mass with circumscribed margin is shown in Fig. 4(b). The lesions with
micro-lobular margins have wavy contours. Obscured (erased)
margins of the mass are erased because of the
superimposition with surrounding tissue. This term is used when the physician is convinced that the mass is
sharply-defined but has hidden margins. The lesions with
spiculated margins are characterized by lines radiating from the margins of a mass shown in Fig. 4(e). A lesion
that is ill-defined or spiculated and in which there is no
clear history of trauma to suggest hematoma or fat necrosis suggests a malignant process [20] The shape
of a mass can characterize it as benign or malignant.
Masses with irregular shape usually indicate malignancy
as it is depicted in Fig. 4. Regularly shaped masses such as round and oval very often indicate a benign change.
An interruption of the radial ductal pattern is called
“Architectural Distortion”. These lesions are often quite subtle and can occur with both benign and malignant
processes. The architectural distortions are most common
mammographic sign of cancer and leads towards malignancy [20]. A mammogram with architectural
distortion is shown in Fig. 4(d). Some masses are detected
by radiologists because of asymmetry in the breast pattern since in a normal breast the fibro-glandular breast
pattern is often symmetric with respect to both breasts.
However, when a lesion has spicules or a faint jagged
edge it is likely to be malignant. On the other hand, sharp and well defined edges are likely to be benign. Often, the
masses and micro-calcifications occur together in one
mammogram making detection and classification easier. For detecting primary breast cancer asymmetry of breast
parenchyma is a useful sign [4], as shown in Fig. 4(f). In
most of the cases, global asymmetry is a normal change,
but the finding can be significant if it corresponds with palpable breast lesion.
3.6
The Multi Classification Block -
One-Against-All Approach
We have used ensemble classifier for multi-classification. The conversion of binary classifier to multi-class scenario is still an ongoing research topic, Hsu, C.W., et. al., [23]. Recently, Chen, B., et. al. [24], Chen, G., et. al. [25] experimented SVM for multi-label classification. The one-against-all is widely used implementations which
constructs M classifiers, separating class i from the remaining classes. The binary tree of one-against-all classifiers is explained in the Fig. 5. There are two common methods to enable a binary classifier for multi classification, i.e. one and all. The one-against-all approach represents the most common multiclass approach and involves the division of N class dataset into N two-class cases. On the other hand, in one-against-one a machine is created for each pair of classes ensuing
4.
EXPERIMENTAL RESULTS
The database used into this work is freely available at internet and is named as the MIAS [26]. The specification of the data is given in the referred site. Another real time dataset used for experimentation is taken from SKMCH
& RC (Shaukat Khanum Memorial Cancer Hospital and Research Center), Lahore, Pakistan. The dataset contains records of 80 patients in which 37 patients are benign and 43 are malignant. The data is not publically available and is taken on special request by promising of not to disclose it.
(a) Calcification (b) Circumscribed masses (c) Stellate lesion
(d) Architectural Distortion (e) Speculated Mass [22] (f) Asymmetric Density in the Left Breast [4]
1 Vs
4
2 1
4 3 2
Vs 4 1 Vs
3
3 Vs
4 1 Vs
2
2 Vs
3 Not
1 Not
3
Not 2 Not
4 Not
4
Not 1
FIG. 4. BREAST ABNORMALITIES
We observe that combining multiple classifiers can prove
to give promising results and significantly improves the
performance compared to single classifier. Accordingly,
we take six parallel ensemble classifiers. Each one is trained
for specific abnormality recognition. Each ensemble
classifiers is responsible for one abnormality present in
the image and will declare the image as that kind of
abnormality or any other abnormality.
First, we eliminate all the normal images from the dataset,
and then benign images are separated. Lastly, malignant
images are divided into training and testing datasets
randomly using hold out method. The data set is divided
in the ratio of 75-25 as training and testing. After that
training is performed on 75% data. The data is divided
into six blocks corresponding to six abnormality classes.
Each classifier is trained for a particular class of abnormality
using one-against-all approach. Then, on remaining 25%
testing data we applied same classifier combination.
4.1
Performance Measures
We have tested the performance of the classifiers by calculating and analysis of accuracy, sensitivity and specificity for malignancy detection.
Accuracy: The ratio of number of classified mass to the number of total masses.
Sensitivity: The ratio of number of correct classified malignant mass to the number of total malignant mass.
Specificity: The ratio of number of correct classified benign mass to the number of total benign mass.
4.2
Results
Table 2 discusses the results of malignancy detection in mammogram images. Three important measures accuracy, specificity and sensitivity are taken to measure the performance of the proposed method. It has been observed that in case of ensembling of classifiers the accuracy is
quite good as compare to single classifier.
After applying DWT on each image we have calculated the PCA of each image as a feature reduction technique and to improve the computational complexity. After calculating PCA, we have sorted the PCA coefficients which give us the highest representative features at the start. Then we have applied the classifiers by selecting different features and we have found that accuracy of
classifiers remains approximately unchanged with the feature vector of size seven or more. Therefore, we have used seven top PCA features of each image for the construction of feature vectors. To improve the accuracy we have ensemble the results produced by the classifiers which results 96.39% for real mammogram data and 96.95% for MIAS data. After that we have further improved our results by optimizing the weights assigned to each classifier during ensemble. For this purpose we have used Genetic Algorithms initially starting with population size of 100
which results in 97.63% accuracy for real mammogram data and 97.45% MIAS dataset (Table 3).
TABLE 2. PERFORMANCE MEASURE OF CLASSIFICATION OF MALIGNANT AND BENIGN MAMMOGRAM FOR DWT FEATURE
Technique Accuracy (%) Sensitivity (%) Specificity (%)
NN+DWT Features 93.94 91.3 94.3
Baysian+DWT Features 95.11 94.1 90.2
KNN+DWT Features 95.87 92.7 92.7
SVM+DWT Features 96.13 91.3 91.1
Ensemble 96.95 93.2 93.6
Table 4 shows the abnormality detection results of
ensemble classifier using DWT features. These results
are compiled using mean, median and product rule. It has
been seen that the performance of proposed method
approximately remain consistent in case of mean and
median rule for the detection of abnormalities in the
mammogram. The abnormality detection rate is also
satisfactory.
Table 5 compares the abnormality detection results
presented in Table 5 with the recently reported results of
different authors. It has been seen that proposed technique
shows comparable performance with existing techniques.
It should be noted that the datasets used by techniques
in Table 5 are different and results only show the qualitative
insights.
5.
CONCLUSION
The proposed architecture efficiently diagnoses the breast
cancer from mammogram images. The diagnosis multiple
phases are utilized. In first phase, preprocessing on mammogram image is done which minimize the
computational cost and maximize the probability of
accuracy. In second phase DWT features are extracted
and are used for classification of mammogram into
malignant and benign. Later, the malignant images are
again classified using one-against-all technique to find
abnormalities present in the mammograms. In first classification phase when benign and malignant images
are separated, different classifiers are experimented but
ensemble with GA is found better for the MIAS dataset.
The one-against-all approach for multi classification gave
promising results. All experimental results show promising
TABLE 4. ENSEMBLE ACCURACY FOR MULTI-CLASSIFICATION USING ONE-AGAINST-ALL
Abnormality Type Abbreviation Mean (%) Median (%) Product (%)
Calcification CALC 97.5 95.2 96.2
Well-Defined/Circumscribed Masses CIRC 98.1 93.5 97.3
Speculated Masses SPIC 94.3 94.2 96.5
Other, Ill-Defined Masses MISC 95.2 96.2 95.1
Architectural Distortion ARCH 96.3 96.4 95.4
Asymmetry ASYM 97.5 97.3 94.5
TABLE 5. COMPARISON OF OUR ARCHITECTURE WITH OTHER APPROACHES
Other Technique Problem Addressed Results Reported Our Results multiresolution and SVM-based featureless approach [13] Mass Detection 80% 95.20%
Linear Transformation Filter Algorithm [11] Mass Detection 95.91% 95.20% Multiple-Concentric-Layers Algorithm [7] Mass Detection 92% 95.20%
Locating Points Surrounded by Concentric Layers [8] Architectural Distortion 93.10% 96.30% Hausdorff Fractal Dimension and SVM [9] Architectural Distortion 72.50% 96.30%
Mathematical Morphology [10] Architectural Distortion 94% 96.30% Semi Automated Texture Based Approach [12] Bilateral Asymmetry 86.70% 98.20%
TABLE 3. RESULTS WITH DWT FEATURES
Dataset ANN KNN SVM Bayesian Ensemble Ensemble+GA
MIAS 93.94 95.87 95.11 96.13 96.95 97.45
results compared to the state-of-art. We have achieved
average accuracy of 97.45% in detection of malignant and
benign mammograms from MIAS dataset.
ACKNOWLEDGMENT
The authors would like to thank Higher Education
Commision, Islamabad, National University of Emerging
Science, FAST, Karach, and Mehran University of
Engineering & Technology, Jamshoro, Pakistan, for
providing funds and/or required resources to complete
this work.
REFERENCES
[1] “Estimated New Cancer Cases and Deaths for 2008”, http://seer.cancer.gov/statistics/, 2009.
[2] Broeders, M.J., and Verbeek, A.L., “Breast Cancer Epidemiology and Risk Factors”, Journal of Nuclear Medical, Volume 41, pp. 179-188, 1997.
[3] Wallis, M., Walsh, M., and Lee, J., “A Review of False Negative Mammography in Asymptomatic Population”, Clinical Radiology, Volume 44, pp. 13.15, 1991.
[4] Cheng, H., et. al., “Approaches for Automated Detection and Classification of Masses in Mammograms”, Pattern Recognition, Volume 39, pp. 646.668, 2006.
[5] Jaffar, M.A., et. al., “Multi Domain Features Based Classification of Mammogram Images Using SVM and MLP”, ICIC Express Letters, Volume 4, 2010.
[6] “Fuzzy Entropy and Morphology Based Fully Automated Segmentation of Lungs from CT Scan Images”, International Journal of Innovative Computing, Information and Control, Volume 5, pp. 4993.5002, 2009.
[7] Eltonsy, N., Tourassi, G., and Elmaghraby, A., “A Concentric Morphology Model for the Detection of Masses in Mammography”, IEEE Transactions on Medical Imaging, Volume 26, pp. 880.889, 2007.
[8] “Investigating Performance of a Morphology-Based CAD Scheme in Detecting Architectural Distortion in Screening Mammograms”, Proceedings of International Congr. Exhibtion Comput. Assist. Radiol. Surg., 2006.
[9] Guo, Q., Shao, J., and Ruiz, V., “Investigation of Support Vector Machine for the Detection of Architectural Distortion in Mammographic Images”, International Journal Physics Conference Series, Volume 15, pp. 88-94, 2005.
[10] Matsubara, T. et al., “Detection Method for Architectural Distortion Based on Analysis of Structure of Mammary Gland on Mammograms”, International Congress Exhibition Compututer Assist. Radiol. Surg., Volume 1281, pp. 1036.1040, 2005.
[11] Kom, G., Tiedeu, A., and Kom, M., “Automated Detection of Masses in Mammograms by Local Adaptive Thresholding”, Computer Biologyy Medical, Volume 37, pp. 37.48, 2007.
[12] Miller, P., and Astley, S., “Automated Detection of Breast Asymmetry Using Anatomical Features”, Machine Perception and Artificial Intelligence, Volume 9, pp. 247.261, 1994.
[13] Campanini, R., et al., “A Novel Featureless Approach to Mass Detection in Digital Mammograms Based on Support Vector Machines”, Physics in Medicine and Biology, Volume 49, pp. 961.975, 2004.
[14] Hussain, A. et. al., “Detail Preserving Fuzzy Filter for Impulse Noise Removal”, International Journal of Innovative Computing, Information and Control, Volume 5, 2009.
[15] Rahman, Z., Woodell, G.A., and Jobson, D.J., “Retinex Image Enhancement: Application to Medical Images”, NASA Workshop on New Partnerships in Medical Diagnostic Imaging, Greenbelt, Maryland, July, 2001.
[16] Sivandam, S., and Deepa, S.N., “Principles of Soft Computing”, Wiley, 2007.
[17] Mitchell, T., “Machine Learning”, McGraw-Hill, 1997.
[18] Gunn, S.R., “Support Vector Machines for Classification and Regression”, Technical Report, 2008.
[20] Paredes, E.S., “Atlas of Mammography”, Lippincott Williams & Wilkins, 2007.
[21] “ACR Breast Imaging Reporting and Data System, Breast Imaging Atlas”, 2003.
[22] Heath, M., et. al., “The Digital Database for Screening Mammography”, Proceedings of International Workshop on Digital Mammography, pp. 212-218, 2000.
[23] Hsu, C.W., and Lin, C.J., “A Comparison of Methods for Multiclass Support Vector Machines”, IEEE Tranactions on Neural Networks, Volume 13, pp. 415.425, 2002.
[24] Chen, B., Ma, L., and Hu, J., “An Improved Multi-Label Classification Method Based on SVM with Delicate Decision Boundary”, International Journal of Innovative Computing, Information and Control, Volume 6, pp. 1605-1614, 2010.
[25] Chen, G., et. al., “Multi-Class Support Vector Machine Active Learning for Music Annotation”, International Journal of Innovative Computing, Information and Control, Volume 6, pp. 921-930, 2010.