______________________________________
1 Universidade Estadual Paulista (UNESP), Faculdade de Ciências Agrárias e Veterinárias, Departamento de Solos e Adubos, Via de
Acesso Prof. Paulo Donato Castellane, s/n, Jaboticabal - SP, [email protected], [email protected], [email protected], [email protected].
2
Faculdade de Engenharia Agrícola, Universidade de Campinas (UNICAMP), Campinas - SP, [email protected] Recebido pelo Conselho Editorial em: 25-8-2009
Aprovado pelo Conselho Editorial em: 26-4-2011
Eng. Agríc., Jaboticabal, v.31, n.4, p.643-651, jul./ago. 2011 CULTIVATEDWITH CITRUS
MARISOL G. A. DE LEÃO1, JOSÉ MARQUES JÚNIOR1, ZIGOMAR M. DE SOUZA2, DIEGO S.SIQUEIRA1, GENER T. PEREIRA1
ABSTRACT: The technique of precision agriculture and soil-landscape allows delimiting areas for
localized management, allowing a localized application of agricultural inputs and thereby may contribute to preservation of natural resources. Therefore, the objective of this work was to characterize the spatial variability of chemical properties and clay content in the context of soil-landscape relationship in a Latosol (Oxisol) under cultivation of citrus. Soil samples were collected at a depth of 0.0-0.2 m in an area of 83.5 ha planted with citrus, as a 50-m intervals grid, with 129 points in concave terrain and 206 points in flat terrain, totaling 335 points. Values for the variables that express the chemical characteristics and clay content of soil properties were analyzed with descriptive statistics and geostatistical modeling of semivariograms for making maps of kriging. The values of range and kriging maps indicated higher variability in the shape of concave topography (top segment) compared with the shape of flat topography (slope and hillside segments below). The identification of different forms of terrain proved to be efficient in understanding the spatial variability of chemical properties and clay content of soil under cultivation of citrus.
KEYWORDS: geostatistics, management zone, oxisol, orange.
FORMAS DO RELEVO E VARIABILIDADE ESPACIAL DE PROPRIEDADES DO SOLO EM ÁREA CULTIVADA COM CITROS
RESUMO: A técnica de agricultura de precisão e a relação solo-paisagem permitem delimitar áreas
para o manejo localizado, o que permite a aplicação localizada de insumos agrícolas e, consequentemente, pode contribuir para a preservação de recursos naturais. Portanto, o objetivo deste trabalho foi caracterizar a variabilidade espacial das propriedades químicas e do teor de argila, no contexto da relação solo-paisagem, em um Latossolo sob cultivo de citros. Amostras de solo foram coletadas na profundidade de 0,0-0,2 m, em uma área de 83,5 ha cultivada com citros, na forma de malha, com intervalos regulares de 50 m, com 129 pontos na forma de relevo côncava e 206 pontos na forma plana, totalizando 335 pontos. Os valores obtidos para as variáveis que expressam as propriedades químicas e para o teor de argila do solo foram submetidos à análise estatística descritiva e geoestatística com a modelagem de semivariogramas para a confecção de mapas de krigagem. Os valores de alcance e mapas de krigagem indicaram maiores variabilidades na forma de relevo côncava (segmento topo), quando comparada com a forma plana (segmentos meia encosta e encosta inferior). A identificação de diferentes formas de relevo mostrou-se eficiente no entendimento da variabilidade espacial das propriedades químicas e do teor de argila do solo sob cultivo de citros.
PALAVRAS-CHAVE: geoestatística, zona de manejo, paisagem, latossolo, laranja.
Brazil is the world's largest producer of oranges for industrial purpose, producing more than half of the frozen juice concentrate in the world, with sales accounting for more than 80% of the international trade. The São Paulo state produces about 80% of the industrially processed orange in Brazil, which is officially estimated at 356.2 million boxes in 2007 (DIEESE, 2007).
In the citrus industry, as in any culture geared towards the international market, there is a yearning for technological development that enables increased productivity, reduction of production costs, and environmental preservation. Precision farming techniques, together with the study of soil-landscape relationships, seek to understand the spatial variability of soil properties, trying to establish relationships of cause and effect of the spatial distribution of soil and plant. By understanding these variations, it is possible to delimit areas of localized management to optimize the application of inputs and to promote preservation of natural resources.
Studies of soil-geomorphology relations have made great progress with the implementation of the concepts of landscape models, which take into account small gradients of topography, slope segments and surfaces as the geomorphic work TROEH (1965), RUHE (1969), DALRYMPLE et al. (1968) and DANIELS et al. (1971). These studies helped to improve the purity of soil surveys in order to identify and map areas of homogeneous soils. In addition to changes in stratigraphy (rock layers or strata) and terrain forms, crop management is also a source of soil variability. During the cultivation of perennial plants, such as for citrus, the localized application of fertilizers constitutes a factor of anthropogenic variability. FARIAS et al. (2003), studied the variability in orange orchards along the landscape and found that geostatistics was a very useful tool for precision agriculture program in citrus.
Soil properties, after suffering successive changes caused by agricultural activities and, consequently, by erosion, behave quite differently across the landscape (IZIDORIO et al., 2005; SOUZA et al., 2005; SOUZA et al., 2006). Soils subjected to the same management system in places with small terrain variation manifest different spatial variability of its properties. This variability is a function of the position of soils in the landscape (BARBIERI et al., 2008) or in slopes, even when the terrain has little expression (SANCHEZ et al., 2005; SOUZA et al., 2006).
In soil sciences, conventional statistical analyses, which do not consider the relative sample position, or the correlation of neighboring observations, may be insufficient to describe the distribution of values of a variable in space and its relationship with the plant in the landscape, requiring different statistical treatment, and characterized with the use of semivariograms, interpolation methods, and other approaches.
The objective of this study was to characterize the spatial variability of chemical properties and clay content in the context of soil-landscape in a Latosol (Oxiol) under citrus cultivation.
MATERIAL AND METHODS
The area of study is located in the municipality of Peixoto, São Paulo State, located in the Western Plateau with geographic coordinates 21º 75’ South latitude and 48º 46’ West longitude, at
an altitude ranging from 525 to 580 m. The climate has been classified by the Köppen’s method as
subtropical dry winter (Cwa), with average rainfall of 1,400 mm.
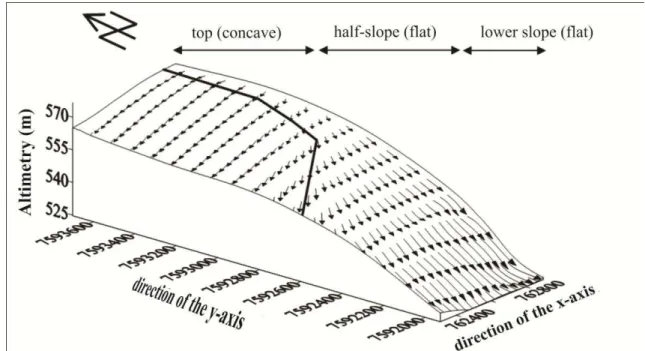
The geology is represented by sediments of the Bauru Group (Adamantina Formations). The highest portion of the region is characterized by the presence of edges, convex slopes with low inclination (2-5%). These slopes are interrupted by ravines, relatively deep valleys in open "v", with a graded slope from the shoulder to the foothills. The soil of the study area was classified as Dystrophic Red Latosol (Oxiol) moderate A, medium to clayey texture, according to criteria set by EMBRAPA (1999).
part of the slope was defined (Figure 1). The middle and lower slopes are characterized by a flat shape. The concave shape corresponds to the beginning of a convergence to a water spring (a first-order basin) located approximately 400 m of the area of study.
FIGURE 1. Digital elevation model with vectors (representing the path surface and intensity of water flow) of the study area.
A grid was established with regular intervals of 50 m with 129 points in a concave shape and 206 points in a flat shape, totaling 335 points in an area of 83.5 hectares. At the intersection of this mesh, the nearest orange plant was geo-referenced. Soil was sampled in the projection of the plant’s crown at a depth of 0.0-0.2 m.
To characterize the soil chemistry, the active acidity (pH in CaCl2) was determined potentiometrically. Values of exchangeable calcium (Ca), magnesium (Mg) and potassium (K), and available phosphorus (P) were extracted using the method of ion exchange resin proposed by RAIJ et al. (2001). Based on the chemical analysis results, the cation exchange capacity (CEC) and base saturation (V%) were calculated. The granulometric composition of the soil was determined by the pipette method using 0.1N NaOH as a dispersing agent and mechanical stirring at low speed for 16 hours, following the methodology proposed by EMBRAPA (1997).
The results of the chemical properties and clay contents were used in descriptive statistical analysis by calculating mean, median, minimum and maximum values, coefficient of variation, coefficient of skewness and kurtosis coefficient. The assumption of data normality was tested using the Kolmogorov-Smirnov test with the computer program SAS (SCHLOTZHAVER & Littell, 1997). The spatial dependence was analyzed by semivariogram adjustments (VIEIRA, 2000), based on the assumption of stationarity of the process, i.e., of the intrinsic validity of the hypothesis (eq.(1)).
N(h)
1 i
2 i i) Z(x h) Z(x
2N(h) 1 (h)
γˆ (1)
where, ) (
ˆ h
- estimator of the semivariance function; N (h) - number of experimental pairs;
From the adjustment of a mathematical model to ˆ(h) calculated values, the coefficients of the semivariogram theoretical model (nugget effect, C0; baseline, C0+C1; and scope, a) are estimated. To analyze the degree of spatial dependence of the properties under study, we employed the classification of CAMBARDELLA et al. (1994), which considers of strong spatial dependence semivariograms with nugget effect <25% of the baseline, moderate when between 25 and 75%, and poor when > 75%.
The semivariogram models considered were spherical, exponential, flat, and Gaussian, being adjusted by the GS+ program (ROBERTSON, 1998). These models were later used in map development (kriging). In case of doubt over a model for the same semivariogram, it was considered the greatest value of the correlation coefficient obtained by cross validation method. Preparation of spatial distribution maps of variables was performed using the Surfer program (GOLDEN SOFTWARE, 1999).
RESULTS AND DISCUSSION
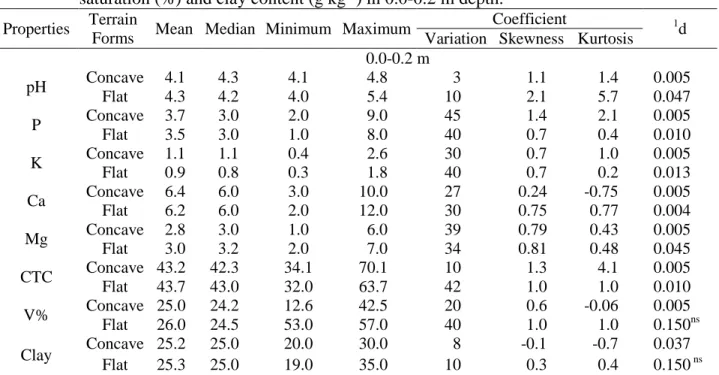
The Kolmogorov-Smirnov test indicated normality only for clay content and base saturation in the form of flat topography (Table 1). The values of skewness and kurtosis showed asymmetric distributions for most of the chemical soil properties under study. According to ISAAKS & SRIVASTAVA (1989), the coefficient of skewness is more sensitive to extreme values than the average and standard deviation, because a single value can exert strongly influence, since the deviations between each value and the average are raised to the third power. The values of the measurements of central tendency (mean and median) are close to all chemical properties of the soil and clay content in the forms of concave (top) and flat (middle and lower slopes) topography, with all properties involved in the study approaches showing normal distribution.
TABLE 1. Descriptive statistics for pH, phosphorus (mg dm-3), potassium (mmolc dm-3), calcium (mmolc dm-3), magnesium (mmolc dm-3), cation exchange capacity (mmolc dm-3), base saturation (%) and clay content (g kg-1) in 0.0-0.2 m depth.
Properties Terrain
Forms Mean Median Minimum Maximum
Coefficient 1
d Variation Skewness Kurtosis
0.0-0.2 m
pH Concave 4.1 4.3 4.1 4.8 3 1.1 1.4 0.005
Flat 4.3 4.2 4.0 5.4 10 2.1 5.7 0.047
P Concave 3.7 3.0 2.0 9.0 45 1.4 2.1 0.005
Flat 3.5 3.0 1.0 8.0 40 0.7 0.4 0.010
K Concave 1.1 1.1 0.4 2.6 30 0.7 1.0 0.005
Flat 0.9 0.8 0.3 1.8 40 0.7 0.2 0.013
Ca Concave 6.4 6.0 3.0 10.0 27 0.24 -0.75 0.005 Flat 6.2 6.0 2.0 12.0 30 0.75 0.77 0.004
Mg Concave 2.8 3.0 1.0 6.0 39 0.79 0.43 0.005
Flat 3.0 3.2 2.0 7.0 34 0.81 0.48 0.045
CTC Concave 43.2 42.3 34.1 70.1 10 1.3 4.1 0.005 Flat 43.7 43.0 32.0 63.7 42 1.0 1.0 0.010
V% Concave 25.0 24.2 12.6 42.5 20 0.6 -0.06 0.005 Flat 26.0 24.5 53.0 57.0 40 1.0 1.0 0.150ns
Clay Concave 25.2 25.0 20.0 30.0 8 -0.1 -0.7 0.037 Flat 25.3 25.0 19.0 35.0 10 0.3 0.4 0.150 ns 1
d = statistics of the Kolmogorov-Smirnov test, not significant at 5% probability (ns).
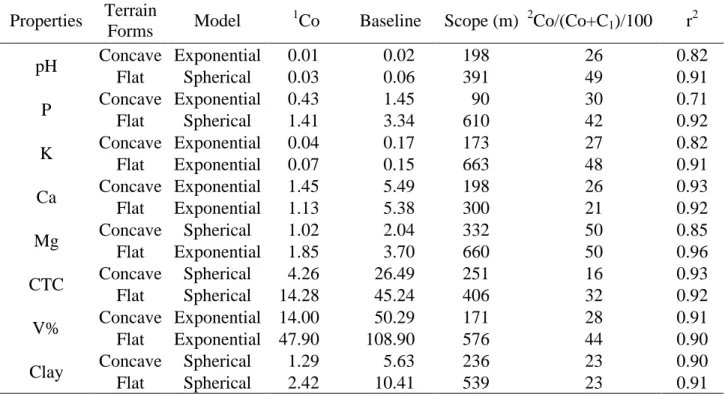
From the coefficient of variation (CV) limits proposed by WARRICK & NIELSEN (1980) for the classification of soil variables for low (CV < 12%), medium (12% < CV > 24%) and high (CV > 24%) variability, only pH and clay content showed low variability in the two areas under study along with the cation exchange capacity (CEC) in the concave topography form, with the other variables showing high variability (Table 1). According to VANNI (1998), coefficients of variation greater than 35% show that the series is heterogeneous and the average has little meaning. The high value of CV for soil chemical properties is probably due to residual effects of previous fertilizations. Fertilization occurs in planting rows, but soil acidity correction (liming) is spread on the soil, without homogenization of the area. Our geostatistical analysis results revealed that all chemical properties and clay content showed spatial dependence in concave and flat topographies (Table 2). All semivariograms were adjusted to spherical and exponential models.
The nugget effect reflects the variability not explained in terms of distance from the sample used, such as local variations, errors in analysis, sampling and others. Since it is impossible to quantify the individual contribution to these errors, the nugget effect is expressed as a percentage of the level, thus facilitating the comparison of the degree of spatial dependence of the variables under study (VIEIRA, 2000). The C0/(C0+C1) ratios revealed that all chemical properties studied presented a moderate spatial dependence, except for Ca in the flat topography form, CEC in the concave terrain form, and clay content in both terrain forms studied.
TABLE 2. Coefficients of semivariograms and models adjusted to the pH, phosphorus (mg dm-3), potassium (mmolc dm-3), calcium (mmolc dm-3), magnesium (mmolc dm-3), cation exchange capacity (mmolc dm-3), base saturation (%) and clay content (g kg-1) in the depth of 0.0-0.2 m.
Properties Terrain
Forms Model
1
Co Baseline Scope (m) 2Co/(Co+C1)/100 r2
pH Concave Exponential 0.01 0.02 198 26 0.82
Flat Spherical 0.03 0.06 391 49 0.91
P Concave Exponential 0.43 1.45 90 30 0.71
Flat Spherical 1.41 3.34 610 42 0.92
K Concave Exponential 0.04 0.17 173 27 0.82
Flat Exponential 0.07 0.15 663 48 0.91
Ca Concave Exponential 1.45 5.49 198 26 0.93
Flat Exponential 1.13 5.38 300 21 0.92
Mg Concave Spherical 1.02 2.04 332 50 0.85
Flat Exponential 1.85 3.70 660 50 0.96
CTC Concave Spherical 4.26 26.49 251 16 0.93
Flat Spherical 14.28 45.24 406 32 0.92
V% Concave Exponential 14.00 50.29 171 28 0.91
Flat Exponential 47.90 108.90 576 44 0.90
Clay Concave Spherical 1.29 5.63 236 23 0.90
Flat Spherical 2.42 10.41 539 23 0.91
1C
o = nugget effect; 2Co/(Co+C1) = degree of spatial dependence.
Scope is a semivariogram parameter, through which one can determine the area of representativeness of the samples and the sampling intensity required in the slope. For all chemical properties and clay contents in the area cultivated with citrus, base saturation was lower in the concave terrain, indicating greater variability in this form in relation to flat terrain. These data agree with MONTANARI et al. (2005), which studied techniques of sampling optimization in an area planted with sugarcane.
influence specific environments that interfere with pedogenetic processes, resulting in greater spatial variability of the soil properties and clay content in citrus cultivation areas (Figure 1). SANCHEZ et al. (2005) studied the influence of geomorphic surfaces in the spatial variability of soil properties and found that small variations in the gradient led to different terrain variability in relation to chemical and texture properties, in which the spatial variability was higher in older and flat surfaces, that was reflected in the spatial variability of coffee production areas.
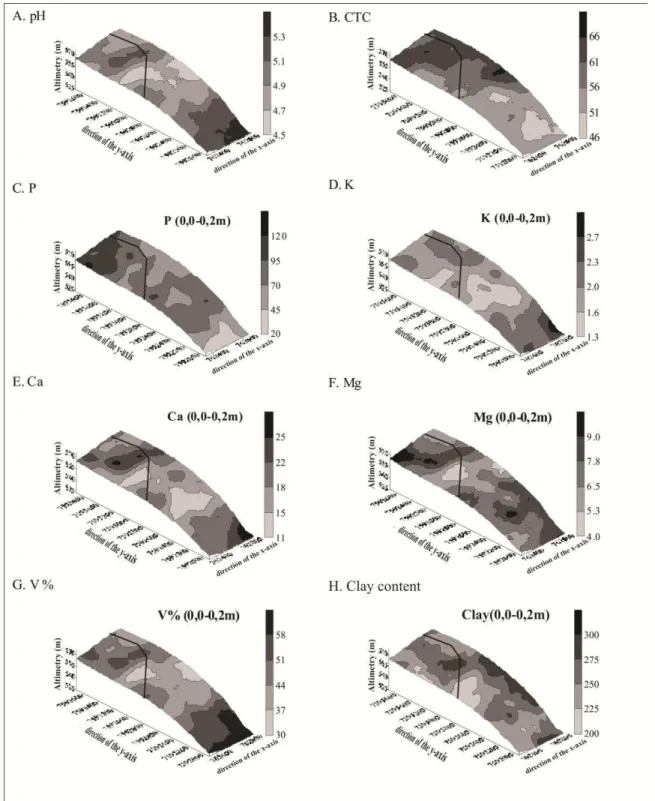
The adjusted semivariogram model parameters shown in Table 2 were used to estimate values at unsampled locations by kriging (Figure 2).
Kriging map of P and K at the 0.0-0.2 m depth shows values between 20 and 120 mg dm-3 and 1.3 and 2.7 mmolc dm-3, respectively. This wide data range is due to fertilizer application in rows and for P, due to its low mobility in the soil. Similar results were observed by SANCHEZ et al. (2005) and SOUZA et al. (2006) in areas cultivated with coffee and sugarcane, respectively.
Values of pH ranged from 4.5 to 5.3 at a depth of 0.0-0.2 m, featuring medium to high acidity (Figure 2). The pH range most suitable for orange cultivation is between 5.5 and 6.0 (RAIJ et al., 1997). Therefore, the area studied presented levels less than ideal for this crop. WHITNEY et al. (1998) stated that pH is often the factor that affects the most production and quality of citrus crops, and GASTON et al. (2001) found a strong relationship between topography and pH.
The orange tree requires high levels of Ca, being considered satisfactory a soil Ca content between 21 and 40 mmolc dm-3, so that 40% of the total CEC corresponds to Ca (RAIJ et al., 1997). Values of the variables Ca and Mg were between 11 and 25 mmolc dm-3 and 4.0 and 9 mmolc dm-3, respectively (Figure 2). For Mg, the most appropriate range in the soil lies between 5 and 8 mmolc dm-3, so that we conclude that the study area has appropriate levels of Mg for the crop (RAIJ et al., 1997). V% values ranged from 30 to 58%, well below the ideal for orange, which is 70% (RAIJ et al., 1997). The attribute CEC presented values between 46 and 66 mmolc dm-3. Clay content ranged from 200 to 300 g kg-1, fitting into the group of medium texture (EMBRAPA, 1999).
Regarding the slightly concave area covering the top and the hillside, we observed a spatial distribution of the properties Ca, Mg, K, P, CEC and V% similarly to the clay content, indicated by the similarity of the distribution of isolines, i.e., perpendicular to the surface water pathway (Figures 1 and 2). The contour maps and the scope value indicate that the levels of chemical properties and clay showed greater spatial variability in the slightly concave terrain form (Table 2 and Figure 2).
Low and median values of almost all chemical properties are located on slopes, characterized by a gently concave area. It is noticeable that the lower slope is the segment with highest intensity of water flow (Figure 1) and that in this segment the contour for most of the properties studied are perpendicular to the slope of the hill (Figure 2), revealing the variability of these properties. This isoline pattern on the map corroborate the results reported by GESSLER et al. (2000) that the characteristic of the water flow determines different areas of erosion and deposition. It is observed that higher values of Ca, Mg, K, V% and clay content are recorded on the lower slope (flat shape) due to the direct action of water surface flow by depositing material on this slope.
In the studied area, the recommended annual lime application is made taking into account only a single sampling in each block, which is not the case for fertilization. However, with kriging maps, the recommendation can be made taking into account the spatial variability of chemical properties with localized application, with the adjustment of the fertilizer and soil amendment according to the requirements of specific areas.
CONCLUSION
The values of scope and kriging maps indicated higher variability in the concave terrain form (top segment) compared to the flat shape (middle and lower slope segments). The identification of different shapes and terrain segments proved to be efficient to understand the spatial variability of chemical properties and clay content in the soil under citrus cultivation.
REFERENCES
BARBIERI, D.M.; MARQUES JUNIOR, J.; PEREIRA, G.T. Variabilidade espacial de
propriedades químicos de um argissolo para aplicação de insumos à taxa variável em diferentes formas de relevo. Engenharia Agrícola, Jaboticabal, v.28, n.4, p.645-653, 2008.
CAMBARDELLA, C.A.; MOORMAN, T.B.; NOVAK, J.M.; PARKIN, T.B.; KARLEN, D.L.; TURCO, R.F.; KONOPKA, A.E. Field scale variability of soil properties in Central Iowa soils. Soil
CARVALHO, J.R.P.; SILVEIRA, P.M.; VIEIRA, S.R. Geoestatística na determinação da variabilidade espacial de características químicas do solo sob diferentes preparos. Pesquisa
Agropecuária Brasileira, Brasília, v.37, n.8, p.1.151-1.159, 2002.
DALRYMPLE, J.B.; BLONG, R.J.; CONACHER, A.J. A hipothetical nine unit land a surface model. Z. Geomorphology, Berlin, v.12, n.1, p.60-76, 1968.
DANIELS, R.B.; GAMBLE, E.F.; CADY, J.G. The relation between geomorphology and soil morphology and genesis. Advances in Agronomy, Madison, v.23, n.1, p.51-87, 1971.
DIEESE. DEPARTAMENTO INTERSINDICAL DE ESTATÍSTICA E ESTUDOS
SOCIOECONÔMICOS. Estudos e pesquisas: desempenho do setor sucroalcooleiro brasileiro e os trabalhadores. São Paulo, 2007. v.3, 34 p.
EMBRAPA. EMPRESA BRASILEIRA DE PESQUISA AGROPECUÁRIA. Manual de métodos
de análise de solo. 2.ed. Rio de Janeiro: Ministério da Agricultura e do Abastecimento, 1997. 212 p.
EMBRAPA. EMPRESA BRASILEIRA DE PESQUISA AGROPECUÁRIA. Centro Nacional de Pesquisa de Solos. Sistema brasileiro de classificação de solos. Brasília: EMBRAPA-SPI;
EMBRAPA-CNPS, 1999. 412 p.
FARIAS, P.R.S.; NOCITI, L.A.S.; BARBOSA, J.C. Agricultura de precisão: mapeamento da produtividade em pomares cítricos usando geoestatística. Revista Brasileira de Fruticultura, Jaboticabal, v.25, n.2, p.235-241, 2003.
GASTON, L.A.; LOCKE, M.A.; ZABLOTOWICZ, R.M.; REDDY, K.N. Spatial variability of soil properties and weed populations in the Mississippi Delta. Soil Science Society of America Journal, Madison, v.65, n.2, p.449-459, 2001.
GESSLER, P.E.; CHADWICK, O.A.; CHAMRAN, F.; ALTHOUSE, L.; HOLMES, K. Modeling soil-landscape and ecosystem properties using terrain attributes. Soil Science Society of America
Journal, Madison, v.64, n.6, p.2.046-2.056, 2000.
GOLDEN SOFTWARE. Surfer for windows: realese 7.0, contouring and 3D surface mapping for
scientist’s engineers user’s guide. New York, 1999. 619 p.
ISAAKS, E.H.; SRIVASTAVA, R.M. An introduction to applied geoestatistics. New York: Oxford University, 1989. 561 p.
IZIDORIO, R.; MARTINS FILHO, M.V.; MARQUES JÚNIOR, J.; SOUZA, Z.M.; PEREIRA, G.T. Perdas de nutrientes por erosão e sua distribuição espacial em área sob cana-de-açúcar.
Engenharia Agrícola, Jaboticabal, v.25, n.3, p.660-70, 2005.
MONTANARI, R.; MARQUES JÚNIOR, J.; PEREIRA G.T.; SOUZA, Z.M. Forma da paisagem como critério para otimização amostral de latossolos sob cultivo de cana-de-açúcar. Pesquisa
Agropecuária Brasileira, Brasília, v.40, n.1, p.69-77, 2005.
RAIJ, VAN B.; ANDRADE, J.C.; CANTARELLA, H.; QUAGGIO, J. A. (Ed.) Análise química
para avaliação da fertilidade de solos tropicais. Campinas: Instituto Agronômico, 2001. 285 p.
RAIJ, VAN B.; CANTARELLA, H.; QUAGGIO, J. A.; FURLANI, A.M.C. Recomendações de
adubação e calagem para o Estado de São Paulo. 2. ed. Campinas: Instituto Agronômico, 1997.
285 p. (Boletim Técnico, 100)
ROBERTSON, G.P. GS+: geostatistics for the environmental sciences (version 5.1 for windows). Plainwell: Gamma Design Soffware, 1998. 152 p.
RUHE, R.V. Quaternary landscapes in Iowa. Ames: Iowa State University Press, 1969. 225 p.
SANCHEZ, R.B.; MARQUES JÚNIOR, J.; PEREIRA, G.T.; SOUZA, Z.M. Variabilidade espacial de propriedades de Latossolo e da produção de café em diferentes superfícies geomórficas. Revista
SCHLOTZHAVER, S.D.; LITTELL, R.C. SAS: system for elementary statistical analysis. 2nd ed. Cary, 1997. 905 p.
SOUZA, Z.M.; MARQUES JÚNIOR, J.; PEREIRA, G.T.; BARBIERI, D.M. Small terrain shape variations influence spatial variability of soil chemical attributes. Scientia Agrícola, Piracicaba, v.63, n.2, p.161-168, 2006.
SOUZA, Z. M.; MARTINS FILHO, M.V.; MARQUES JUNIOR, J.; PEREIRA, G.T. Variabilidade espacial de fatores de erosão em Latossolo Vermelho eutroférrico sob cultivo de cana-de-açúcar.
Engenharia Agrícola, Jaboticabal, v.25, n.1, p.105-114, 2005.
TROEH, F.R. Landform equations fitted to contour maps. American Journal of Science, New Haven, v.263, n.3, p.616-627, 1965.
VANNI, S.M. Modelos de regressão: estatística aplicada. São Paulo: Legmar Informática & Editora, 1998. 177 p.
VIEIRA, S.R. Geoestatística em estudos de variabilidade espacial do solo. In: NOVAIS, R.F.; ALVAREZ, V.H.; SCHAEFER, C.E.G.R. (Ed.). Tópicos em ciência do solo. Viçosa-MG: Sociedade Brasileira de Ciência do Solo, 2000. v.1, p.1-53.
WARRICK, A.W.; NIELSEN, D.R. Spatial variability of soil physical properties in the field. In: HILLEL, D. (Ed.). Applications of soil physics. New York: Academic, 1980. cap. 2, p.319-344.