Preliminary. Please do not circulate
Valuation and performance of
fi
rms in complex
ownership structures: An application to Korean
chaebols*
Heitor Almeida
NYU Stern School of Business Sang Yong Park
Yonsei University Marti Subrahmanyam NYU Stern School of Business
Daniel Wolfenzon NYU Stern School of Business
(This Draft: March 21, 2007)
Abstract
We propose several new metrics to describe the complex ownership structure of business groups, and provide simple formulas and algorithms to compute these metrics. We use these measures to describe in detail the ownership structure of Korean chaebols in the period of 2003 to 2004. In addition, we validate the usefulness of our new metrics by showing em-pirically that they are important for understanding the valuation and performance of group
firms. In particular, we show evidence that firms that are central to the control structure of the chaebol (centralfirms), firms in cross-shareholdings, andfirms that are placed at the bottom of the group (i.e., with lower ultimate ownership) have lower profitability than other groupfirms. The valuation results suggest that centralfirms andfirms in cross-shareholding loops have lower valuations than other public Chaebol firms. The lower valuation of these
firms is not explained by variation in measures of ownership concentration and separation between ownership and control.
Key words: business groups, familyfirms,firm performance, pyramids, cross-shareholdings, parent company discount
JEL classification:
In most countries around the world individuals or families control a large number offirms through a complex arrangement of ownership chains. In many cases the family holds not only direct stakes in group firms, but also indirect stakes through other firms in the group. For example, one typical ownership structure is referred to as a pyramid. In this structure, the family achieves control of the constituentfirms, by a chain of ownership relations: the family directly controls afirm, which in turn controls anotherfirm, which might itself control other
firms, and so forth.1 Another type of inter-company link is through cross-shareholdings. In this ownership structure, firms in the group have mutual ownership relations: one firm in the group holds a stake in another, which, in turn, has a stake in thefirst firm. In general, many large family groups combine the pyramidal form with cross-shareholdings, leading to a complex web of ownership. These so called business groups are an important component of several countries’ corporate landscape, accounting for a large fraction of their economic activities.2, 3
Yet, we still do not understand the causes and consequences of the complex structures of groups. In particular, the literature has only used rough measures to describe groups, mostly relying on variables such as whether afirm is directly or indirectly owned, or the ownership stake of the controlling shareholder.4 The reasons for this are that alternative measures do not exist, and that data on ownership is usually difficult to obtain, specially for privately held firms in a group.
In this paper we make two contributions. First, inspired by recent theoretical work on business groups (e.g., Almeida and Wolfenzon (2006)), we provide a number of measures that can be used to describe their complex structure. In addition to being well-defined for any group structure, these measures are easy to compute using algorithms that we develop. Second, we use a unique dataset of Korean business groups (chaebols) to illustrate the computations of these new measures and, more importantly, to show that they contain important economic information as they are shown to be strongly correlated to valuation and profitability.
We start by providing a simple formula to compute the ultimate cash flow right of the controlling family. Although the special case of this formula for simple pyramids is well known (“the product of the cash flow stakes along the ownership chain”), the computation
1Pyramids are very common throughout the world. See, among others, Claessens, Djankov, and Lang (2000) for the evidence on East Asia, Faccio and Lang (2002) and Barca and Becht (2001) for Western Europe, Khanna (2000) for emerging markets, and Morck, Stangeland and Yeung (2000) for Canada.
2The literature sometimes uses the term ”business group” to refer to other types of corporate groupings, such as those in which the memberfirms are tied together by common ethnicity of the owners, interlocking directorates, etc. An example is the Japanese keiretsu, an organization in which individual managers have considerable autonomy in their ownfirms but coordinate their activities through the president council and a common main bank (Hoshi and Kashyap (2001)). Another example is the horizontal financial-industrial groups in Russia (Perotti and Gelfer (2001), p. 1604). In this paper, we focus on ”family business groups”, those in which memberfirms are controlled by the same family. As we will show later, Korean Chaebols are largely family controlled.
3Claessens, Fan, and Lang (2002) find that, in eight out of the nine Asian countries they study, the top 15 family groups control more that 20% of the listed corporate assets. In a sample of 13 Western European countries, Faccio and Lang (2002) find that in nine countries the top 15 family groups control more than 20% of the listed corporate assets. See also Section 6 for evidence of the importance of Chaebols for the Korean economy.
of ultimate cashflows rights in the presence of cross-shareholdings and loops is considerably more difficult because the number of ownership chains is infinite.
The method we develop involves “following” a dividend through all these ownership chains. We show that this can be easily done using simple matrix operations. The final formula requires only information about the direct stakes of the member firms as well as the direct stakes of the controlling family. This methodology can be applied to compute the position of a group in thefirm and to determine whether afirm is in across-shareholding or even in any general circular ownership pattern.
The position of a firm in the group can be thought of as the distance between the firm and the controlling family in terms of the group structure. For example, if a family holds only a direct stake in a firm, its position is equal to one. A firm that is controlled entirely through a stake held by another firm (i.e., controlled through a simple pyramid) has a position of 2. Besides these simple cases, our methodology allows us to compute the position of any firm, irrespective of how complex its ownership structure is. Cross-shareholdings are easy to compute manually when they consist of two firms (e.g., firm A owns shares in B, which owns shares in A). However, this case is relatively rare in Korean chaebols because of specific regulations (see Section 4). Importantly, our methodology allows us to identify cross-shareholdings of any arbitrary number offirms, and to measure how manyfirms belong to a given cross-shareholding loop.
Next, we tackle the issue of computing the voting right of the controlling family in each group member. The difficulty here is what fraction of the votes held indirectly through a group firm to assign to the controlling family. The common procedure in the literature has been to use the concept of weakest link (see. e.g., Claessens, Djankov, and Lang (2000)). Although this concept makes intuitive sense for simple pyramids, it is less intuitive —and not even well defined–for groups with extensive cross-shareholdings.
We propose two alternative measures that are based on two simple —albeit not uncontroversial— assumptions. First, we assume that a family obtains control of a firm when it holds more than a threshold, say T, of votes. Second, we assume that, if a family controls a firm, it owns the votes that this firm holds in other firms. With these two simple assumptions, we can determine, for a given control threshold T, the set offirms that a family controls. Even though applying this definition is sometimes circular (to determine whether you controlfirm A, you need to know whether you control B and its votes in A, but to know whether you control B, it is possible that you need to know whether you control A and its votes in B!), we can show that it is well defined for any group structure. Moreover, we provide a simple algorithm that can be used to find such a set.
Our two alternative measures are theconsistent voting rights (VR)and thecontrol thresh-old (CC). The first one depends on the threshold considered. After determining the set of
firms controlled by the family for the given threshold, the VR measure is simply the direct votes of the family plus the indirect votes held by firms the family control (for a threshold T).5 The CC measure is the maximum threshold consistent with family control of the firm. It has various advantages. First it is not dependent on any particular threshold. Second, it coincides with the weakest link measure in simple pyramids. This is appealing because for these structures, the weakest link measure is intuitive. Finally, it only requires computation
of the set of firms controlled by the family for various controlled thresholds. This can be easily done with the algorithm we propose.
As an application of our control measures, we compute the centrality of a firm in the group. The concept that we want to measure is how important afirm is for controlling other groupfirms. The centrality measure is computed as the average drop in CC (across all group
firms) when afirm is hypothetically eliminated from the group. Firms that own substantial stakes in otherfirms will have high centrality, and specially so if it has an important hierar-chical position in the group structure. For example, if firm 1 owns shares in firm 2, firm 1 is likely to be central. But centrality increases if firm 2 also holds shares infirm 3, because droppingfirm 1 from the group compromises the control of bothfirms 2 and 3.6
Importantly, none of the formulas that we compute require visualization of the group structure. In other words, the researcher does not need tofirst draw the group structure to compute the ownership variables. All the computations can be entirely automatized, and thus are easily implementable irrespective of the complexity of the group structure.
We apply these new measures to understand the ownership structure of Korean business groups (chaebols). Chaebols are an ideal object for our methodology, given the complexity of their ownership structures (more on this below). In addition, the political situtation surrouding chaebols in Korea allowed us to obtain extremely detailed ownership data on chaebol firms.7 Up until the 1990s, Korean chaebols were credited with being one of the most important factors in Korea’s rapid growth. This view appeared to change in the 1990s, as the chaebols began to be seen by some as an obstacle to growth. Too much political power (as evidenced by a number of corruption scandals), almost total control of product and financial markets, and excessive debt levels are some of the reasons why the chaebols were believed to be hampering growth. As a consequence of this political change, from the late 1990s the Korean government has been exerting pressure on the chaebols to slim their empires. Among other regulatory measures discussed below in Section 4, Korean regulators have considerably tightened the disclosure requirements for Chaebol firms. In particular, since 1998 the top Korean chaebols have to report their complete ownership information to the Korean Fair Trade Commission (KFTC). These reports include ownership and accounting data on private chaebol firms.
A quick look at the summary statistics of these groups reveal that they are highly com-plex, comprising on average of several dozenfirms with many layers and loops with more than twofirms. Consider for example Figure 6, which contains a slice of the ownership structure of the Hyundai Motor group in 2004. Even with the aid of the picture, it is difficult to un-derstand the links between thefirms. Of course, the task is even harder without the picture. However, it is straightforward to use our algorithms to compute the characteristics of all the
firms in this picture. For example, our calculations show that Hyundai Motor is the keyfirm for the control of the group (highest centrality), and they identify that Hyundai Motor, Kia Motor and INI Steel belong to a cross-shareholding loop with 3 firms in it (Hyundai owns shares in Kia, which owns shares in INI, which owns shares in Hyundai).
We compute the ownership variables for all Chaebol firms in 2003 and 2004, and provide
6Because this hierarchical aspect of centrality can only be captured with the variable CC, we use that variable to compute centrality instead ofVR.
a novel characterization of the average ownership structure of a Koreal Chaebol (depicted in Figure 7). There are roughly three layers in the Chaebol ownership structure. Some
firms (firms 1 and 2 in the Figure) are owned directly at the very top of the group, without ownership links to the other firms. The middle layer contains firms that belong to cross-shareholding loops, which typically contain three firms (firms 3, 4 and 5 in this example). The firms in this middle layer are more likely to be public, and they are larger and older than other Chaebol firms. The firms in this layer are also the firms that are likely to be central for the group control structure (i.e., they own substantial stakes in otherfirms in the bottom layer). In the bottom layer (firms 6, 7 and 8), we havefirms that are more likely to be private, smaller and younger. They are also less likely to own substantial stakes in other
firms (less central, less cross-shareholdings).
Provided with detailed ownership characteristics of all Chaebol firms, we proceed to correlate these variables with measures of profitability and valuation. We were able to obtain accounting data for most chaebol firms (including private firms), and stock market data for all those that are public.
In order to provide measures of profitability for Korean Chaebol firms, it is important to understand the effect that equity stakes held in other firms have on reported asset and profit figures. Essentially, if firm A owns shares in firm B, firm B’s equity and profits will affect reported asset and net income figures for firm A. Luckily, the financial statements after 2003 contain enough information to allow anyone to back out the exact amount by which accounting figures have been adjusted.8 We compute measures of operating assets and profits, which are defined as the asset and profit values that the Chaebol firm would have excluding the adjustments due to equity stakes held in other firms. These asset and profitfigures reflect the individual assets and profitability of each Chaebolfirm. We can then compute a measure offirm profitability by dividing operating profits by operating assets (we call this “operating ROA”).9
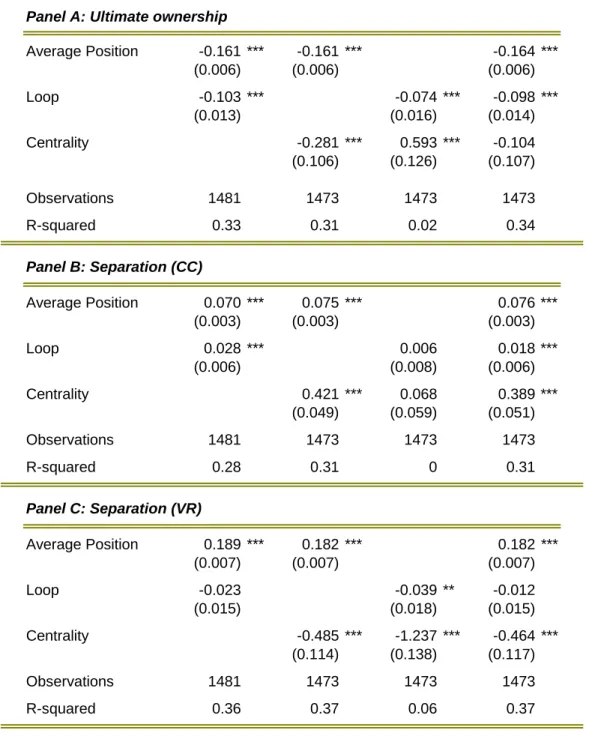
We regress operating ROA on ownership variables, controlling for basic firm character-istics such as size, age, industry and public status. The profitability regressions show that
firms that are central to the control structure of the group, and firms with lower ultimate ownership (those placed at the bottom of the group) have lower profitability than other groupfirms. There is also some evidence thatfirms in cross-shareholdings are less profitable, though this evidence is weaker. These correlations are also economically significant. Our benchmark calculations show that a one standard deviation increase in centrality reduces op-erating ROA by 0.01 (27% of the mean), while a one standard deviation increase in ultimate ownership increases operating ROA by 0.016 (39% of the mean).
The market valuations of (public) group firms is also related to the complex ownership variables that we measure in the paper. We compute three alternative measures of Tobin’s
Q (market-to-book ratios) using different definitions of market and book values of assets. These alternative definitions correspond to different levels of consolidation of the accounting
statements and of market values of equity. Irrespective of the definition of Q, wefind that
firms at the bottom of the group (higher average position and lower ultimate ownership) tend
8Before 2003 the data is only available from footnotes to thefinancial statements. This is the main reason why we focus the current draft on the 2003 and 2004 data only.
to havehigher valuations than other group firms (despite being on average less profitable). In addition, central firms and firms that belong to cross-shareholding loops carry lower market valuations than other group firms. Importantly, the negative correlation between loop, centrality andQbecomes even stronger after controlling for ultimate ownership and/or measures of separation between ownership and control. Thus, these valuation results are not explained by simple variations in ownership concentration. The correlation between centrality/loop andQis also economically significant. Afirm that is both central and is in a cross-shareholding loop such as Hyundai Motor in Figure 6 has on average a Q that is 14%
lower than the medianQ in the sample of group firms.
We also discuss some possible explanations for the negative relation between central-ity/loop and market valuations.10 In particular, we argue that the low valuation of central
firms could be due to shareholder’s anticipation of future negative NPV pyramidal invest-ments made by these firms, as suggested by Almeida and Wolfenzon (2006). In addition, these low valuations can also be a consequence of a lack of marketability of equity stakes held by centralfirms in other group firms (Longstaff, 1995).
The next section presents a short review of the literature. Sections 2 and 3 introduce our methodology to compute ownership variables for group firms. In Sections 4 and 5 we describe the legal and regulatory framework of Korean Chaebols, and the data that we use. In Section 6 we present the results that describe the ownership structure of Korean chaebols, and in Section 7 we relate the ownership variables to performance and valuation.
1
Related Literature
Existing literature on the effects of group ownership structure has focused on simple owner-ship variables such as whether firms are indirectly owned, and on separation between own-ership and control. Claessens et al. (2002) and Volpin (2002) provide evidence that firms in business groups organized as pyramids have lower Tobin’s Q than stand-alone firms and
firms organized in horizontal groups. Holmen and Hogfeldt (2004) suggest that this under-valuation is greater if the controlling shareholder has lower ultimate ownership. Claessens et al. (2002), Lemmon and Lins (2003), Lins (2003), Mitton (2002), and Joh (2003) re-port evidence that the separation of ownership and control is detrimental to performance. Bertrand et al (2002) use a sample of Indian business groups to show that group membership is harmful to performance because it provides incentives for the family to tunnel resources from the firms lower down in the pyramid to firms at the top. In a similar vein, Bae et al (2002) show in the context of Korea that the controlling families use acquisitions to benefit themselves at the expense of the minority shareholders.
The literature also examines the relationship between valuation andfirm membership in business groups, without distinguishing between pyramids and other types of groups. See Khanna and Rivkin (2001), Khanna and Palepu (2000), Fisman and Khanna (2000), and Claessens, Fan, and Lang (2002). Khanna and Palepu (2000), for example, find a positive effect of group membership in their sample from India. However, their effect is limited to the largest business groups.
Besides valuation and performance, the literature has studied other characteristics of business groupfirms. Aganin and Volpin (2005) describe the evolution of the Pesenti group in Italy and show that it was created by adding new subsidiaries to thefirms the Pesenti family already owned. One of their conclusions is that in Italy, business groups expand through acquisitions when they are large and have significant cash resources. Claessens, Fan, and Lang (2002) find that firms with the highest separation of votes and ownership (i.e., those owned through pyramids) are younger than those with less separation. Pyramidalfirms also seem to be associated with larger scales of capital investment. Attig, Fischer, and Gadhoum (2003) find evidence consistent with this implication, using Canadian data. Claessens, Fan, and Lang (2002) alsofind that in East Asia, groupfirms tend to be larger than unaffiliated firms. Bianchi, Bianco, and Enriques (2001)find similar evidence for Italy.
To sum up, previous empirical literature provides some evidence thatfirms owned through pyramids have lower valuations and profitability than other firms, and that these patterns might be due to the tunneling of resources out of firms in which the family holds low cash
flow stakes to other firms at the top of the group. However, the average effects of group
membership onfirm performance seem to be more ambiguous. There is also some evidence that firms that are owned through pyramids are smaller and younger than firms at the top of the group (those that own shares in otherfirms).
The relation between pyramidal ownership and performance is consistent with the tradi-tional view of pyramids, which suggests that pyramids allow the controlling family to achieve control of the firms in the group with a relatively small cashflow stake, thereby distorting incentives away from value maximization (see, e.g., Bebchuk (1999)).11 In contrast, Almeida and Wolfenzon (2006) argue that the negative correlation between pyramiding and perfor-mance might be due to a selection effect, namely that the types of firms that the family controls through pyramids might have inherently lower profitability thanfirms that are con-trolled directly by the family. Under this interpretation, the pyramidal structure itself is not the cause of the under-performance.12
Whether pyramids decrease performance or performance predicts pyramidal ownership is also likely to be important from a policy point of view. Although widely regarded as the engine of economic growth in earlier decades, business groups have more recently been blamed by politicians and commentators for the economic problems (slow growth, financial crises, etc.) affecting some regions of the world, in particular East Asia.13 Those against the busting up of business groups contend that these organizations substitute for missing
11Other benefits of groups may include the ability to prop up (inject money into) failing firms (Morck and Nakamura (1999) and Friedman, Johnson, and Mitton (2003)) and the use of a group’s deep pockets as a strategic tool in product market competition (Cestone and Fumagalli (2005)). None of these arguments considers the ownership structure of the business group. Regulatory or tax considerations might also help explain the creation of pyramids. For example, Morck (2003) provides evidence that taxes on intercompany dividends reduce the incidence of pyramidal structures.
12Consistent with this alternative story, Attig, Fischer, and Gadhoum (2003) show that low Tobin’s Q predicts membership in a pyramidal group.
markets (Leff, 1978, Khanna and Palepu, 1997, 1999).14
2
Ultimate cash
fl
ow rights: de
fi
nition and calculation
The definition of ultimate cash flow rights of the controlling family in a particular firm is the fraction of the dividends paid by that firm that is (eventually) received by the family. Because the ownership structures of business groups are usually quite complex, typically involving a fair number of inter-company holdings (e.g., pyramids and cross-shareholdings), only part of the dividends that the controlling family receives are due to its direct stake.
To incorporate the proceeds that arise due to the indirect holdings, we propose an algo-rithm (thedividend algorithm) that allows us tofollow the original dividend through group companies. Importantly, we are able to represent each stage in the dividend algorithm as a simple matrix operation. The matrices needed require information only about the direct stakes in each group firm. This allows us to easily automate the process and to dispense with the need to consider all the potential chains. Our method is general enough to ac-commodate any number of firms and any possible ownership structures (i.e., any possible configuration of inter-company holdings). To illustrate the use of the formula, we apply it to some examples.
In the last part of this section, we provide three additional applications of our dividend algorithm. First, we propose a formula tofind the position of afirm in a group. Second, we propose a way of identifying whether a particular firm is part of a cross-shareholding loop. This method can identify not only direct cross-shareholdings (i.e., A owns shares in B which owns shares in A), but also any form of circular holdings (i.e. A owns B which owns C which owns A), irrespective of the number offirms in the loop. Finally, we propose a formula that relates the stand-alone value of all groupfirms (the value thefirms would have without their stakes in otherfirms) to their observed market values.
2.1
The dividend algorithm
The algorithm follows a dollar of dividend paid by a firm. In the first stage, we assume that the firm under consideration pays one dollar in dividends. We then use the direct stakes of owners of thisfirm to compute the amount received by the family and the amounts received by other groupfirms. In the second stage, we assume that groupfirms that received a dividend in the first stage pay it out in full as dividends. Then, we again compute the amount received by the family and the amounts received by groupfirms. We continue with this procedure for an indefinite number of stages. Finally, we add the amounts received by the family in all stages.
Example 1: A simple pyramid
14Other benefits of groups may include the more active operation of an internal capital market ((Hoshi, Kashyap, and Scharfstein, 1991; Perotti and Gelfer, 2001), the ability to prop up (inject money into) failing
F
@ @ R
f
1²
±
¯
°
Firm 1
@ @@R
s
12²
±
¯
°
Firm 2
@ @@R
s
23²
±
¯
°
Firm 3
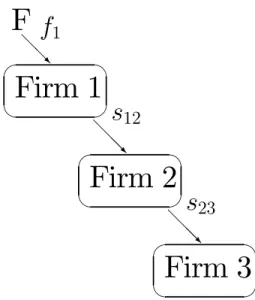
Figure 1: A simple pyramid
Figure 1 shows a pyramid with no cross-shareholdings. The family owns a fractionf1 of
firm 1, firm 1 owns a fraction s12 in firm 2, and firm 2 holds a fraction s23 in firm 3. We
compute the ultimate cash flow stake of the family infirm 3.
The algorithm calls for following a dollar paid by firm 3. In stage 1, firm 3 pays one dollar in dividends and firm 2 receives s23 dollars. The family does not receive anything at
this stage. In stage 2,firm 2 pays out the cash it received,s23. Firm 1 receives a fractions12
of the dividend ors12s23. In stage 3, firm 1 pays dividends ofs12s23 and the family receives
a fraction f1 or f1s12s23. At this point, all firms in the group have no part of the original
dollar paid by firm 3, and so we can stop. Adding the dividends the family received in all stages, we obtain that its ultimate cashflow stake infirm 3 is
u3 =f1s12s23
(as expected!).
Example 2: Cross-shareholding
Consider the structure in Figure 2. The family has a direct stake of f1 andf2 infirms 1
and 2, respectively. Also, firm 1 holds a stake of s12 of firm 2, and firm 2, in turn, holds a
stake of s21 infirm 1. We compute the ultimate cashflow stake of the family infirm 2.
The algorithm proceeds as follows. In stage 1, firm 2 pays one dollar in dividends. The family receives f2 and firm 1 receives s12. In stage 2, firm 1 pays out the s12 dollars it
received. Now, the family receives an additional f1s12 and firm 2 receives s21s12. In stage
3, firm 2 pays out the s21s12 it received. The family receives f2(s21s12) andfirm 1 receives
s12(s21s12).As it is clear, we can continue doing this procedure indefinitely. From the pattern
that emerges, we can compute the total amount received by the family by:
u2 =f2+f1s12+f2(s21s12) +f1s12(s12s21) +f2(s21s12)2+f1s12(s12s21)2+... (1)
= f2
1−s21s12
+ f1s12
F
@ @ @@Rf
2 ¡ ¡ ¡ ¡ ªf
1 ² ± ¯ °Firm 1
² ± ¯ °Firm 2
-¾s
12s
21Figure 2: Cross-shareholdings
As can be seen from the above, doing this process manually is tedious, even for a small group with 2 firms. Because business groups have many dozen —and sometimes over a hundred— firms and extensive inter-corporate holdings, the manual procedure we have de-scribed —although feasible— is not practical. To automate this algorithm, we turn to the derivation of the general formula in the next section.
2.2
A simple formula
Consider a business groups with N firms. With the direct ownership information, we con-struct a matrix of inter-corporate holdings as follows:
A= ⎡ ⎢ ⎢ ⎢ ⎣
0 s12 ... s1N
s21 0 ... s2N
... ... ... ...
sN1 ... sN N−1 0
⎤ ⎥ ⎥ ⎥ ⎦
wheresij is the stake offirmiinfirmj. In other words, column j contains the stakes of the
corporate direct owners offirmj.
We also construct a vector of the direct stakes of the family in each of the N firms
f = ⎡ ⎢ ⎢ ⎢ ⎣ f1 f2 ... fN ⎤ ⎥ ⎥ ⎥ ⎦ .
Proposition 1 The ultimate ownership of the family in each of the n firms is given by
u= [u1 u2 ... uN]0:
u0 =f0(IN −A)−1 (2)
We use example 2 to illustrate how the formula is derived. Brioschi, Buzzacchi, and Colombo (1989) derive a similar formula using a different approach. To the best of our knowledge, our derivation of this formula (i.e., using the dividend algorithm), is new. Im-portantly, all the applications in the following section are based on the dividend algorithm.
Example 2 (revisited)
Take the group in Figure 2. In this case the matrix of intercompany holdings is:
A=
∙
0 s12
s21 0
¸
,
andf = [f1 f2]0.Suppose we want to compute the ultimate ownership of the family in firm
2. According to the algorithm we need to follow a dollar of dividend paid by firm 2. We write the dividend that all firms pay in a particular stage in vector form. Thus, the initial dividend is given by:
d2 =
∙
0 1
¸
.
That is, firm 1 pays no dividend and firm 2 pays a dividend of 1. In the rest of the paper, we letdi be the vector of zeroes with a 1 in theith position.
We can now rewrite the computations we followed in the previous section in matrix form. Stage 1 is as follows. The dividends paid ared2.The family receivesf0d2 =f2 and corporate
owners receive Ad2 = [s12 0]0 (i.e., firm 1 receives s
12 and firm 2 receives 0). In stage 2,
corporate owners pay out the full amount they received in stage 1, i.e., Ad2 = [s12 0]0. The
family receives f0Ad2 = f1s12 and corporate owners receive A(Ad2) = A2d2 = [0 s21s12]0.
In stage 3, the dividend is A2d
2. The family receives f0A2d2 and corporate owners receive
A3d 2.
A pattern emerges: starting from dividendd2and afternrounds of dividends, the fraction
of the original dollar held by corporate owners is And
2 and the family receives in this stage
f0An−1d2.The same algorithm can be repeated for any firmi in any group with a matrix of
direct corporate holdings, A, and a vector of family direct holdingsf,to obtain the ultimate ownership,ui, which is the sum of the dividends that the family receives in all stages:
ui =
∞
X
n=1
f0An−1di =f0
à ∞
X
n=1
An−1
!
di =f0(IN −A)−1di.
This shows how the formula is derived.
2.3
Applications
We present three different applications of the methodology developed.
2.3.1 Firm’s position in a group
given firm along a particular path. This distance is simply the number of firms along the path.
We first define the shortest distance (sd) among all possible paths between the family and a particular firm:
Definition 1 Forfirms in which the family’s ultimate cashflow right is positive, the shortest distance, sdi, from the family to firm i can be found by using:
sdi = min{n | n≥1 and f0An−1di >0}.
Recall that f0An−1di is the dividend that the family gets in stage n from a dollar that
originated infirmi. If a family owns a direct stake infirmi, it will receive a dividend in the
first stage. Thus, f0An−1d
i is strictly positive for n= 1, which is then the shortest distance
as expected. If there are twofirms separating the family fromfirmi(e.g.,firm 2 in Figure 1), thefirst timef0An−1d
i is positive is forn= 2, which, as expected, if the shortest distance.
Nevertheless, the shortest distance might not be the most relevant measure of position because there could be several different paths between the firm and the family and there is no particular reason to choose the shortest path. In order to compute a measure of position that takes all paths into account, we define the average distance (ad) of afirm as the weighted average of the distance along all possible paths. The weights we use are the fraction of the ultimate cashflow rights contributed by the particular path. As before, this measure can be easily computed as follows.
Definition 2 The average distance, adi, from the family to firm i can be found by using:
adi =
∞
X
n=1
nf
0An−1d
i
ui
Example 4: Position in a simple pyramid
Consider the group in Figure 1. The position of the firms is straightforward in the case of pure pyramids. The shortest distance between firm i and the family in this example is equal to i(sdi =i). Because there is only one path for eachfirm, these are also the average
distances for thefirms (adi =i).
Example 5: Position in a more complex pyramid
Consider now a slightly more complex example. Specifically, take the group in Figure 2, but assume that s21 = 0. In this case firm 2 is owned both directly (through the stake f2),
and indirectly, through the stake s12. So we have sd2 = 1, and:
ad2 = 1
f2
f2+f1s12
+ 2 f1s12 f2+f1s12
,
which is simply a weighted average of the direct path, and the indirect one through firm 1. Iff2 is very small, for example, then it is possible thatad2 is close to2, despite the fact that
the shortest distance is equal to one.
2.3.2 Identifying general cross-shareholdings
We can also use the algorithm and its matrix representation to check whether a given firm is part of a circular ownership pattern and to compute the length of such loop.
Definition 3 Let
loopi = min{n | n≥1 and d0iA nd
i >0},
then firm i is in a loop if and only ifloopi <∞ and the number of firms in the shortest loop
firm i is involved is given by loopi.
Recall that And
i is a vector of the cash held by each group firm after n stages of the
algorithm from a dollar that originated in firmi. Because we are interested in the cash held byfirmi itself, we pre-multiply byd0
i to get the ith element.
The idea is simple. If we start from a dollar paid by firm i and after n stages we see money reappearing in this firm, then it must be that the firm is part of a loop. Also, the number of stages needed for the money to reappear for thefirst time in firm imeasures the number of firms in the shortest loop.
Example 6: Detecting circular ownership patterns
Let’s compute the loop variable for firm 2 in the group of Figure 2. The first dividend is d2, corporate owners get Ad2 = [s12 0]0, and firm 2 gets d0
2Ad2 = 0. In the second stage
group firms pay dividends ofAd2 = [s12 0]0, corporate owners receiveA2d2 = [0 s21s12], and
firm 2 gets d0
2A2d2 =s21s12 >0. Thus, loop2 = 2. This implies, as we were expecting, that
firm 2 is in a loop and that the loop has 2 firms in it.
2.3.3 The relation between stand-alone value and market value
The market value of firms in a group can be decomposed into the stand-alone value and the value of the stakes in otherfirms. LeteT
i be the total market value of the equity of firmiin
a group and leteS
i be the value of the equity as if thefirm held no stakes in otherfirms (the
“stand-alone” value of equity). The following equation follows:
eT i =e
S i +
X
j
sijeTj
Expressing this equation in matrix form for all the firms in the group leads to
eT =eS +AeT
or
eS = (IN −A)eT
where eT andeS are the vectors of total market value of equity and stand alone value of
equity.15
F
@ @ R
21%
²±
¯
°
Firm 1
@ @@R
51%
²
±
¯
°
Firm 2
Figure 3: A very simple pyramid
3
Computing Control Rights
The computation of control rights in a complex group is challenging because it is not clear what fraction of the votes held by intermediate firms is controlled by the family. We start by discussing the weakest link idea that is frequently used in the literature. As we will show, this methodology is not readily implementable —and sometimes not even well defined— in groups with extensive cross-shareholdings. We discuss two alternatives to the minimum link method, including a novel definition of control rights that we call critical control threshold (CC).
3.1
The weakest link
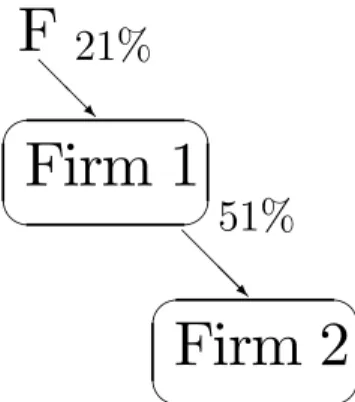
Consider the following example of a simple pyramid in Figure 3. The family holds a direct stake of21% infirm 1, and firm 1 holds a51% stake in firm 2. Clearly, the family controls
21% of the votes of firm 1 through its direct stake. But what about firm 2? The weakest link method assigns the minimum voting stake in the chain of control. That is, the family is assumed to hold 21% of the votes of firm 2 as well. For simple pyramids, this measure is intuitive: Because control of firm 2 is obtained through firm 1, it cannot be the case that the family’s degree of control is firm 2 is higher than that infirm 1.
3.2
Two alternative measures
We now discuss two alternative measures of voting rights, which are easily implementable in groups with cross-shareholdings and are derived from two simple assumptions about control. Both measures require that we first determine the set of firms that the family control for a given control threshold T.
3.2.1 The set of firms controlled by the family
To compute the set of firms controlled by the family, we make two assumptions:
Assumption 1 A family controls a firm if and only if it holds more thanT votes in it.
Assumption 2 The votes that a family hold in a firm are the sum of its direct votes plus all the direct votes of firms under family control, where control is defined in Assumption 1.
This definition of control is a combination of the idea of a control treshold (Assumption 1), plus the assumption that, if a family controls afirm, it controls the votes that this firm holds on otherfirms.
A potential problem with this definition is that, for groups with loops, it is impossible to implement this definition sequentially. Consider, for example, the group in figure 2. To
figure out whether the family controls firm 2, we need to compute whether the family has more than T votes in this firm. The family holds some votes directly and might also hold indirect votes throughfirm 1. However, we can only assign the votes offirm 1 to the family if the family controls firm 1. Therefore, we need to determine whether the family controls
firm 1. As it is clear, in order to determine this we need to know whether the family controls
firm 2. But this was the question we started with!
The following proposition establishes the formal condition that the set offirms controlled by the family must satisfy (for a given control threshold T). Suppose we start the analysis with a setN, which contains all candidatefirms that could be controlled by the family. This set can represent all firms in a country, or a pre-identified subset of thosefirms.
Proposition 2 For a given treshold T, the set of firms controlled by the family is given by:
C(T) ={i∈N :fi+
X
j∈C(T), j6=i
sji ≥T}. (3)
In other words, the set C(T) is the solution to a fixed point problem.16 Finding such a
fixed point might not be easy, specially for complex groups.
Example 7: Firms controlled by the family in a group with cross-shareholdings
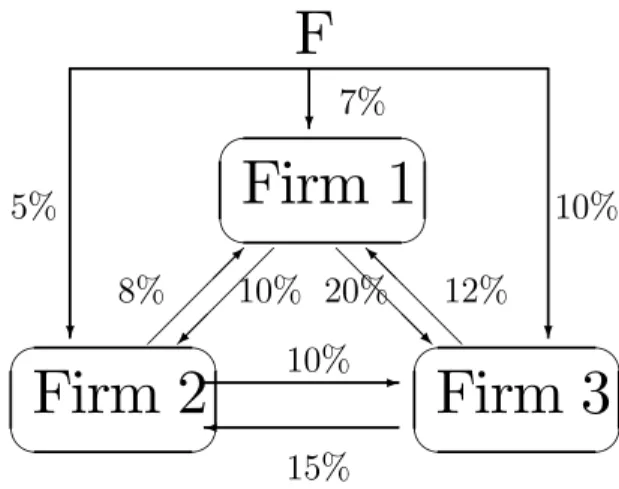
Consider the group in Figure 4 and assume thatT = 25%.Let’s try to determine whether
firm 3 is controlled by the family. The family holds a direct stake of 10% in this firm. In addition, firms 1 and 2 have stakes of20% and 10%,respectively. Thus, we would conclude that the family controlsfirm 3 if it controlledfirm 1 (since10% + 20%>25%). However, we
16LetF(X) ={i∈N :f
i+ P
j∈X, j6=i
F
?7% ? 5% ? 10% ² ± ¯ °Firm 1
@ @@@R
20% @ @ @ @ I 12% ¡ ¡ ¡ ¡ ª 10% ¡¡ ¡¡µ
8% ² ± ¯ °
Firm 2
² ± ¯ °Firm 3
-¾ 10% 15%Figure 4: A complex group with many cross-shareholdings
have not established yet whether the family controls firm 1. If we try to establish this, we run into a circular argument, since in order to determine whether the family controlsfirm 1, we need to establish whether it controls firm 3! (without control of firm 3, the most votes the family can control in firm 1 is 7% + 8% = 15%).
Fortunately, there is a simple algorithm that can be used to find C(T) in any situation. Wefirst provide a formal definition of the algorithm and then we explain how it works.
Definition 4 (Algorithm) Let the sequence of sets S(0) ⊇ S(1) ⊇ S(2)... be defined by
S(0) =N, and S(n+ 1) ={i∈S(n) : fi+ P
j∈S(n), j6=i
sji ≥T}.
The idea of this algorithm is to start with all the firms, S(0) = N.In the first stage, we assume that the family controls all thefirms and we drop the firms in which the direct and indirect stake of the family is belowT.This procedure generatesS(1).Next, we assume that the family controls only the firms in S(1) and again drop from S(1) the firms in which the direct and indirect stake of the family is belowT (of course, we only consider indirect stakes of firms that are inS(1)). This generatesS(2). We can repeat this algorithm a number ]N
of times to arrive at S(]N). This last set is important in light of the following Proposition.
Proposition 3 S(]N) satisfies condition 3.
The proof of this proposition in the Appendix. Proposition 3 is important for two reasons. First, it shows that the outcome of the algorithm generates what we are looking for: the set offirms that the family controls for a given thresholdT.Second, because the set S(#N)can always be computed (after all, #N isfinite), Proposition 3 shows that there always exists a set that satisfies condition 3. In other words, our notion of the set offirms controlled by the family is well defined.
A property that simplifies the algorithm is that if S(n) = S(n+ 1) for n < ]N then
S(]N) = S(n). This means that we can stop the algorithm the first time we do not drop a
Example 7 (revisited)
Let’s now apply the algorithm to the group of Figure 4. We first assume that the family controls the three firms, S(0) = {1,2,3}. Next we compute the voting rights. The family holds27%of the votes infirm 1 (7%+8%+12%),30%of the votes infirm 2 (5%+10%+15%) and40% of the votes infirm 3 (10% + 20% + 10%). Since all three quantities are larger than
25%, we do not drop any of the firms and hence S(1) ={1,2,3}. Because we did not drop a firm, it is the case that S(3) =S(1) ={1,2,3}. By Proposition 3,C(25%) ={1,2,3}
Let’s now apply the algorithm to computeC(30%).We letS(0) ={1,2,3}.As before, we get that the family holds27%, 30%, and40% infirms 1, 2, and 3, respectively. Because the votes infirm 1 are below the threshold, we drop it and so S(1) ={2,3}. We again compute the votes assuming the family controls firms 2 and 3. Under this assumption, we get that the family controls20%infirm 2(5% + 15%) and20%infirm 3(10% + 10%).We drop both
firms because the votes of the family fall below the threshold. As a result,S(2) =∅.Because we can no longer dropfirms, it must be thatS(3) =∅.By Proposition 3,C(30%) =∅.That is, the family controls no firm for a control threshold of 30%.
Before defining our two measures of control rights, it is important to note that there might be multiple sets that satisfy condition 3. For example, we showed in Example 7 that
C(25%) = {1,2,3}. However, the null set also satisfies condition 3 for the same control
threshold. To see this, suppose that the family controls no firms, then its voting rights in
firms 1, 2 and 3 are 5%, 7%, and 10%, respectively. Note that all of them are below the threshold of 25%, confirming that the family does not control any of these firms.
Because in the case of Korea the firms with which we start (the set N) have already been pre-classified as members of the chaebol, we would like to choose the set that satisfies condition 3 and at the same time has the maximum number of firms. Fortunately, we can prove the following Proposition.
Proposition 4 Consider all possible sets offirms that satisfy condition 3 for a given control threshold T: C1, C2, . . . , CM. The following holds: S(]N) =
M
[
i=1
Ci.
This Proposition of important for two reasons. First, it tells us that there is a unique set that has the maximum number of firms over all the sets that satisfy condition 3. This is important since it removes the arbitrariness of picking a set among many. Second, the proposition tells us that the outcome of the algorithm is precisely the set we are looking for.
3.2.2 Consistent voting rights
We use the set offirms controlled by the family to suggest a simple measure of control rights
Definition 5 Given a thresholdT,the consistent voting rightsof the family infirmi∈C(T)
are defined as:
V Ri(T) =fi+
X
j∈C(T), j6=i
In words, to find the family’s sum of votes in firm i we simply sum the direct votes held by the family in firm i with all the indirect votes held by other firms that belong to
C(T). The resulting distribution of voting rights,{V R1(T), V R2(T)...}isconsistent with the
control threshold T, in the sense that V Ri(T) ≥ T for all i. For example, in the group of
Figure 4 we would have{V R1(T), V R2(T), V R3(T)}={27%,30%,40%}, for T ≤27%.
3.2.3 Critical control threshold
Our second measure of control rights is as follows.
Definition 6 For any firm i∈N, the critical control threshold is given by
CCi = max{T | i∈C(T)} (4)
The critical control threshold is thehighest control threshold that is consistent with family control of firm i. In other words, if the control treshold were higher than CCi, thenfirm i
would not be part of the set of firms controlled by the family.
Several observations are in order. First, notice that in Figure 3 the critical control thresholds are 21% for bothfirms. We can think of CC as a well defined measure of control rights that coincides with the weakest link measure for simple pyramids. This is important because the CC measure respects an intuitive idea about control: If a family controls firm 2 through firm 1, its control of firm 2 cannot be higher than that for firm 1. The consistent voting rights measure does not satisfy this simple property as it is evidenced in the example above.
Second, the advantage of the CC measure is that it is based on the same algorithm of section 1. In order to computeCC for any arbitrary set offirms, we simply run the algorithm of section 1 sequentially with increasingly higher control thresholds, and we keep track of the threshold T at which each firm is dropped from the set C(T). The routine can be entirely automated, and thus dispenses with the need for the researcher to draw the group structure and examine all (possibly infinite) links.
Third, CC is a measure of control rights that is independent of the particular control threshold T. This is convenient because there is no agreement about what is a reasonable value forT.
In order to further illustrate the CC definition, we consider an additional example.
Example 8: CC for a pyramid with multiple chains
Consider the group in Figure 5. The family holds a 25% stake in firm 1, which holds a
40% stake infirm 2. The family also holds a 10% direct stake infirm 2. Thus, there is both a direct chain of control leading to firm 2, and an indirect one going through firm 1.
In this example, our methodology would produce the following numbers:
{V R1(T), V R2(T)}={25%,50%},for T ≤25%
{CC1, CC2}={25%,25%}
F
@ @
@@R
10%
¡ ¡ ¡ ¡ ª
25%
²
±
¯
°
Firm 1
²
±
¯
°
Firm 2
-40%
Figure 5
is an indirect link throughfirm 1, with minimum link equal to25%, and a direct link of10%, yielding a voting stake of 35% in firm 2.
3.2.4 An application of CC: measuring the centrality of a firm for the control of the group
We can use the CC measure to easily calculate a statistic that summarizes how important a given firm is for the control of the overall group. For example, take the group in Figure 5. In this example, firm 1 is important for the control of the group (because firm 1 holds a significant stake in firm 2), while firm 2 is not (because it does not hold shares in firm 1). An easy way to capture this difference is to drop both firms (one by one) from the group’s ownership matrix, and then calculate the decrease in CC for the other groupfirms. For example, if firm 2 is dropped from Figure 5, CC1 is unchanged. In contrast, if firm
1 is dropped, CC2 goes down from 25% to 10%. These calculations suggest the following
definition for afirm’s centrality in the group control structure:
Definition 7 We define the centrality of a firm i as:
centrali =
P
j6=i
CCj −P j6=i
CC−i j
]N−1 , (5)
where CCj−i is the critical control threshold of firm j, computed as if firm i held no shares
in the other group firms.
In words, we compute the centrality of firm i as the average decrease in CC across all group firms other than firm i, after we exclude firmi from the group. This formula, as the previous ones, can be implemented for any group structure.
4
Korean Chaebols: De
fi
nition and Regulatory
Frame-work
A “Chaebol” is a South Korean’s business group consisting of manyfirms in diverse business areas that are owned and controlled by family members.
4.1
Regulatory Framework for Chaebols
Chaebols are mainly regulated by laws pertaining, though strange, to competition policies. This contrasts with legal regimes addressing regulation of corporate groups in other coun-tries: laws relating to holding companies in the US, a specialized law of corporate groups, Konzernecht, in Germany, and special provisions addressing group-related issues in European company laws.17 Although the main purpose of regulating business groups in other coun-tries is to protect creditors and minority shareholders against the opportunism of controlling shareholders, its main purpose in Korea is to deter excessive concentration of economic power into a small number of large companies. Lacking a legal regime to address concentration of economic power, Korea has relied on the Monopoly Regulation and Fair Trade Act (hereafter just Fair Trade Act or FTA). The government agency to oversee the FTA is the Fair Trade Commission (FTC) that was established in 1981 along with the law.
The legal expression for chaebol is ‘Large Business Group,’ which is precisely defined in the FTA. The business group is legally designated based on the size, the size being the combined total asset of affiliated companies in the group.18 From 1987 to 2001, the FTC designated annually the 30 largest chaebols.19 Thefirms in the designated 30 chaebols were prohibited from cross shareholdings and also subject to limitations on equity investment in the domestic firms. From 1998, immediately after the outbreak of the financial crisis, these
firms were also prohibited from cross debt guarantees among affiliated companies. From 2002,
the FTC changed its scheme of designating chaebols. The FTC first designates a group of chaebols that are prohibited from cross shareholding and cross debt guarantees. Legally, these chaebols are termed ‘business groups subject to limitation on cross shareholding and cross debt guarantees.’ Currently, these are business groups with the combined assets greater than two trillion won.20 Among these business groups, very large ones are further ‘subject to ceiling on total equity investment in other domestic companies.’21 In our empirical study, chaebol hereafter refers to those family-controlled business groups subject to legal limitations on cross shareholding and cross debt guarantees.
17For different legal regimes addressing business groups in different countries, see Kraakman et. al. (2004), 18Forfinancial and insurance companies of a group, equities replace assets in calculating the total asset of a group. The equity in the FTA refers to paid-in capital or owners’ equity, whichever is larger.
19Thus, the identity of 30 chaebols changed slightly every year.
20Based on the won/dollar exchange rate of 946 on March 9th, 2007, two trillion won amounts to 2.1 billion US dollars.
4.1.1 Who are the legal members of chaebols (Inclusion requirements)
A chaebol in the FTA is defined as a business group where “an ‘identical person’ de facto controls memberfirms’ businesses.” An identical person is rather broadly defined to include a controlling shareholder and his or her ‘related persons’ which in turn includes relatives and affiliated companies. There are two criteria for a de facto control of a company called ‘affiliated company’: de facto ownership of more than 30 per cent, excluding preferred shares, of a company and de facto exercise of controlling influence on a company. The latter criterion, de facto exercise of controlling influence, in turn is further detailed to include cases of an exchange of directors and managers and also substantial business transactions between a
firm directly controlled by an identical person and the company in question. Because this criterion of ‘controlling influence’ is very broadly interpreted, some companies legally belong to a group even though neither families nor other affiliated companies own shares of those companies.
4.1.2 Legal restrictions on chaebols
With the exception of a few business groups with a holding company structure, a business group or chaebol itself is not a legal entity.22 Once designated by the FTC as a large business group, however, the component firms in the group are subject to a host of legal restrictions that are intended to prevent concentration of economic power. The five major regulations for this purpose are as follows.
Limitations on cross debt guarantees Non-financial affiliates cannot provide other
affiliated companies with financial guarantees for credits supplied by domestic financial in-stitutions. The credits include loans,financial guarantees and underwriting of liabilities such as corporate bonds. Cross debt guarantees were allowed until1997. Witnessing a series of collapses of chaebols, the government introduced this regulation in 1998, immediately after thefinancial crisis of 1997.
Prohibition of cross shareholding The Company Law in Korea disallows cross share-holding if a parent company holds more than 50% of a subsidiary company. Even without a parent-subsidiary relationship, voting rights are restricted for those cross shareholdings exceeding a ten per cent level. The FTA applies a much more strict rule to chaebol com-panies. Cross shareholding among chaebol’s affiliates is prohibited. Financial institutions of chaebols are exempt from this regulation, if they invest other people’s money in affiliated company shares. These finance companies of chaebols, however, are subject to the following regulation intended to prevent moral hazard.
Restriction of voting rights of shares held byfinancial institutions Financial insti-tutions may not exercise voting rights of shares of domestic companies in the same chaebol. There is an important exception which has been subject to recurring debates. For a listed affiliate, financial institutions can exercise voting rights in events such as election of direc-tors, amendment of corporate charters, and M&As, but even for these issues the voting rights exercisable by an ‘identical person’ including financial institutions cannot exceed 30 per cent.
Ceiling on the total equity investment in domestic companies A member company of chaebol subject to this particular regulation (currently, chaebols with assets grater than six trillion won) cannot invest more than 25 per cent of its equity in other domestic companies. This regulation, unique and very controversial in Korea, was introduced in 1987 when the Korean government formally started to introduce ‘chaebol regulations.’ As such, it is viewed by the Korean FTC as a very critical tool for controlling excessive expansion of chaebols through pyramid ownership structures.23 This regulation was repealed in February 1998, immediately after the outbreak of thefinancial crisis, to facilitate corporate restructuring of chaebol companies. Witnessing a reoccurrence of rampant expansions of chaebol and facing a growing public criticism against it, the government reintroduced this regulation in April 2001.24
This regulation has been one of the most controversial chaebol-related regulations in Korea. Chaebols argue that this regulation hinders active corporate real investments. The Korean FTC reacts that it does hinder a reckless expansion of chaebol families’ empire, but not valuable investment projects given a variety of exemptions and exceptions.25 Fac-ing strong objections from the chaebol community while corporate investments had been sluggish, the government introduced in the FTA the so called ‘graduation standards’ of the said regulation. If a chaebol meets one of the graduation standards that hinge upon good governance practice and desirable ownership structure, the chaebol becomes exempt from the regulation.
Disclosure requirements Intra-group transactions are also regulated by the FTA. There are two elements in this regard. When a chaebol affiliate that is subject to limitations on cross debt guarantees and cross shareholdings engages with another member firm in a transaction of an amount greater than either ten percent of the paid-in capital or ten billion won, it has to be approved by the board and thereafter disclosed. In addition, even a private company in a chaebol has to disclose all the major transactions that have potential impact on ownership, governance, financial conditions, and the long term future of the business.
23The Korean company law disallows non-voting common stocks or dual class stocks.
24Thus, there was a window of three year period during which chaebol was not subject to this particular restriction on equity investment in affiliated companies.
5
Data Description
This section describes the sources for the ownership, accounting and financial data that we use in this study.
5.1
Ownership Data
The ownership data of our study are from Korean Fair Trade Commission (hereafter KFTC). These data contain the stock ownership information for the largest 30 business groups from 1998 to 2001 and the large business groups subject to regulations on cross-shareholding and debt guarantee of affiliates of the same group from 2002 to 2004, which are designated by KFTC. As explained above, KFTC has assigned and supervised the largest 30 business groups from 1987 to 2001 and the large business groups subject to prohibitions on cross-shareholding and debt guarantee from 2002 to now based on the Monopoly Regulation and Fair Trade Act(hereafter Fair Trade Act) and its enforcement ordinance.
The largest 30 business groups until 2001 and the business groups under cross-shareholding and debt guarantee prohibition after 2002 should report the status of affiliate shareholders and persons with special interest and the mainfinancial status on April 1 to KFTC until the end of April each year, following Fair Trade Act and its enforcement ordinance. Among the ownership data andfinancial data which KFTC has kept, we obtained the data for the period 1998-2004. However, we study only business groups with the ownership of a natural man (i.e., family business groups), exclude other business groups such as government-controlled business groups. The ownership structures of 800 companies of 30 groups in 1998, 681 com-panies of 30 groups in 1999, 518 comcom-panies of 25 groups in 2000, 590 comcom-panies of 25 groups in 2001, 638 companies of 31 groups in 2002, 739 companies of 35 groups in 2003, and 776 companies of 36 groups in 2004 are available. The total size of firm-years is 4742.
The ownership status of the affiliates and the person with special interest of each firm in the above ownership data of KFTC is recorded relatively in detail. At the time of statement of the shareholder status to KFTC each year, the business group under cross-shareholding and debt guarantee prohibition must have access to KFTC online and report that. In our ownership data, the shareholders are categorized into 7 types; family owner, the relatives of family owner, nonprofit affiliate, affiliate, group officer, treasury stock, and others. In
addition, the name, the holding quantity, and the ratio of common stocks and preferred stocks of each individual shareholder are recorded. For example, let us look into the ownership information of Samsung Corporation in Samsung group. In 2004, family owner held 1.42%, relatives of family owner 0.01%, two nonprofit corporations 0.23%, four affiliates 9.64%,
thirty seven group officers 0.15%, Samsung Corporation itself 2.20%, and others 86.52% of its common stock.
5.2
Financial data
the ownership sample above, and KIS covers 790firms and 2780 year-firms. In sum,financial data of 3741 firm-years (which amounts to 73.25% of the firm-years in the ownership data) are available.
As explained below, this draft of the paper uses only 2003-2004 data. The reason is that the accounting data available in KLCA and KIS databases has been subject since 1999 to an “equity method” rule that adjusts assets and profits of group firms to take into account profits and equity owned in other group firms. Starting in 2003, the data contain enough information to allow us to back out the assets and profits of each individual Chaebol firm in isolation. However, before 2003 the data can only be obtained in the footnotes of the
financial statements.
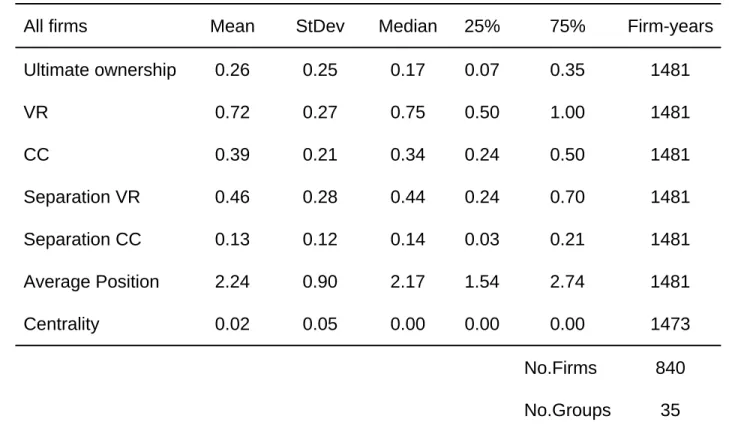
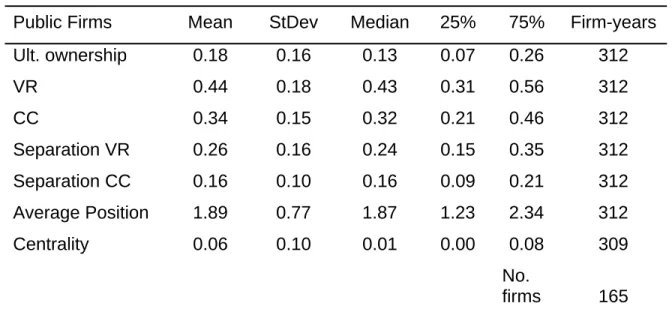
Our sample contains 1500 firm-years of ownership data in 2003 and 2004. Out of these
firm-years, the accounting data is available for 1229 of them.
6
Ownership Structure of Korean Chaebols
In this section we provide a detailed description of the ownership structure of the major Korean chaebols in the period of 2003 and 2004. Before we do that, we present some basic statistics that show the importance of chaebols for the Korean economy, and we present an example of the ownership structure of one of the largest chaebols (Hyundai Motor).
6.1
The Chaebols’ In
fl
uence in the Korean Economy
As of April in 2004, there were 41 large business groups designated by the Korean FTC. Among these 41 business groups, 36 groups are controlled by families. As noted already, these 36 family controlled groups or chaebols are the subjects of our analysis.
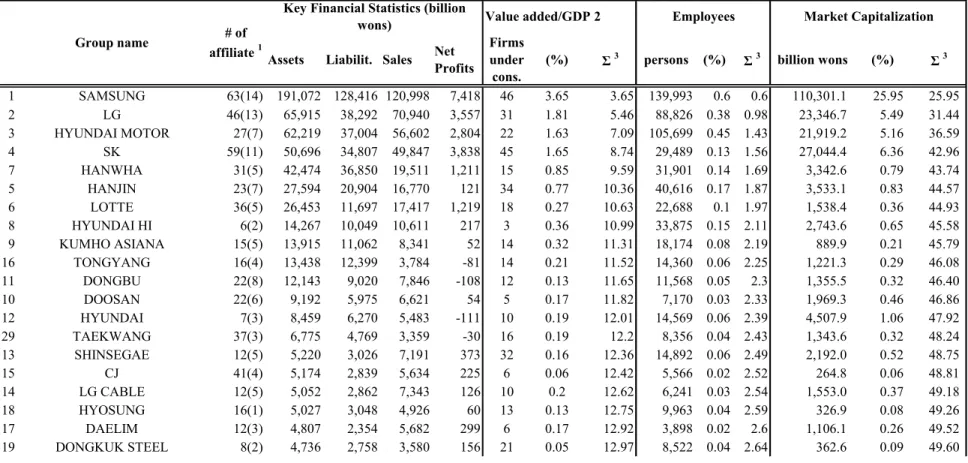
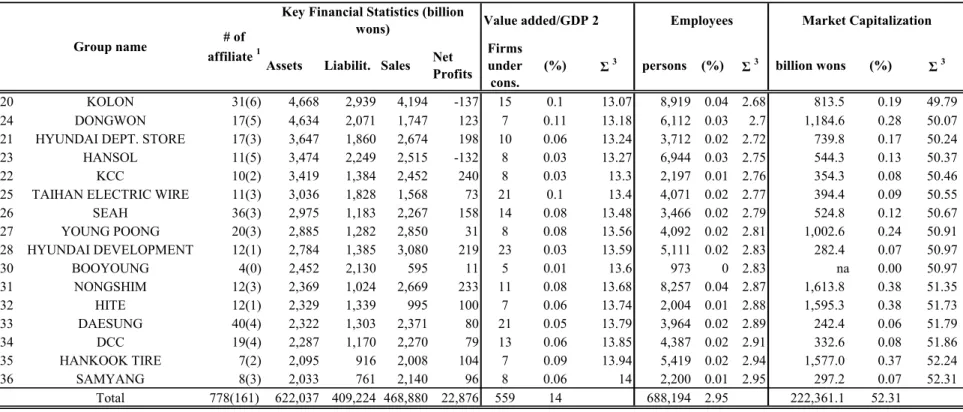
Table 1 shows that these 36 chaebols have 778 affiliated companies, among which 168 companies are listed. The total assets and the total sales of these groups are 622 trillion won and 469 trillion won, respectively.26 To assess the economic influence of these chaebols, we examine the value added, the employment and the market capitalization. For value added, we examine only 559 manufacturing companies of chaebols. The chaebols account for 14% of the value added of the entire manufacturing sector. The chaebols’ 778 companies account for 2.95% of the nation’s employment. The chaebol companies, however, account for more than half (52.3%) of the total market value of all listed companies.
Although there are 36 chaebols in 2004, it is the four largest ones that exert a significant influence.27 Samsung, LG, Hyundai Motor, and SK together account for 8.74% of the value added (of the manufacturing sector), 1.6% of the nation’s employment, and 43% of the stock market value.
26Since the GDP in 2003 was 721 trillion won, the aggregate assets and sales of the 36 chaebols amount to 86.3% and 65.0%, respectively.
6.2
An example - Hyundai Motor
Figure 6 shows a summarized picture of the 2004 ownership structure of the Hyundai Motor Chaebol. The total number of firms in the group is 27, but the figure only depicts the ownership relations among 11 of them.
This example is fairly typical of a Korean Chaebol. The individual at the top (Jung Mong Koo in the case of Hyundai Motor) controls somefirms directly, with no cross-shareholdings (e.g., Changwon and Glovis), and also severalfirms that own equity stakes in each other. The structure of cross-ownership is quite complex, and difficult to figure out visually. Perhaps because of this complexity, the existing literature on business groups focused on measuring only a few characteristics of the ownership of firms, such as whether they belong to a group or not, and whether they show indirect (e.g., pyramidal) ownership.
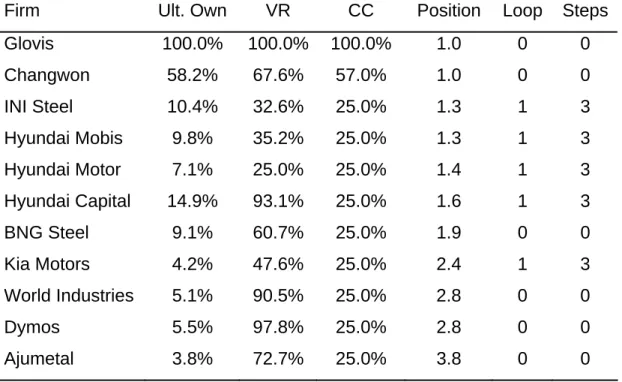
However, these are not the only variables of interest to describe the Chaebol structure. As we discussed in Section 2, we can also compute the specific position of a firm in the Chaebol structure, whether the firm is a part of a cross-ownership loop, and the centrality of a firm for the control of other firms. Importantly, our methodology to compute these variables does not require the researcher to draw the group structure as we have done in Figure 6.28 Table 2 shows some variables of interest for the firms depicted in Figure 6.
The Table shows that Hyundai Motor, Hyundai Mobis and Kia Motors are the most important firms for the control of the Hyundai Motor Chaebol, given that these are the
firms with the highest values for the centrality variable. These firms are also among the largestfirms in the Chaebol in terms of the number of employees, and they tend to be older as well. In addition, these firms (central, larger, older) are also the ones that are publicly traded (in addition to BNG Steel and INI Steel). The figure shows that these firms indeed hold stakes in several other Chaebol firms. Though it is a bit hard to follow the ownership links with the naked eye, our variable loop show that these central firms are also part of a cross-ownership loop, with 3 firms in it (variable steps). For example, notice that Kia owns 18% of the shares of Mobis, which owns 14% of the shares of Motor, which owns 37% of the shares of Kia. Notice, however, that Jung Mong Koo does not own shares in Kia directly. Therefore, Kia’s position in the group structure is lower than those of Motor and Mobis.
The Hyundai Motor Chaebol also illustrates the computation of the two different mea-sures of control. The variable VR (consistent voting rights) simply represents the sum of all direct and indirect family votes in all firms. Notice that this measure is close to 100% for the private firms in the bottom of the group (e.g., Dymos). However, the family itself does not hold large cash flow stakes in these firms (variable Cash flow). As a consequence, the separation between ownership and control measured using VR is extremely large for these
firms. However, notice that the variable CC (critical control threshold) is equal to 25% for all firms except those that are owned directly at the top. This is because the control of all group firms that are controlled indirectly depends on the family’s control of Hyundai Mo-tor. Thus, the critical control threshold is equal to the family’s direct and indirect votes in Hyundai Motor (VR = 25% for Hyundai Motor). In either case, the two measures indicate substantial separation between ownership and control in all but a few firms in the Hyundai