NHESSD
3, 1835–1860, 2015Sensibility analysis of VORIS lava-flow
simulations
A. M. Syavulisembo et al.
Title Page
Abstract Introduction
Conclusions References
Tables Figures
◭ ◮
◭ ◮
Back Close
Full Screen / Esc
Printer-friendly Version Interactive Discussion
Discussion
P
a
per
|
Discussion
P
a
per
|
Discussion
P
a
per
|
Discussion
P
a
per
|
Nat. Hazards Earth Syst. Sci. Discuss., 3, 1835–1860, 2015 www.nat-hazards-earth-syst-sci-discuss.net/3/1835/2015/ doi:10.5194/nhessd-3-1835-2015
© Author(s) 2015. CC Attribution 3.0 License.
This discussion paper is/has been under review for the journal Natural Hazards and Earth System Sciences (NHESS). Please refer to the corresponding final paper in NHESS if available.
Sensibility analysis of VORIS lava-flow
simulations: application to Nyamulagira
volcano, Democratic Republic of Congo
A. M. Syavulisembo1, H.-B. Havenith2, B. Smets3,4,5, N. d’Oreye3,6, and J. Marti7 1
Goma Volcanological Observatory, Goma, DR Congo
2
University of Liège, Department Geology, Sart Tilman B52, 4000 Liège, Belgium
3
European Center for Geodynamics and Seismology, rue Josy Welter 19, 7256 Walferdange, Luxembourg
4
Vrije Universiteit Brussel, Pleinlaan 2, 1085 Brussels, Belgium
5
Royal Museum for Central Africa, Leuvensesteenweg 13, 3080 Tervuren, Belgium
6
National Museum of Natural History Geophysics/Astrophysics Department, rue Josy Welter 19, 7256 Walferdange, Luxembourg
7
Institute of Earth Sciences Jaume Almera, CSIC, Lluís Solé i Sabarís s/n, 08028 Barcelona, Spain
Received: 26 November 2014 – Accepted: 8 January 2015 – Published: 10 March 2015
Correspondence to: A. M. Syavulisembo ([email protected])
NHESSD
3, 1835–1860, 2015Sensibility analysis of VORIS lava-flow
simulations
A. M. Syavulisembo et al.
Title Page
Abstract Introduction
Conclusions References
Tables Figures
◭ ◮
◭ ◮
Back Close
Full Screen / Esc
Printer-friendly Version Interactive Discussion
Discussion
P
a
per
|
Discussion
P
a
per
|
Discussion
P
a
per
|
Discussion
P
a
per
|
Abstract
Assessment and management of volcanic risk are important scientific, economic, and political issues, especially in densely populated areas threatened by volcanoes. The Virunga area in the Democratic Republic of Congo, with over 1 million inhabitants, has to cope permanently with the threat posed by the active Nyamulagira and Nyiragongo
5
volcanoes. During the past century, Nyamulagira erupted at intervals of 1–4 years – mostly in the form of lava flows – at least 30 times. Its summit and flank eruptions lasted for periods of a few days up to more than two years, and produced lava flows sometimes reaching distances of over 20 km from the volcano, thereby affecting very large areas and having a serious impact on the region of Virunga. In order to identify a useful tool
10
for lava flow hazard assessment at the Goma Volcano Observatory (GVO), we tested VORIS 2.0.1 (Felpeto et al., 2007), a freely available software (http://www.gvb-csic.es) based on a probabilistic model that considers topography as the main parameter con-trolling lava flow propagation. We tested different Digital Elevation Models (DEM) – SRTM1, SRTM3, and ASTER GDEM – to analyze the sensibility of the input
parame-15
ters of VORIS 2.0.1 in simulation of recent historical lava-flow for which the pre-eruption topography is known. The results obtained show that VORIS 2.0.1 is a quick, easy-to-use tool for simulating lava-flow eruptions and replicates to a high degree of accuracy the eruptions tested. In practice, these results will be used by GVO to calibrate VORIS model for lava flow path forecasting during new eruptions, hence contributing to a better
20
volcanic crisis management.
1 Introduction
During the past century Nyamulagira (or Nyamuragira), the westernmost volcano of the Virunga Volcnaic Province (VVP), erupted at least 30 times at intervals of 1– 4 years (Tedesco, 2002, 2003; Smets et al., 2010). It is considered one of the most
25
NHESSD
3, 1835–1860, 2015Sensibility analysis of VORIS lava-flow
simulations
A. M. Syavulisembo et al.
Title Page
Abstract Introduction
Conclusions References
Tables Figures
◭ ◮
◭ ◮
Back Close
Full Screen / Esc
Printer-friendly Version Interactive Discussion
Discussion
P
a
per
|
Discussion
P
a
per
|
Discussion
P
a
per
|
Discussion
P
a
per
|
et al., 2013). Most of historical eruptions of Nyamulagira occurred along its flanks, sometimes more than 10 km far from the central edifice. Nyamulagira eruptions com-monly last few days to few weeks, but some voluminous and less frequent historical events lasted more than 2 years (Pouclet, 1976; Smets et al., 2010). Nyamulagira’s activity is characterized essentially by lava fountaning activity along an eruptive
fis-5
sure, which produces lava flows and progressively build, together with ejected tephra, a spatter-and-scoria cone along the fissure (Pouclet, 1976; Smets et al., 2013)
On 2 January 2010, an eruption of Nyamulagira started in the central caldera and along the SSE flank, emitting ∼45.5×10⁶m3 of lava. These lava flows caused an
enormous loss of vegetation in the Virunga National Park and the dense plume of
10
gases that scaped from the eruptive vents affected the surrounding population. The estimated surface area covered by the 2010 lava flows is 15.17±2.53×10⁶m2(Smets
et al., 2013).
Due to the presence of densely populated zones and a National park in the vicinity of Nyamulagira, hazards associated with its frequent fissural eruptions must be assessed.
15
In addition to detailed field surveys and literature reviews performed to better char-acterise Nyamulagira’s eruptive activity and, hence, better assess eruption hazards, simulations are practical tools to create hazard maps and detect the most probably affected areas during an eruption. For lava flows a wide diversity of both probabilistic and deterministic simulation models exist in the volcanological literature (e.g. Crisci
20
et al., 1986, 1997; Ishihara et al., 1989; Wadge et al., 1994; Kuauhicaua et al., 1995; Felpeto et al., 2001; Favalli et al., 2005; Damiani et al., 2006) and offer different degrees of accuracy depending on the mathematical methods used to make calculations and the input parameters considered. Unfortunately, most of these models only exist in the scientific literature and their source codes are not freely available. Furthermore, some
25
NHESSD
3, 1835–1860, 2015Sensibility analysis of VORIS lava-flow
simulations
A. M. Syavulisembo et al.
Title Page
Abstract Introduction
Conclusions References
Tables Figures
◭ ◮
◭ ◮
Back Close
Full Screen / Esc
Printer-friendly Version Interactive Discussion
Discussion
P
a
per
|
Discussion
P
a
per
|
Discussion
P
a
per
|
Discussion
P
a
per
|
lava-flow models, VORIS is free (downloadable from www.gvb-csic.es), easy-to-use and does not entail high computing requirements. However, VORIS may be less ac-curate than other more sophisticated deterministic lava-flow simulation models, which thus creates a dilemma as to whether a high precision or a quicker, easier-to-use – but less precise – tool is preferable.
5
The Goma Volcano Observatory (GVO) is in charge of conducting volcano moni-toring and assessing volcanic hazards in the Democratic Republic of Congo (DRC). Thus, as part of its work, it needs to adopt adequate methodologies and tools – tried and tested in other areas – that can be used by its scientists and technicians to comply with the most essential of its tasks. To check whether VORIS could be of use to the
10
GVO for lava flow hazard assessment in the DRC volcanoes, and for quickly estimating the potential impact of new lava flows in the event of a new eruption, we tested this package’s lava-flow simulation model by replicating the Nyamulagira 2010 eruption, most of whose parameters and pre-eruption topography are known.
2 Geological setting 15
The VVP is part of the western branch of the East African Rift and is situated be-tween Lake Edward in the north and Lake Kivu in the south (Fig. 1) (Verhoogen, 1938; Smets, 2007). It is composed by eight large volcanic edifices: Muhabura (4127 m), Gahunga (2474 m), Sabinyo (3647 m), Visoke (3711 m), Karisimbi (4507 m), Mikeno (4437 m), Nyamulagira (3058 m), and Nyiragongo (3470 m) (Komorowski et al., 2003).
20
Although volcanic activity in the VVP dates back to the Upper Miocene (Pouclet, 1977), Nyiragongo and Nyamulagira are currently the main active volcanoes of this volcanic province (Tedesco et al., 2007; d’Oreye et al., 2012).
Nyamulagira (1.41◦S, 29.20◦E) is located in the Virunga National Park, which was declared as a World Heritage Site in 1979 and has an endangered one since
25
NHESSD
3, 1835–1860, 2015Sensibility analysis of VORIS lava-flow
simulations
A. M. Syavulisembo et al.
Title Page
Abstract Introduction
Conclusions References
Tables Figures
◭ ◮
◭ ◮
Back Close
Full Screen / Esc
Printer-friendly Version Interactive Discussion
Discussion
P
a
per
|
Discussion
P
a
per
|
Discussion
P
a
per
|
Discussion
P
a
per
|
(Aoki et al., 1985). In recent decades, the eruptive activity took the form of peri-odic flank fissure-fed effusive eruptions, with intervals of summit lava lake activity (e.g. Hamaguchi and Zana, 1983; Wadge and Burt, 2011; Smets et al., 2014), but since April 2014, it is restricted to episodic fountaining and lava lake activity in a pit crater located in the NE sector of the central caldera (Smets et al., 2014).
5
3 Methodology
We used VORIS 2.0.1 (Felpeto et al., 2007; http://www.gvb-csic.es) to simulate the lava flows emitted by Nyamulagira during the 2010 eruption. VORIS (Volcanic Risk Information Systems) was developed in an ArcGis 9.1 (©ESRI) Geographical Informa-tion System (GIS) framework and allows eruptive scenarios and probabilistic hazards
10
maps to be created rapidly for the commonest volcanic hazards (lava flows, fallout and pyroclastic density currents).
The lava flow model included in VORIS is a probabilistic (Monte Carlo algorithm) model based on the assumption that both topography and flow thickness play major roles in determining the path followed by a lava flow (Felpeto et al., 2007 and references
15
therein). The model computes several possible paths for the flow on the basis of two simple rules: (i) the flow will only propagate from one cell to one of its eight neighbors if the difference in corrected topographic height between them is positive, and (ii) the probability that the flow will move from one cell to one of its neighbors is proportional to the difference in height. The calculation of the probability of a point being invaded by
20
lava is performed by computing several random paths using a Monte Carlo algorithm (see Felpeto, 2009 for more details).
The input data for this simulation includes a Digital Elevation Model (DEM), from which we can chose either a single vent or a vent area including several vents, the maximum flow length (i.e. the total length of the path followed by the lava flow, not
25
NHESSD
3, 1835–1860, 2015Sensibility analysis of VORIS lava-flow
simulations
A. M. Syavulisembo et al.
Title Page
Abstract Introduction
Conclusions References
Tables Figures
◭ ◮
◭ ◮
Back Close
Full Screen / Esc
Printer-friendly Version Interactive Discussion
Discussion
P
a
per
|
Discussion
P
a
per
|
Discussion
P
a
per
|
Discussion
P
a
per
|
simulation and characterize the resulting model. The maximum flow length and the height correction or average thickness are integers defined in meters. In addition, the “iterations number” must be considered. This number is proportional to the number of calculations made and will determine the CPU time required and the accuracy of the results obtained. However, the greater the number of iterations, the more accurate the
5
results, but also the greater the risk that the microprocessor will be overloaded. This is why in our study we paid special attention to this input parameter in order to determine the most appropriate number of iterations for guaranteeing obtaining reliable results without using too much computing time.
The DEM is a fundamental boundary condition needed for modelling volcanic
pro-10
cesses and associated risks including pyroclastic, lava, and mud flows (Sheridan et al., 2004). In this case study, the DEM plays a major role in determining the path-ways of lava flows (Felpeto et al., 2007) as it is the numerical base used to compute the path the lava will follow based on the principle used by VORIS. To test the model, we used three different DEMs corresponding to the 2010 pre-eruption topography: SRTM1,
15
SRTM3, and ASTER GDEM. They differ either by their resolutions or by the way they were produced. SRTM (Shuttle Radar Topography Mission). DEMs were produced by radar interferometry, using radar images acquired during a space mision, with NSA, space shuttle. SRTM1 in the studied area has a spatial resolution of 31 m, while that of SRTM3 has 93 m-wide pixels. In recent years, SRTM DEMs were the main source of
20
height data for the VVP. The ASTER GDEM (ASTER Global Digital Elevation Model) is not obtained by stereophotogrametry, using nadir and backward images acquired by ASTER (Advanced Spaceborne Thermal Emission and Felection Radiometer) opti-cal sensor, on board the Terra satellite (NASA/MATI/J-Spacesystems). ASTER GDEM data are published with a spatial resolution of 30 m (Hormann, 2012).
25
NHESSD
3, 1835–1860, 2015Sensibility analysis of VORIS lava-flow
simulations
A. M. Syavulisembo et al.
Title Page
Abstract Introduction
Conclusions References
Tables Figures
◭ ◮
◭ ◮
Back Close
Full Screen / Esc
Printer-friendly Version Interactive Discussion
Discussion
P
a
per
|
Discussion
P
a
per
|
Discussion
P
a
per
|
Discussion
P
a
per
|
model in this type of lava-flow simulations and for testing their aptness for using with VORIS. In equatorial zones, such as in the VVP, the quality of the ASTER GDEM is considerably affected by cloud cover. As a aconsequence, artifacts apperar in the lava fields (Arefi and Leinartz, 2011). Compared to different GIS ground control points ac-quired in the southern Nyragongo lava field (Albino et al., 2014), the SRTM DEM has a
5
better vertical accuracy than the ASTER GDEM. Hense, it is initially expected to have more reliable results using the SRTM DEMs.
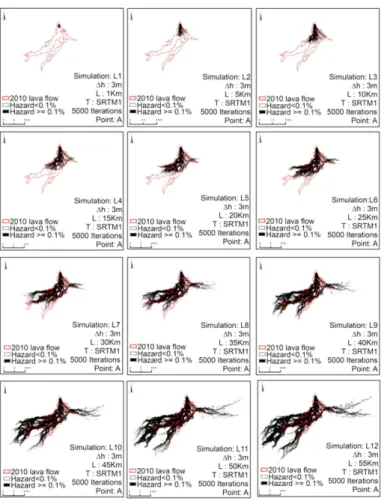
4 Simulations and sensibility analysis of input parameters 4.1 Total length
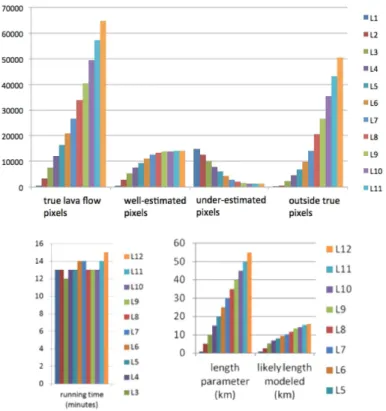
The sensibility of the length parameter was evaluated using SRTM1 and 12 different
10
simulations. A vent location was fixed at point A (UTM 35S 746161E/9840963N) with an average lava flow thickness of 3 m; 5000 iterations were applied with a different length value for each: L1=1 km, L2=5 km, L3=10 km, L4=15 km, L5=20 km, L6=25 km, L7=30 km, L8=35 km, L9=40 km, L10=45 km, L11=50 km, and L12=55 km. The results obtained are given in Figs. 2 and 3 and in Table 1 with the values for the following
15
parameters:
1. “True lava flow pixels”: number of pixels of the DEM actually covered by the lava flow we are trying to simulate,
2. “Simulated pixels”: number of pixels of the DEM corresponding to the surface covered by the simulated lava flow,
20
3. “Well-estimated pixels”: number of pixels of the DEM corresponding to probable pixels that coincide with true pixels,
NHESSD
3, 1835–1860, 2015Sensibility analysis of VORIS lava-flow
simulations
A. M. Syavulisembo et al.
Title Page
Abstract Introduction
Conclusions References
Tables Figures
◭ ◮
◭ ◮
Back Close
Full Screen / Esc
Printer-friendly Version Interactive Discussion
Discussion
P
a
per
|
Discussion
P
a
per
|
Discussion
P
a
per
|
Discussion
P
a
per
|
5. “Outside true pixels”: number of pixels of the DEM corresponding to probable pixels that do not coincide with true pixels,
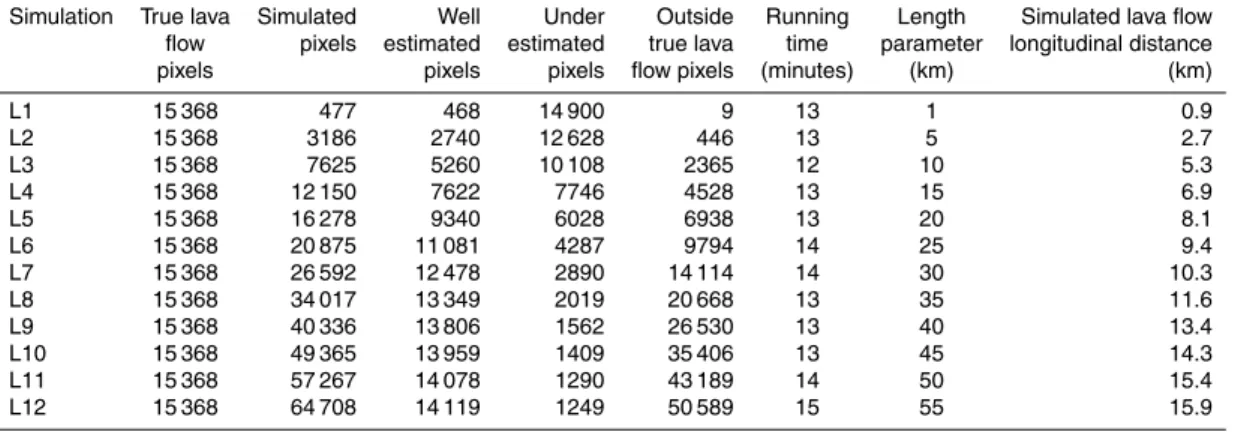
6. “Length parameter”: value of the input parameter “length” introduced into the model for the simulation,
7. “Modeled likely length”: maximum longitudinal length of the simulated lava flow,
5
8. “Running time”: the time that it took the model to generate the results.
The results obtained reveal that a too small length value underestimates the probability of being covered by the lava flow (simulation L1), while a too large value (simulation L12) tends to overestimate the maximum longitudinal or run-out distance, as well as the lateral extent, of the lava flow, given that the real eruption will stop before reaching this
10
total maximum length. However, simulations L7 and L8, which considered intermediate maximum lengths of 30 and 35 km, respectively, match well the extent and run-out distance of the Nyamulagira 3 January 2010 lava flow. This indicates that, in this case and with the SRTM1 DEM, the total length of this lava flow was about double that of its longitudinal distance, thereby revealing the strong control that was exercised by the
15
highly irregular topography characterized by non-rectilinear ravines and gullies.
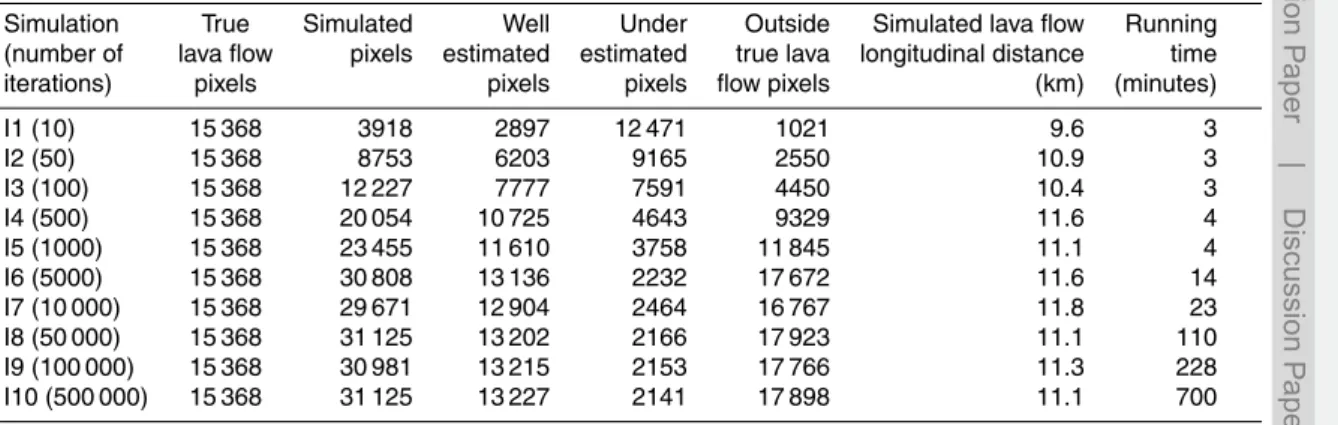
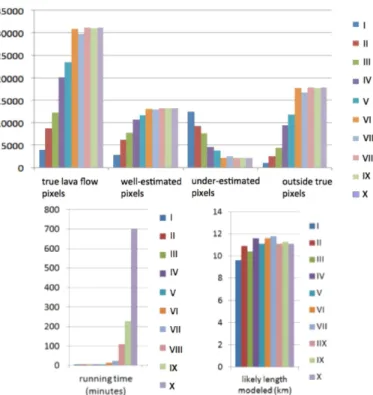
4.2 Number of iterations
We arbitrarily selected 10 simulations with different numbers of iterations (I1=10, I2=50, I3=100, I4=500, I5=1000, I6=5000, I7=10 000, I8=50 000, I9=100 000, and I10=500 000). Simulations were carried out on SRTM1, with the same point A
20
(UTM35S, 746161E/9840963N), which corresponds to the flank vent location of the 2010 eruption, and fixed average thickness and total length of 3 m and 33 km, respec-tively. The results obtained are shown in Figs. 4 and 5 and Table 2, and indicate that the number of simulated pixels, well-estimated pixels, and pixels outside the 2010 lava flow increase from simulations I1 to I6, but remain more or less constant from I6 to I10.
25
NHESSD
3, 1835–1860, 2015Sensibility analysis of VORIS lava-flow
simulations
A. M. Syavulisembo et al.
Title Page
Abstract Introduction
Conclusions References
Tables Figures
◭ ◮
◭ ◮
Back Close
Full Screen / Esc
Printer-friendly Version Interactive Discussion
Discussion
P
a
per
|
Discussion
P
a
per
|
Discussion
P
a
per
|
Discussion
P
a
per
|
under-estimated pixels, and a relatively low running (calculation) time. Even so, it still gives over 15 000 pixels that are outside the real lava flow. The number of iterations has less influence on the modeled lava flow length, with values ranging from 9.6 to 11.8 km.
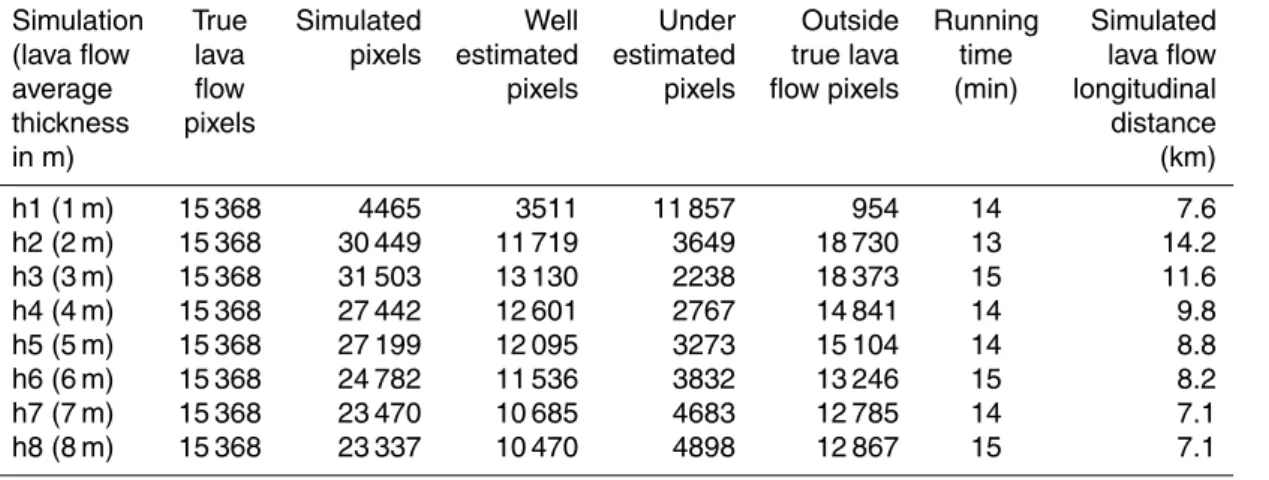
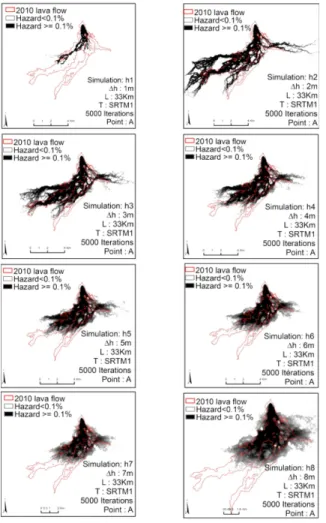
4.3 Lava-flow thickness 5
In order to test the influence of the height correction parameter (average thickness) we performed eight simulations with different values of this parameter (i.e. h1=1 m, h2=2 m, h3=3 m, h4=4 m, h5=5 m, h6=6 m, h7=7 m, and h8=8 m). Iterations and total lengths were fixed to 5000 and 33 km, respectively. The results are presented in Figs. 6 and 7 and in Table 3. In these simulations (Figs. 6 and 7 and in Table 3)
10
we noticed that, when the value of “h” increases, the effects of the relief decrease. In simulations h1–h8, the small zones enclosed by the true pixels decrease gradually in size until they are eliminated. Simulation h1 is too narrow and does not cover all the real lava flow, while simulation h8 produced an overflow outside the real lava flow. With the length parameter fixed to 33 km, we noticed that the modeled lava-flow length increases
15
for simulations h1 and h2. Simulation h3 has the greatest number of simulated and well-estimated pixels, but the lowest number of under-estimated pixels.
4.4 DEM
Finally, we conducted several simulations to test the suitability of the different DEMs (S1: SRTM1, S2: SRTM3, and S3: ASTER GDEM) using vent location at point
20
A (UTM35S 746161E/9840963N), lava thickness of 3 m, fixed number of iterations (5000), and 33 km for the length parameter. Results are shown in Figs. 8 and 9 and Table 4. Simulation S1 (using SRTM1) gives the best match between the modeled and natural lava flow, as it corresponds to the best calibration determined in the previous sections. In simulation S2, (SRTM3 DEM), lava spreads over a greater surface and
25
NHESSD
3, 1835–1860, 2015Sensibility analysis of VORIS lava-flow
simulations
A. M. Syavulisembo et al.
Title Page
Abstract Introduction
Conclusions References
Tables Figures
◭ ◮
◭ ◮
Back Close
Full Screen / Esc
Printer-friendly Version Interactive Discussion
Discussion
P
a
per
|
Discussion
P
a
per
|
Discussion
P
a
per
|
Discussion
P
a
per
|
to calibrate input parameters according to the DEM used in the simulation. The simu-lation S3 (ASTER GDEM) stopped prematurely because of strong artifacts present in the DEM. ASTER GDEM seems consequently not appropiate for lava flow modelling in the VVP.
5 Discussion and conclusions 5
We conducted several simulations of lava-flow emplacement using VORIS 2.0.1 (Felpeto et al., 2007), in order to replicate the lava flow emitted by the 2010 Nya-muragira eruption and to test the aptness of this model for conducting lava flow hazard assessment at the Nyamuragira volcano. Model calibration was performed by changing the values of the model parameters until simulations best mached the 2010 lava flow.
10
Next, this calibrated simulation was realised on three DEMs to detect their influence on results.
This analysis shows that some input parameters can drastically change results. Too few iterations produce very poor results with a high degree of inaccuracy, while too many lead to considerable overestimates and a consequent increase in computing
15
time. In our study, a number of iterations between 5000 and 10 000 gave the best results and the greatest degree of coincidence (up to 87 %) between the simulations and the real lava flow, with a total computing time of less than 20 min for each run. Simulations were less sensitive to changes in height correction (i.e. average thickness). However, we observed that the best results were obtained with a value of 3 m, which
20
coincides with the average thickness commonly used to calculate of Nyamunragira lava flows. Results also show that the model calibration mush be adapted to the DEM used, as both spatial resolution and DEM quality stongly affect results.
In summary, the use of the VORIS 2.0.1. lava-flow model succeeded to replicate the emplacement of the Nyamuragira 2010 lava flow with a degree of accuracy of up to
25
NHESSD
3, 1835–1860, 2015Sensibility analysis of VORIS lava-flow
simulations
A. M. Syavulisembo et al.
Title Page
Abstract Introduction
Conclusions References
Tables Figures
◭ ◮
◭ ◮
Back Close
Full Screen / Esc
Printer-friendly Version Interactive Discussion
Discussion
P
a
per
|
Discussion
P
a
per
|
Discussion
P
a
per
|
Discussion
P
a
per
|
performed at Goma Volcano Observatory. Additional calibration is however required to adapt simulations to the neighboring Nyragongo volcano, for which the flank eruption style and lava flow propagation are different.
Acknowledgements. Initial results of this work were performed in the framework of a MSc in Natural Risk Management (University of Liège, CUD-2012 Grant. BS was funded by
FNR-5
Luxembourg, through the AFR PhD Grant no. 3221321. J. Marti was funded by the European Commission (FT7 Theme: ENV.2011.1.3.3-1; Grant 282759: “VUELCO”). This study is part of inititiatives lunched in the framework of the GeoRisCA project (Contract no. SD/RI/02A, SSD Research program of the Blegian Science Policy Office).
References 10
Aoki, K., Yoshida, T., Yusa, K., and Nakamura, Y.: Petrology and geochemistry of the Nyamura-gira volcano, Zaire, J. Volcanol. Geoth. Res., 25, 1–28, 1985.
Arefi, H. and Reinartz, P.: Accuracy Enhancement of ASTER Global Digital Elevation Models Using ICESat Data, Remote Sensing, 3, 1323–1343, 2011.
Chakrabarti, R., Basu, A. R., Santo, A. P., Tedesco, D., and Vaselli, O.: Isotopic and geochemical
15
evidence for a heterogeneous mantle plume origin of the Virunga volcanics, Western rift, East African Rift system, Chem. Geol., 259, 273–289, doi:10.1016/j.chemgeo.2008.11.010, 2009.
Crisci, G. M., Di Gregorio, S., Pindaro, O., and Ranieri, G.: Lava flow simulation by a discrete cellular model: first implementation, Int. J. Model. Simul., 6, 137–140, 1986.
20
Crisci, G. M., Di Francia, A., Di Gregorio, S., Nicoletta, F., Rongo, R., and Spataro, W.: SCIARA-2: A Cellular Automata model for lava flow simulation, in: Proceedings of the Third Annual Conference of the International Association for Math. Geol. IAMG, edited by; Glahn, V. P., 22–27 September 1997, Barcelona, Addendum, 11–16, 1997.
Damiani, M. L., Groppelli, G., Norini, G., Bertino, E., Gigliuto, A., and Nucita, A.: A lava flow
sim-25
ulation model for the development of volcanic hazard maps for Mount Etna (Italy), Comput. Geosci., 32, 512–526, 2006.
d’Oreye, N., Albino, F., Cayol, V., Gonzalez, P., Kervyn, F., Samsonov, S., Smets, B., Wau-thier, C., Bagalwa, L. M., Mashagiro, N., Muhindo, A., and Syauswa, M.: Volcano monitoring in the Virunga Volcanic Province, DR Congo, Congrès GeoPrisms, New Jersey, p. 1, 2012.
NHESSD
3, 1835–1860, 2015Sensibility analysis of VORIS lava-flow
simulations
A. M. Syavulisembo et al.
Title Page
Abstract Introduction
Conclusions References
Tables Figures
◭ ◮
◭ ◮
Back Close
Full Screen / Esc
Printer-friendly Version Interactive Discussion
Discussion
P
a
per
|
Discussion
P
a
per
|
Discussion
P
a
per
|
Discussion
P
a
per
|
Favalli, M., Pareschi, M. T., Neri, A., and Isola, I.: Forecasting lava flow paths by a stochastic approach, Geophys. Res. Lett., 32, L03305, doi:10.1029/2004GL021718, 2005.
Felpeto, A., Araña, V., Ortiz, R., Astiz, M., and García, A.: Assessment and modelling of lava flow hazard on Lanzarote (Canary Islands), Nat. Hazards, 23, 247–257, 2001.
Felpeto, A., Martí, J., and Ortiz, R.: Automatic GIS-based system for volcanic hazard
assess-5
ment, J. Volcanol. Geoth. Res., 166, 106–116, 2007.
Felpeto, A.: VORIS: a GIS-based tool for volcanic hazard assessment, USER’S GUIDE, VORIS 2.0.1, p. 38, available at: http://www.gvb-csic.es (last access: 11 November 2014), 2009.
Hamaguchi, H. and Zana, N.: Introduction to volcanoes Nyiragongo and Nyamuragira, in:
Volca-10
noes Nyiragongo and Nyamuragira: Geophysical Aspects, edited by: Hamaguchi, H., Tohoku University, Sendai, 1–6, 1983.
Head, E. M., Maclean, A. L., and Carn, S. A.: Mapping lava flows from Nyamuragira volcano (1967–2011) with satellite data and automated classification methods, Geomat. Nat. Hazards Risk., 4, 119–144, doi:10.1080/19475705.2012.680503, 2012.
15
Hormann, C.: Evaluation de la GDEM ensemble de données v2 ASTER, available at: http: //www.imagico.de/map/aster_gdem.php, (last access: 28 July 2013), 2012.
Ishihara, K., Iguchi, M., and Kamo, K.: Numerical Simulation of Lava Flows on Some Volca-noes in Japan, in: Lava Flows and Domes, edited by: Fink, J. H., IAVCEI Proceedings in Volcanology, Springer, New York, 174–207, 1989.
20
Kasahara, M.: Near-field tilt measurements related to the 1981–1982 Nyamuragira eruption, in: Volcanoes Nyiragongo and Nyamuragira: Geophysical Aspects, edited by: Hamaguchi, H., The Faculty of Science, Tohoku University, Sendai, 47–54, 1983.
Kauahikaua, J., Margriter, M., Lockwood, J., and Trusdell, F.: Applications of GIS to the estima-tion of lava flow hazards on Mauna Loa volcano, Hawaii, in: Mauna Loa Revealed: Structure,
25
Composition, History, and Hazards, Geophys. Monogr., 92, 315–325, 1995.
Komorowski, J. C., Tedesco, D., Kasereka, M., Allard, P., Papale, P., Vaselli, O., Durieux, J., Baxter, P., Halbwachs, M., Akumbe, M., Baluku, B., Briole, P., Ciraba, M., Dupin, J. C., Etoy, O., Garcin, D., Hamaguchi, H., Houlié, N., Kavoyha, K. S., Lemarchand, A., Lock-wood, J., Lukaya, N., MAvonga, G., De Michele, M., Mpore, S., Mukambilwa, K.,
Muny-30
NHESSD
3, 1835–1860, 2015Sensibility analysis of VORIS lava-flow
simulations
A. M. Syavulisembo et al.
Title Page
Abstract Introduction
Conclusions References
Tables Figures
◭ ◮
◭ ◮
Back Close
Full Screen / Esc
Printer-friendly Version Interactive Discussion
Discussion
P
a
per
|
Discussion
P
a
per
|
Discussion
P
a
per
|
Discussion
P
a
per
|
Pouclet, A. and Villeneuve, M.: L’éruption du Rugarama (mars–mai 1971) au volcan Nyamura-gira (Rep. Zaire), B. Volcanol., 1, 200–221, 1972.
Sheridan, M. F., Hubbard, B., Carasco-Nunez, G., and Siebe, C.: GIS model for volcanic hazard assessment: pyroclastic flow hazard at volcan Citlaltepetl, Mexico, Nat. Hazards, 33, 209– 221, 2004.
5
Smets, B.: Etude des mazukus dans la région de Goma (République Démocratique du Congo) et gestion des risques, ULG, D. E. S. Interuniversitaire en Gestion des Risques Naturels, Année académique, Liège, 2006–2007.
Smets, B., Wauthier, C., and d’Oreye, N.: A new map of the lava flow field of Nyamulagira (DR Congo) from satellite imagery, J. African Earth Sci., 58, 778–786, 2010.
10
Smets, B., d’Oreye, N., Kervyn, F., Kervyn, M., Albino, F., Arellano, S. R., Bagalwa, M., Bal-agizi, C., Carn, S. A., Darrah, T. H., Fernández, J., Galle, B., González, P. J., Head, E., Karume, K., Kavotha, D., Lukaya, F., Mashagiro, N., Mavonga, G., Norman, P., Osodundu, E., Pallero, J. L. G., Prieto, J. F., Samsonov, S., Syauswa, M., Tedesco, D., Tiampo, K., Wau-thier, C., and Yalire, M. M.: Detailed multidisciplinary monitoring reveals pre- and co-eruptive
15
signals at Nyamulagira volcano (North Kivu, Democratic Republic of Congo), B. Volcanol., 76, 35, 2013.
Smets, B., d’Oreye, N., and Kervyn, F.: Toward Another Lava Lake in the Virunga Volcanic Field?, Eos Trans. Am. Geophys. Union, 95, 377–378, 2014.
Tazieff, H.: An exceptional eruption: Mt. Nyiragongo, 10 January 1977, B. Volcanol., 40, 1–12,
20
1977.
Tedesco, D.: 1995 Nyiragongo and Nyamulagira activity in the Virunga National Park: A volcanic crisis, Acta Vulcanol., 14–15, 149–155, 2002/2003.
Tedesco, D., Vaselli, O., Papale, P., Carn, S. A., Voltaggio, M., Sawyer, G. M., Durieux, J., Kasereka, M., and Tassi, F.: January 2002 volcano-tectonic eruption of Nyiragongo volcano,
25
Democratic Republic of Congo, J. Geophys. Res., 112, B09202, doi:10.1029/2006JB004762, 2007.
Verhoogen, J.: Les volcans Virunga et l’éruption du Nyamulagira de 1938, Annales de la société géologique de Belgique, 62, B326–353, 1939.
Wadge, G. and Burt, L.: Stress field control of eruption dynamics at a rift volcano: Nyamuragira,
30
DR Congo, J. Volcanol. Geoth. Res., 207, 1–15, 2011.
NHESSD
3, 1835–1860, 2015Sensibility analysis of VORIS lava-flow
simulations
A. M. Syavulisembo et al.
Title Page
Abstract Introduction
Conclusions References
Tables Figures
◭ ◮
◭ ◮
Back Close
Full Screen / Esc
Printer-friendly Version Interactive Discussion
Discussion
P
a
per
|
Discussion
P
a
per
|
Discussion
P
a
per
|
Discussion
P
a
per
|
Table 1.Sensibility analysis of length parameter.
Simulation True lava Simulated Well Under Outside Running Length Simulated lava flow flow pixels estimated estimated true lava time parameter longitudinal distance
pixels pixels pixels flow pixels (minutes) (km) (km)
L1 15 368 477 468 14 900 9 13 1 0.9
L2 15 368 3186 2740 12 628 446 13 5 2.7
L3 15 368 7625 5260 10 108 2365 12 10 5.3
L4 15 368 12 150 7622 7746 4528 13 15 6.9
L5 15 368 16 278 9340 6028 6938 13 20 8.1
L6 15 368 20 875 11 081 4287 9794 14 25 9.4
L7 15 368 26 592 12 478 2890 14 114 14 30 10.3
L8 15 368 34 017 13 349 2019 20 668 13 35 11.6
L9 15 368 40 336 13 806 1562 26 530 13 40 13.4
L10 15 368 49 365 13 959 1409 35 406 13 45 14.3
L11 15 368 57 267 14 078 1290 43 189 14 50 15.4
NHESSD
3, 1835–1860, 2015Sensibility analysis of VORIS lava-flow
simulations
A. M. Syavulisembo et al.
Title Page
Abstract Introduction
Conclusions References
Tables Figures
◭ ◮
◭ ◮
Back Close
Full Screen / Esc
Printer-friendly Version Interactive Discussion
Discussion
P
a
per
|
Discussion
P
a
per
|
Discussion
P
a
per
|
Discussion
P
a
per
|
Table 2.Sensibility of “iterations number”.
Simulation True Simulated Well Under Outside Simulated lava flow Running
(number of lava flow pixels estimated estimated true lava longitudinal distance time
iterations) pixels pixels pixels flow pixels (km) (minutes)
I1 (10) 15 368 3918 2897 12 471 1021 9.6 3
I2 (50) 15 368 8753 6203 9165 2550 10.9 3
I3 (100) 15 368 12 227 7777 7591 4450 10.4 3
I4 (500) 15 368 20 054 10 725 4643 9329 11.6 4
I5 (1000) 15 368 23 455 11 610 3758 11 845 11.1 4
I6 (5000) 15 368 30 808 13 136 2232 17 672 11.6 14
I7 (10 000) 15 368 29 671 12 904 2464 16 767 11.8 23
I8 (50 000) 15 368 31 125 13 202 2166 17 923 11.1 110
I9 (100 000) 15 368 30 981 13 215 2153 17 766 11.3 228
NHESSD
3, 1835–1860, 2015Sensibility analysis of VORIS lava-flow
simulations
A. M. Syavulisembo et al.
Title Page
Abstract Introduction
Conclusions References
Tables Figures
◭ ◮
◭ ◮
Back Close
Full Screen / Esc
Printer-friendly Version Interactive Discussion
Discussion
P
a
per
|
Discussion
P
a
per
|
Discussion
P
a
per
|
Discussion
P
a
per
|
Table 3.Sensibility analysis of lava flow average thickness.
Simulation True Simulated Well Under Outside Running Simulated (lava flow lava pixels estimated estimated true lava time lava flow average flow pixels pixels flow pixels (min) longitudinal
thickness pixels distance
in m) (km)
NHESSD
3, 1835–1860, 2015Sensibility analysis of VORIS lava-flow
simulations
A. M. Syavulisembo et al.
Title Page
Abstract Introduction
Conclusions References
Tables Figures
◭ ◮
◭ ◮
Back Close
Full Screen / Esc
Printer-friendly Version Interactive Discussion
Discussion
P
a
per
|
Discussion
P
a
per
|
Discussion
P
a
per
|
Discussion
P
a
per
|
Table 4.Sensibility analysis of DEM parameter.
Simulation Simulated True Under Outside Running Simulated Well- Under Over pixels lava flow estimated true lava time surface estimated estimated estimated
pixels pixels flow pixels (min) km2 surface km2 surface km2 surface km2 S1 31 402 13 094 2274 18 308 14 0.9421 0.39282 0.06822 0.54924
S2 17 652 1690 45 15 962 9 1.5887 0.1521 0.00405 1.43658
NHESSD
3, 1835–1860, 2015Sensibility analysis of VORIS lava-flow
simulations
A. M. Syavulisembo et al.
Title Page
Abstract Introduction
Conclusions References
Tables Figures
◭ ◮
◭ ◮
Back Close
Full Screen / Esc
Printer-friendly Version Interactive Discussion
Discussion
P
a
per
|
Discussion
P
a
per
|
Discussion
P
a
per
|
Discussion
P
a
per
|