Printed in Brazil - ©2005 Sociedade Brasileira de Química 0103 - 5053 $6.00+0.00
A
r
ti
c
le
* e-mail: [email protected]
Determination of Metals in Brazilian Coconut Water Using an Inductively Coupled Plasma
Optical Emission Spectrometer
Rafael A. de Sousa, Nivaldo Baccan and Solange Cadore*
Instituto de Química, Universidade Estadual de Campinas, CP 6154, 13084-971 Campinas - SP, Brazil
A presença de espécies metálicas na água de coco, provenientes de diferentes estados brasileiros, foi investigada. A técnica de ICP OES foi utilizada para determinar Ca, Mg, Mn, Fe, Zn e Cu, sem mineralização da matriz. Utilizando parâmetros instrumentais otimizados as determinações apresentaram RSD geralmente menor que 2% e boa exatidão. Os valores de LOD (mg L-1) foram: Ca 0,06, Mg 0,004, Mn 0,02, Fe 0,16, Zn 0,008 e Cu 0,006. As faixas de concentração (mg L-1) dos analitos nas amostras estudadas foram: Ca (107 - 237), Mg (50 - 88), Mn (1 - 5) e Zn (0,04 - 0,18) e, considerando-se os valores diários recomendados para a ingestão de minerais (VD), estima-se que a ingestão de 400 mL da bebida contribua com 7% do VD para Ca e Mg e 58% do VD para o Mn.
The metal content of coconut water was investigated in samples from different Brazilian states. Ca, Mg, Mn, Fe, Zn and Cu were determined without a mineralization step using the ICP OES technique. Employing optimized instrumental parameters, RSD usually lower than 2% and good accuracy were obtained. LOD values (mg L-1) were: Ca 0.06, Mg 0.004, Mn 0.02, Fe 0.16, Zn 0.008 and Cu 0.006. The concentration ranges (mg L-1) of the analytes in the samples studied were: Ca (107 - 237), Mg (50 - 88), Mn (1 - 5) and Zn (0.04 - 0.18). Considering the Reference Daily Intakes for Minerals (RDI) it was estimated that the nutritional contribution from the ingestion of 400 mL of the beverage corresponds to approximately 7% of the RDI for Ca and Mg and 58% for Mn.
Keywords: metals, natural coconut water, ICP OES
Introduction
The worldwide harvested area and annual production of coconut fruit reaches 10.5 million hectares and 47.8
million metric tons, respectively.1 The edible coconut
products are mainly known in tropical regions2,3 and in
Brazil coconut trees have been cultivated in order to employ the edible pulp of the mature coconut in the production of
coconut flakes, milk, oil and also for coconut cakes.3
Coconut water is the liquid part of the coconut (Cocos
nucifera) endosperm. It has been widely consumed in
tropical countries3 as a refreshing beverage and is also
considered to have some medicinal properties. It may be used as an oral or intravenous liquid for hydration for gastric
and intestinal problems3-8 and also as a solvent for urinary
stones in the endoscopic procedure of MUT (Multiple Ureteral Tubation), since its enzymatic composition
enhances stone dissolution.9 This wide application of
coconut water and its pulp can be justified by their chemical
composition (sugars, proteins, lipids, phenols, citric acid
and mineral salts).3-9
In Brazil the commercial demand for coconut water
has been growing10,11 and due to this, fast and efficient
analytical methods are necessary in order to evaluate the chemical composition of this product. However, considering the inorganic constituents of coconut water, there is no systematic study on the macro and microconstituents present in Brazilian coconut water. Jeganathan used FAAS for the determination of Na, K, Ca
and Mg in the natural coconut water from Sri Lanka.7
Santoso et al. determined mineral elements (Na, K, Ca,
Mg, Mn, Fe, Zn, Cu, B, Al, P and S) in natural coconut water from Indonesia using ICP OES and a wet
mineralization stage.8 In Brazil, Aleixo et al. determined
Se in natural coconut water and coconut milk by graphite furnace atomic absorption spectrometry using the sample suspended in a mixture of tertiary amines soluble in water
and employing Pd as chemical modifier.12 Recently an
Inductively Coupled Plasma Optical Emission
Spectrometry (ICP OES) without a mineralization step.11
Although this matrix and natural coconut water may have similar characteristics, significative differences might be
observed due to the industrialization processes.13 Therefore
studies on analytical methods for the analysis of both natural and industrialized coconut water are still important. ICP OES is and excellent technique for fast and accurate determinations of macro and microconstituents and has been applied in almost all the analytical chemistry areas. The wide employment of this technique for analysis of different kinds of matrices may be attributed to its multi-elemental capability and also because the analytical curves are generally linear over four to six orders of magnitude, which is necessary if the simultaneous aspect of the
technique is to be fully utilized.14-16
In this work an analytical method for the determination of Ca, Mg, Mn, Fe, Zn and Cu in natural coconut water, using ICP OES, is described. Na and K were not included in this study since their content has already been reported
as principal macroconstituents of this matrix4-8 (at about
0.10 and 6.08% of dry matter, respectively). 8 The optimized
experimental parameters were plasma power, nebulization flow rate and torch configuration. Because there is no coconut water standard reference materials the accuracy of the analytical method was evaluated using analyte
addition and recovery experiments17 and also by analyzing
a “Mixed Food Diet” as a reference material.
Experimental
Instrumentation
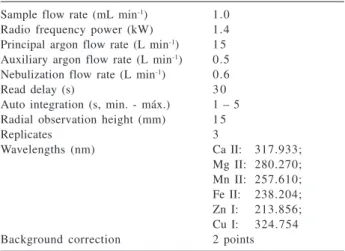
All the measurements were made with a Perkin-Elmer Inductively Coupled Optical Emission Spectrometer, Optima 3000DV, equipped with a peristaltic pump, a cross-flow nebulizer coupled to a Ryton double pass spray chamber of the Scott type and a central torch tube injector with an internal diameter of 2.0 mm. This instrument has a solid state segmented array charge coupled device (SCD) detector and operates sequentially in both radial and axial torch configurations. In the axial viewing mode, the cool plasma recombination area was striped off with a shear gas interface. The entire system is controlled with PE Winlab software. The conditions of operation of the spectrometer are presented in Table 1.
Solutions and reagents
Pure argon (99.996%, White Martins, SP, Brazil) was
used. Analytical solutions (1000 mg L-1 in 2% v/v HNO
3
(Carlo Erba Analyticals)) of each analyte were used. A Mixed Food Diet (High Purity Standards, CRM-MFD, USA,
diluted in 2% v/v HNO3) was used as reference material.
All the glassware used was cleaned with dilute nitric acid (10% v/v) and then with deionized water (MilliQ system,
18.2 MΩ cm). The samples studied corresponded to eight
coconuts from different Brazilian states and are identified according to their origin (São Paulo: SP; Paraíba: PB; Pará: PA; Bahia: BA and BA-A, Minas Gerais: MG; Rio Grande do Norte: RN and Rondônia: RD).
Procedure
The coconut water was taken from the fruit through an orifice opened with a stainless steel knife and then the samples were filtered through a G3 gooch filter (to guarantee the absence of solid particles, in order to avoid clogging the nebulizer). Solutions containing 20% (m/v)
of the matrix were prepared in 2% (v/v) HNO3.
The sample “SP” was spiked with Mn and Fe and analyzed at different nebulization flow rates (from 0.4 to
1.0 L min-1) and plasma powers (from 1.3 to 1.5 kW), in an
univariate form. The results were evaluated comparing the signal emission intensities obtained with these different conditions, considering the signal to noise ratios (SNR) and the signal to background ratios (SBR) for these elements. The signal to noise ratio was calculated by dividing the sample analyte emission intensity by the standard deviation of the blank (n= 10). The signal to background ratio is the
analyte intensity divided by the blank signal.18
Employing optimized plasma power (1.3 kW) and
nebulization flow rate (0.6 L min-1), analyte addition and
recovery experiments for Ca, Mg, Mn, Fe and Zn were carried out for samples “SP” and “PB” in order to evaluate
Table 1. Instrument operating conditions for the determination of
metals in natural coconut water
Sample flow rate (mL min-1) 1.0
Radio frequency power (kW) 1.4 Principal argon flow rate (L min-1) 1 5
Auxiliary argon flow rate (L min-1) 0.5
Nebulization flow rate (L min-1) 0.6
Read delay (s) 3 0
Auto integration (s, min. - máx.) 1 – 5 Radial observation height (mm) 1 5
Replicates 3
Wavelengths (nm) Ca II: 317.933;
matrix interferences and the accuracy of the proposed method. Under these conditions the torch configurations for each analyte were chosen according to the recoveries obtained for the species studied in both samples. The accuracy was also investigated by analysing a sample of Mixed Food Diet, under the optimized instrumental parameters that are presented in Table 1; the radial torch configuration was used for Ca, Mg, Mn and Fe and the axial configuration for Zn and Cu.
Besides samples “SP” and “PB”, six other samples were analysed with the previously optimized instrumental parameters. Regarding the results obtained a confidence interval (t= 95%) was calculated for the elements studied.
Results and Discussion
Instrumental parameters optimization
In order to develop a method for the analysis of coconut water, plasma power and nebulization flow rate were optimized. Using 1.3 kW of plasma power the highest
emission intensities were obtained when 0.6 L min-1 of
nebulization flow rate was used, for both (axial and radial) torch configurations. Concerning the plasma power, it was observed that higher powers implied higher emission intensities. This means that excitation and ionization processes are improved by increasing the power. This behavior allows an increase in sensitivity for the elements studied and
may minimize matrix effects. The employment of 0.6 L min-1
nebulization flow rate produced more intense emission signals when 1.5 kW of plasma power was used. This behavior was similar for all the elements studied when different nebulization flow rates and plasma power were employed.
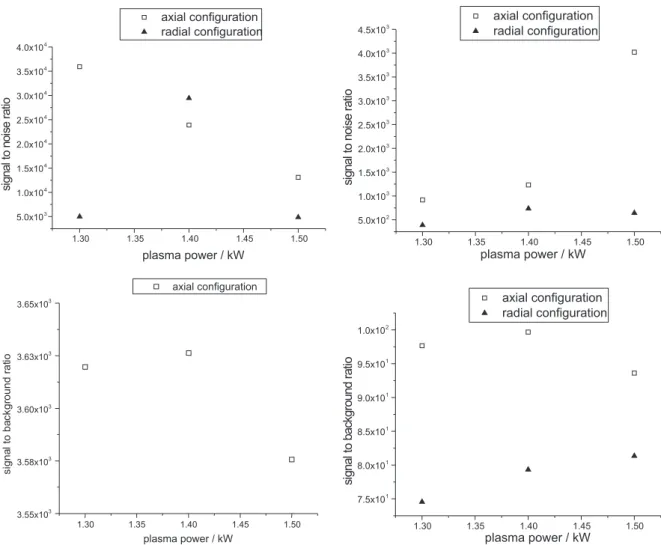
These conditions are relevant mainly for the quantification of the elements that are present in low concentrations in coconut water. However, the use of higher plasma powers may increase the noise level and also the background signal affecting the determination of
microconstituents,19 as Mn and Fe. On the other hand, Silva
et al.20 observed that the degradation of LOD values when
the plasma was operated at high applied powers was not so large, compared to the values in low applied powers. Therefore, the SNR and the SBR for Mn and Fe were determined in order to evaluate the effect of plasma power, over an analytical range of 1.3 to 1.5 kW. This analytical range was chosen concerning the default plasma power of the spectrometer (1.3 kW) and the recommendation of Boss
et al.16 related to the use of 1.5 kW for the analysis of organic
samples. Figure 1 presents the relationships between plasma power and SNR and SBR for the range of 1.3 to 1.5 kW, obtained for the microconstituents Mn and Fe.
The graphics in Figure 1 show that the relation between SNR and plasma power was similar for Mn and Fe using the radial torch configuration. At 1.4 kW the noise values were smaller for Mn and Fe. Considering the background values, it can be noted that the smallest one occurs with 1.4 kW in the axial torch configuration for both analytes, while at the 1.4 and 1.5 kW plasma power levels the backgrounds were smaller for Fe using the radial torch configuration. For Mn SBR values were not obtained in this torch configuration, because blank solution did not produce emission signals. Then, 1.4 kW plasma power was chosen for all the determinations in this study.
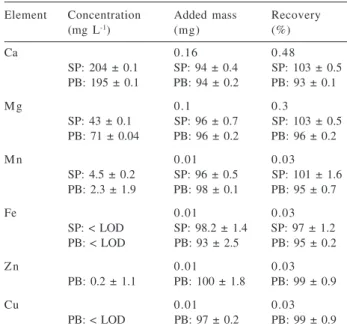
Using these conditions the recoveries of macro (Ca and Mg) and microconstituents (Mn, Fe, Zn and Cu) were between 90 and 110% as can be observed in Table 2. It
means that there is not significant matrix interference17
when operating the plasma under the optimized conditions and the analysis can be carried out without a mineralization step of the sample. In addition, low matrix interference could also be verified comparing the slopes obtained for the analytical and analyte addition curves that showed similar values. Thus, optimized plasma power, nebulizer flow rate and torch configuration lead to determinations with good accuracy and satisfactory precision, since the RSD values were usually lower 2%.
Figures of merit
The limits of detection (LOD) and the limits of quantification (LOQ) were calculated as suggested by
Table 2. Analyte concentrations and RSD for samples “SP” and
“PB” and their recoveries in analyte addition and recovery experi-ments
Element Concentration Added mass Recovery
(mg L-1) (mg) (%)
Ca 0.16 0.48
SP: 204 ± 0.1 SP: 94 ± 0.4 SP: 103 ± 0.5 PB: 195 ± 0.1 PB: 94 ± 0.2 PB: 93 ± 0.1
M g 0.1 0.3
SP: 43 ± 0.1 SP: 96 ± 0.7 SP: 103 ± 0.5 PB: 71 ± 0.04 PB: 96 ± 0.2 PB: 96 ± 0.2
M n 0.01 0.03
SP: 4.5 ± 0.2 SP: 96 ± 0.5 SP: 101 ± 1.6 PB: 2.3 ± 1.9 PB: 98 ± 0.1 PB: 95 ± 0.7
Fe 0.01 0.03
SP: < LOD SP: 98.2 ± 1.4 SP: 97 ± 1.2 PB: < LOD PB: 93 ± 2.5 PB: 95 ± 0.2
Z n 0.01 0.03
PB: 0.2 ± 1.1 PB: 100 ± 1.8 PB: 99 ± 0.9
Cu 0.01 0.03
Montaser: 21 LOD= (3 RSD BEC)/100 and LOQ= 5 LOD,
where RSD is the relative standard deviation (n= 10) and
BEC is the background equivalent concentration,
determined experimentally. The LOD values obtained are presented in Table 3.
Due to the lack of a certified reference material for coconut water the accuracy of the method was evaluated by using the “Mixed Food Diet” reference material, considering the similarity of composition between this sample and coconut water. The results obtained with the proposed procedure are also shown in Table 3, with good agreement concerning the declared values.
Analysis of samples from different Brazilian states
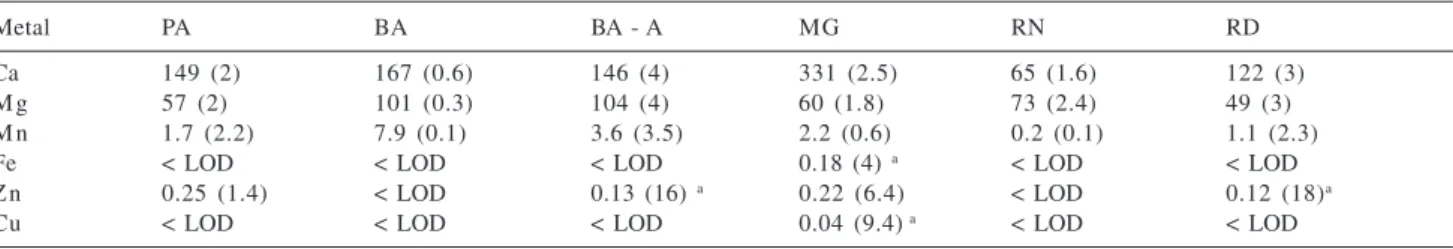
The concentrations of the elements studied in different samples are shown in Table 4, where the values have been corrected for sample dilution.
Comparing the results between the different samples it was verified that Ca and Mg are macroconstituents while Mn and Zn are microconstituents in Brazilian coconut water. In Table 4 some concentrations values are below the LOQ but they may be considered estimated values for the concentrations of these elements because they are higher
than 5 times the LOD values.16
The macro and microconstituents determined in the samples were also reported in the samples from other
countries, 7,8 however their concentrations are at different
levels while the elements Fe and Cu were not detected in Brazilian samples.
In order to establish a range for the concentration (mg
L-1) of the elements studied, a confidence interval (t= 95%)
was calculated for each element: Ca (107 237), Mg (50 -88), Mn (1 - 5) and Zn (0.04 - 0.18). Considering the mean
Table 3. Limits of detection, LOD (mg L-1), and concentrations (mg L-1)
obtained for the Mixed Food Diet material
Element LOD Observed Value Declared Value
Ca 0.06 38.6 ± 0.4 4 0
M g 0.004 15.7 ± 0.1 1 2
M n 0.019 0.20 ± 0.01 0.2
Fe 0.16 0.82 ± 0.01 0.8
Z n 0.008 0.27 ± 0.01 0.3
Cu 0.006 0.06 ± 0.01 0.06
Table 4. Concentrations (mg L-1) and RSD for Ca, Mg, Mn, Fe, Zn and Cu determined in different samples of natural coconut water
Metal PA BA BA - A MG RN RD
Ca 149 (2) 167 (0.6) 146 (4) 331 (2.5) 65 (1.6) 122 (3)
M g 57 (2) 101 (0.3) 104 (4) 60 (1.8) 73 (2.4) 49 (3)
M n 1.7 (2.2) 7.9 (0.1) 3.6 (3.5) 2.2 (0.6) 0.2 (0.1) 1.1 (2.3)
Fe < LOD < LOD < LOD 0.18 (4) a < LOD < LOD
Z n 0.25 (1.4) < LOD 0.13 (16) a 0.22 (6.4) < LOD 0.12 (18)a
Cu < LOD < LOD < LOD 0.04 (9.4) a < LOD < LOD
a Estimated values.
values of these ranges and the “Reference Daily Intakes
for Minerals” (IDR), 22 it can be estimated that the ingestion
of 400 mL of natural coconut water contributes approximately 7% of the Ca and Mg IDR, 58% of the Mn IDR and 0.3% of the Zn IDR.
Conclusions
The proposed method allows the determination of Ca, Mg, Mn, Fe, Zn and Cu in natural coconut water without a mineralization treatment using a radially configured ICP OES for Ca, Mg, Mn and Fe and an axially one for Zn and Cu. Simultaneous, multielemental, fast, precise and accurate determinations are the main characteristics of the proposed analytical method. The analysis of different samples of natural coconut water allow to establish a statistical interval for the concentration of the macro and microconstituents in Brazilian samples and the results may contribute to the determination of the chemical composition of the natural coconut water.
Acknowledgements
The authors gratefully acknowledge Dr. Carol H. Collins for assistance with English in this manuscript and the Fundação de Amparo à Pesquisa do Estado de São Paulo (FAPESP) and the Fundação de Apoio ao Ensino e Pesquisa (FAEP) for financial support of this work.
References
1. FAO – Food and Agricultural Organization of the United Nations – Database on http://apps.fao.org/, accessed in July 2003.
2.Ullmann’s Encyclopedia of Industrial Chemistry; 5th ed., VCH
Publishers: Weinheim, 1987, vol. A10.
3. Campos, C. F.; Souza, P. E. A.; Coelho, J. V.; Glória, M. B. A.;
J. Food Process. Preserv. 1996, 20, 487.
4. Acharya, V. N.; Grepta, K. C.; Golwala, A. F.; Store, S. D.; Sheth, U. K.; Ind. J. Med. Res 1965, 53, 1069.
5. Kubersky, T.; Roberts, A.; Linehan, B.; Bryden, R. N.; Teburare, M.; New Zeal. Med. J. 1979, 90, 98.
6. Cooper, E. S.; Lancet1986, 2, 281.
7. Jeganathan, M.; Commun. Soil Sci. Plant Anal.1992, 23, 2667.
8. Santoso, U.; Kubo, K.; Ota, T.; Tadokoro, T.; Maekawa, A.;
Food Chem. 1996, 57, 299. 9. Macalalag, E. V.; Int. Surg.1987, 72.
10. Brito, N. M.; Navickiene, S.; Polese, L.; Jardim, E. F. G.; Abakerli, R. B; Ribeiro, M. L.; J. Chromatrogr. A2002, 957, 201.
11. De Sousa, R. A.; Silva, J. C. J.; Baccan, N.; Cadore, S.; J. Food Comp. Anal. 2005, 18, 399.
12. Aleixo, P. C.; Nóbrega, J. A.; Santos Júnior, D.; Muller, R. C. S.; Quim. Nova2000, 23, 310.
13. Reilly, C., ed.; Metal Contamination of Food, Elsevier: New York, 1991.
14. Thompson, M.; Walsh, J. N.; Handbook of Inductively Coupled Plasma Spectrometry, 2nd ed., Blackie: Glasgow, 1989.
15. Skoog, D. A.; Holler. F. J.; Nieman, T. A.; Principles of Instrumental Analysis, 5th ed., Saunders College Publishing:
Philadelphia, 1998.
16. Boss, C. B.; Fredeen, K. J.; Concepts, Instrumentation and Techniques in Inductively Coupled Plasma Optical Emission
Spectrometry, 2nd ed, Perkin-Elmer Corp.: Norwalk, 1999.
17. Crosby, N. T.; Day, J. A.; Holcombe, D. G.;Treble, R. D.; Prichard, F. E.; Quality in Analytical Chemistry Laboratory, John Wiley: Chichester, 1995.
18. Thomsen, V.; Roberts, G.; Burgess, K.; Spectroscopy2000,
15, 33.
19. Brenner, I. B.; Zander, A.; Cole, M.; Wiseman, A.; J. Anal. At. Spectrom. 1997, 12, 897.
20. Silva, J. C. J.; Baccan, N.; Nóbrega, J. A.; J. Braz. Chem. Soc.,
2003, 14, 310.
21. Montaser, A.; Golightly, D. W.; Inductively Coupled Plasmas in Analytical Atomic Spectrometry, 2nd ed, VCH: New York, 1992.
22. Altman, T. A.; FDA and USDA Nutrition Labeling Guide – Decision Diagrams, Ckecklists and Regulations; Technomic Publishing Co.: Pennsylvania, 1998.
Received: April 7, 2004
Published on the web: March 4, 2005