Review
Electrocardiographic Changes
in Certain Cardiovascular Physiological
and Pathological Settings.
Impact on Coronary Artery Bypass Grafting.
Dimitar Simov
Cardiac Surgery Department University City Clinic Sofia, Bulgaria
E-mail: [email protected]
Received: November 11, 2015 Accepted: February 15, 2016
Published: March 31, 2016
Abstract: Review on electrocardiographic changes provoked by aging, diagnostic tests,
cardiac surgery, hemodialysis, diabetes, etc., is the objective of the current material. Several electrocardiographic (ECG) parameters that are well known risk markers of arrhythmias, incidental heart failure and sudden cardiac death (SCD) are discussed: QRS amplitude, QRS morphology, QRS duration, QRS alternans, T-wave amplitude, T-wave morphology, T-wave alternans, negative T-waves, 3D-spatial angle between maximal QRS and T vectors of the vectorcardiographic loops, ST-segment elevation, QT-interval dispersion, and heart rate. All reviewed parameters are compared with the results on the ECG-alterations, induced by coronary artery bypass grafting (CABG) surgery. Two parameters showed an
improvement in the patients’ condition: QRS-T angle and cardiac autonomic innervation while two others (T-wave alternans and heart rate) indicated deterioration. We tend to assume that the deterioration in this early operative period is an effect of the post-surgery trauma. We speculate that this effect will fade away in a period of a month and more
after surgery, and we intend to conduct such a research in the future. The analysis of ECG’s
changes will help to better assess the impact of the CABG surgery.
Keywords: Coronary artery bypass grafting, Electrocardiography, T-wave alternans,
ST-elevation, Hearth failure, Cardiac death.
1. Introduction
There is a lack, in the scientific literature, of assessing the electrocardiographic (ECG) changes, due to coronary artery bypass grafting (CABG), and relating them to the cardiac risk markers. An attempt to investigate the changes of the ECG parameters induced by CABG was made by Simov et al., 2014 and Simov et al., 2015. The current review analyses the ECG parameters: QRS amplitude, QRS morphology, T-wave amplitude, T-wave morphology, QRS alternans, T-wave alternans, negative T-waves, 3D-spatial angle between maximal QRS and T vectors of the vectorcardiographic loops, ST-segment elevation, QT-interval dispersion, QRS duration, heart rate, heart rate variability, cardiac autonomic innervation. The change of ECG parameters is studied in several physiological and pathological settings:
aging [Bortolan and Christov, 2001; Bortolan et al., 2004];
diagnostic tests for Brugada syndrome [Batchvarov et al., 2009; Batchvarov et al., 2010; Batchvarov et al., 2005; Bortolan et al., 2009b];
cardiac surgery [Pradeep et al., 2010; Morin et al., 2011; Simov et al., 2015;
Airaksinen et al., 1987; Airaksinen et al., 1987; Bellwon et al., 1996; Hugue et al., 1994];
hemodialysis [Simova et al., 2015a; Ojanen et al., 1999; Astan et al., 2015;
Christov et al., 2015];
diabetes [Christov et al., 2012; Simova et al., 2015c];
heart failure [Kashani and Barold, 2005; Iuliano et al., 2002]; left ventrical hypertrophy [Singla et al., 2015; Meijs et al., 2007];
angiographically significant coronary artery disease (AS-CAD) [Battler et al., 1979; Berman et al., 1980; Michaelides et al., 1990].
All reviewed parameters will be compared with the results of the CABG-induced ECG-alterations [Simov et al., 2014; Simov et al., 2015], to better assess the impact of the surgery.
2. ECG parameters
With automatic parameter’s measurement, errors can occur in the presence of noise or at the
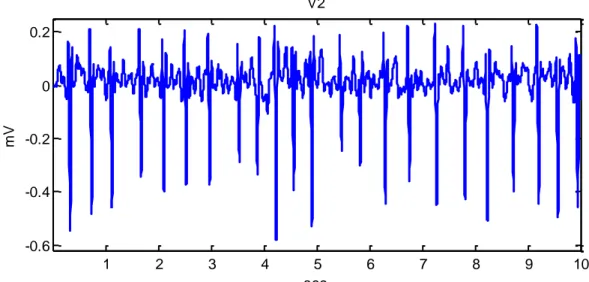
choice of atypical parameter. Two techniques of automatic measurement of the amplitudes are applied in order to avoid these errors: sum of amplitudes of all the 12-leads [Madias 2003] and mean P-QRT-T interval in a certain lead. Good example of averaging can be seen in the work of Simova et al., 2015a, where the amplitude fluctuation of QRS and the uncertainty of the T-waves, due to atrial fibrillation seen in Fig. 1, is compensated by averaging of several heart beats in Fig. 2.
1 2 3 4 5 6 7 8 9 10
-0.6 -0.4 -0.2 0 0.2
V2
sec
mV
Fig. 11 Lead V2 of a patient with atrial fibrillation
1
0.10.20.30.40.5 -0.6
-0.4 -0.2 0 0.2
V2 mean
sec
mV
Fig. 21 Mean P-QRS-T interval of the ECG in Fig. 1
ECG signals were preprocessed to eliminate or suppress powerline interference [Levkov et al., 2005], drift [Daskalov et al., 1998] and electromyographic noise [Christov and Daskalov, 1999; Bortolan and Christov, 2015].
QRS detection was applied using the adaptive method of Christov, 2007. Identification of characteristic points as onsets and offsets of QRS and T-wave, and all measurements were automatically done [Christov and Simova, 2007, Simova and Christov, 2007].
2.1. QRS amplitude and morphology
The QRS and T-wave amplitude changes will be discussed firstly in hemodialysis (HD) where these changes are more expressed. A significant increase of the QRS amplitude in post-HD period has been reported [Simova et al., 2015a; Ojanen et al., 1999; Astan et al., 2015]. Many authors are claiming that the mechanism involved is an increase of electrical resistance of tissues around the heart caused by post-HD decrease of interstitial fluid [Ojanen et al., 1999; Astan et al., 2015]. Christov et al., 2015 agree with the above, but the authors assert that the post-HD increase of the resistance is not a reason to increase the QRS amplitude, as it is claimed in [Ojanen et al., 1999; Astan et al., 2015]), since:
Post-HD body resistance change will shift all ECG-waves in one direction, but T-wave shifts in the opposite direction [Simova et al., 2015a; Astan et al., 2015]. Changes in ECG amplitudes during the systole are observed in hypertonic patients
too [Bacharova et al., 2007; Aeschbacher et al., 2016], with no change in body resistance.
Fig. 3 Equivalent electrical circuit of the body-to-electrocardiograph connection
Astan et al., 2015 claim that the HD ECG changes ‘are of extra-cardiac origin’. Christov et al., 2015 speculate that these are heart-intrinsic changes, a reaction to the heart-preload, and related to the interaction of blood pressure, ventricular contraction velocity and excitation wave propagation. Decrease of fluid leads to reduction of heart volume and relaxation of the heart-preload during the supraventricular (P-wave) and ventricular (QRS-complex) systole, hence their increase. This is confirmed by the post-HD decrease of the systolic blood pressure
Simova et al., 2015a.
The increase of the post-HD QRS amplitudes is inversely proportional to the extracellular water and blood volume decrease, no matter if the impact is direct [Astan et al., 2015], or indirect trough the blood pressure Simova et al., 2015a. For that reason, the QRS decrease could be used as an indicator of the risk of extracellular water and blood volume increase.
Pradeep et al., 2010 claim that in cardiac surgery, and especially during (CABG), high
volumes of intravenous fluid are associated with increased 90 days’ risk of cardiac mortality.
Morin et al., 2011 argue that fluid overload of ≥ 5 litres increases the incidence of post-operative complications (p < 0.001 in comparison with an overload of 1-5 litres).
Saltykova et al., 2006 are directly relating the increase of QRS voltage with dehydration.
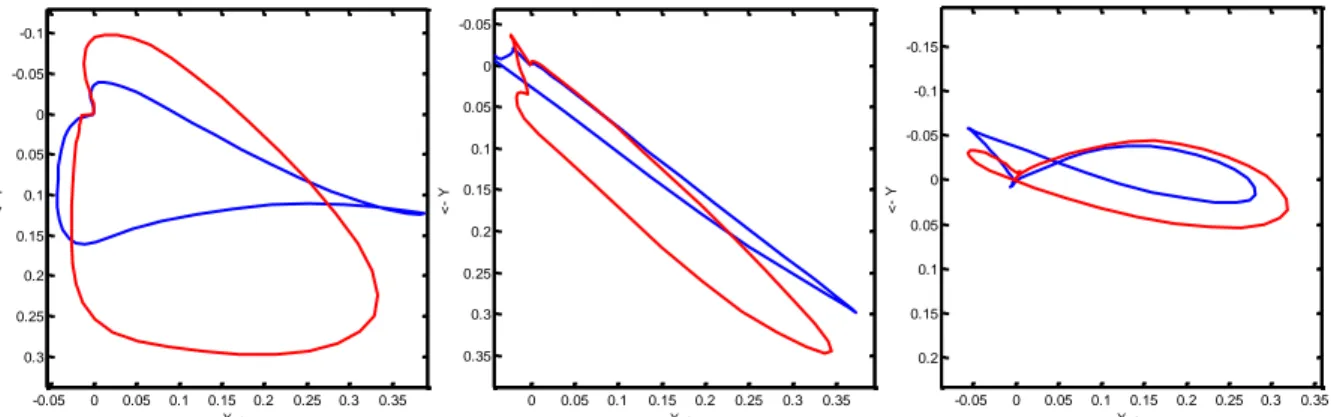
Simova et al., 2014 report for a significant increase of the QRS-loop area and QRS maximal vector in a vectorcardiographic study on hemodialysis. Fig. 4 illustrates these changes.
-0.05 0 0.05 0.1 0.15 0.2 0.25 0.3 0.35 -0.1
-0.05
0
0.05
0.1
0.15
0.2
0.25
0.3
X ->
<
-
Y
AGK
0 0.05 0.1 0.15 0.2 0.25 0.3 0.35 -0.05
0
0.05
0.1
0.15
0.2
0.25
0.3
0.35
X ->
<
-
Y
AIA
-0.05 0 0.05 0.1 0.15 0.2 0.25 0.3 0.35 -0.15
-0.1
-0.05
0
0.05
0.1
0.15
0.2
X ->
<
-
Y
ALG
Fig. 42 Typical examples of QRS loops before (blue trace) and after (red trace) haemodialysis
2
Fig. 4 is taken from Simova et al., 2014with the kind permission of the authors
Heart
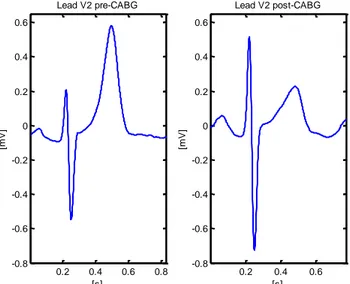
CABG-induced QRS amplitude decrease is shown in Fig. 5, which could be because of increase of water and blood volume of the chosen patient. Inversed situation is shown in Fig. 6. The normal volume of fluid administration during surgery is 1500-2000 ml. We could speculate that QRS amplitude decrease in Fig. 5 could be attributed to a positive fluid balance in the early post-operative period.
0.2 0.4 0.6 0.8
-2 -1.5 -1 -0.5 0 0.5
[s]
[m
V
]
Lead V2 pre-CABG
0.2 0.4 0.6 0.8
-2 -1.5 -1 -0.5 0 0.5
[s]
[m
V
]
Lead V2 post-CABG
Fig. 5 Example of CABG-induced changes in ECG:
The QRS amplitude is decreasing, while the T-wave amplitude is increasing.
0.2 0.4 0.6 0.8
-0.8 -0.6 -0.4 -0.2 0 0.2 0.4 0.6
[s]
[m
V
]
Lead V2 pre-CABG
0.2 0.4 0.6
-0.8 -0.6 -0.4 -0.2 0 0.2 0.4 0.6
[s]
[m
V
]
Lead V2 post-CABG
Fig. 6 Another example of CABG-induced changes in ECG:
The QRS amplitude is increasing, while the T-wave amplitude is decreasing.
3 4 5 6 7 -0.5
0 0.5 1
Q
R
Sp
o
s
t
Q
R
Sp
re
day after CABG
Fig. 7 Boxplot of the variation of QRS amplitude (QRSpost– QRSpre) with respect to the days
after surgery. Red segments are the median values; the blue boxes are the 25th and
75thpercentiles; the whiskers (black ‘T’ marks) extend to the most extreme data points
that are not outliers; red ‘+’ is an outlier.
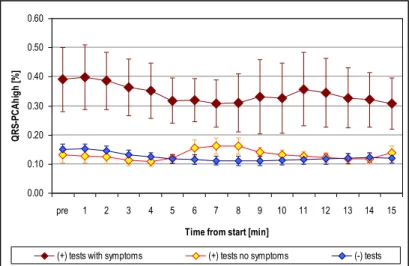
Batchvarov et al., 2010 have analysed the QRS morphology by Principal Component Analysis (PCA) ratio of 2nd to 1st eigenvalue during diagnostic pharmacological (Ajmaline) test for suspected Brugada syndrome. Among patients with positive tests, those with symptoms had higher QRS-PCA before (p = 0.003) and during maximum drug effect (p = 0.001) than those without symptoms (see Fig. 8). Following Ajmaline, QRS-PCA decreased significantly in patients with negative (n = 73) (p = 0.00004), but not in those with positive tests (p = 0.098). Symptomatic patients with non-diagnostic resting ECGs have increased depolarisation heterogeneity. PCA could detect depolarisation heterogeity and thus help the diagnosis and risk stratification of patients with Brugada syndrome.
0.00 0.10 0.20 0.30 0.40 0.50 0.60
pre 1 2 3 4 5 6 7 8 9 10 11 12 13 14 15
Time from start [min]
Q
R
S
-P
C
A
h
ig
h
[%
]
(+) tests with symptoms (+) tests no symptoms (-) tests
Fig. 83 Dynamic changes in QRS-PCA during pharmacological testing. Data are presented as
mean ± SE. Note that the dynamic profile of QRS-PCA of asymptomatic patients
with positive tests (yellow bars) is similar to that of patients with negative tests (blue bars) and is distinctly different from that of patients with positive tests who had history
of arrhythmia-related symptoms.
3
Battler et al., 1979, analyzing the QRS changes in a group of healthy and angiographically significant coronary artery disease subjects (AS-CAD), have concluded that amplitude changes during exercise testing have little diagnostic value and are not related to exercise-induced changes.
Another study of AS-CAD patients with chest pain have claimed that in subjects who have stopped exercise because of cardiac symptoms, the product of heart rate times blood pressure have been significantly lower when the QRS amplitude increases [Berman et al., 1980]. Thus, the mechanism for the QRS increase with exercise in patients with coronary artery disease appeared to be related to abnormalities in left ventricular function. Some authors have gone even further, of predicting CAD by the exercise induced change of the composite
QRS index, called ‘Athens QRS’, calculated on the exercise-induced changes of the Q-, R-,
and S-waves [Michaelides et al., 1990].
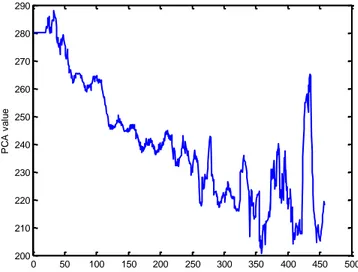
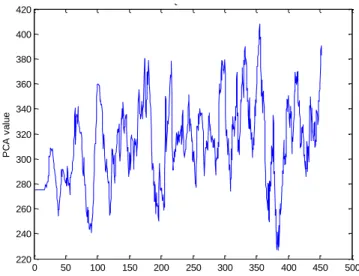
Christov et al., 2013 have analyzed the load dependent changes of cardiac depolarization during exercise ECG test. The authors have assigned 2 clusters of load dependant changes based on the PCA of the QRS complex: homogeneous – with pronounced increasing or decreasing trends (Fig. 9), and heterogeneous – all the rest, for example those of: no significant change of the baseline PCA, bidirectional (+/– or –/+) behavior of PCA, etc. (Fig. 10).
Statistical analysis of the classification of the trends produced a significant difference in the dyslipidemia group (p < 0.05). It was interesting to note a higher percentage of PCA_QRS heterogeneous classification in groups 'with' vs. 'without' risk factors.
0 50 100 150 200 250 300 350 400 450 500
200 210 220 230 240 250 260 270 280 290
PCA1 of QRS 4204246640
[s]
P
C
A
v
a
lu
e
Fig. 94 Example of homogeneous PCA_QRS with pronounced decreasing trend
4
Figs. 9 and 10 are taken from Christov et al., 2013with the kind permission of the authors. The PCA values in
0 50 100 150 200 250 300 350 400 450 500 220
240 260 280 300 320 340 360 380 400 420
PCA1 of QRS 4507240159
[s]
P
C
A
v
a
lu
e
Fig. 104 Example of heterogeneous PCA_QRS with no significant change of the baseline
2.2. QRS duration
According to an Expert Consensus Document [Surawicz et al., 2009], the QRS duration depends on the method of measurement, age, and gender. Global intervals, from the earliest onset to the latest offset of the waveform in all leads are the desirable standard. Global intervals, by definition, will be longer than measurements from single leads. QRS duration may increase with increasing heart size. In addition, the QRS complex is wider in the precordial than in the limb leads. The committee recommends that for the present, QRS duration of greater than 110 ms in subjects older than 16 years of age be regarded as abnormal.
It has been found that a prolonged QRS from baseline ECG is an independent predictor of increased total mortality and sudden cardiac death among patients with cardiomyopathy,
clinical heart failure, and ≥ 10 premature ventricular contractions per hour [Iuliano et al., 2002]. A QRS duration > 120 ms has been shown to have a 99% specificity for left ventricular dysfunction and may be a potent marker for adverse outcome.
Kashani and Barold, 2005 explore the significance of QRS complex duration in patients with heart failure. Wide QRS complex reflecting left-sided intraventricular conduction delay in patients with heart failure is associated with more advanced myocardial disease, worse LV function, poorer prognosis, and a higher all-cause mortality rate compared with patients with a narrow QRS complex.
Astan et al., 2015 have found statistically significant increase of the QRS prolongation after hemodialysis, from 87.88 ± 21.52 to 97.38 ± 20.56 ms (p < 0.001).
2.3. T-wave morphology and amplitude
T-wave morphology is very representative in detection of T-wave alternans and risk stratification after myocardial infarction [Zabel et al., 2000]. Breslow et al., 1986 have studied the changes of T-wave morphology following anaesthesia and surgery.
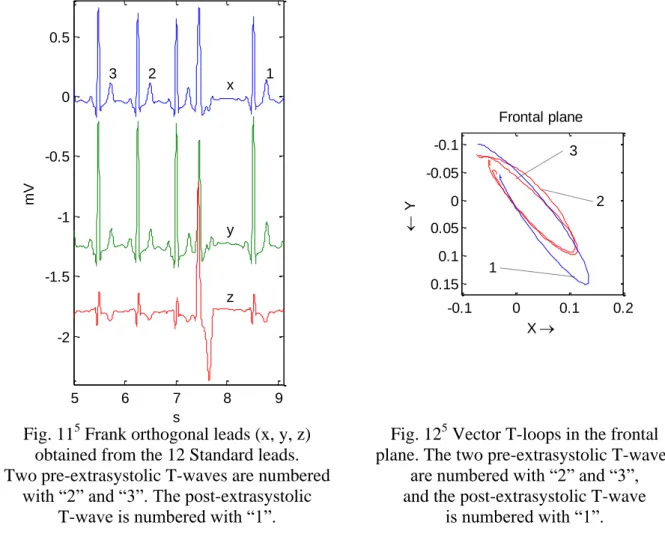
The authors claim that in healthy subjects, ventricular repolarization of the 1st sinus beat immediately following a ventricular extrasystolic beat can be modulated, and the repolarization heterogeneity is considerable even in absence of visible changes of the T-wave of the 12-lead ECG. At least theoretically, this modulatory influence may have potentially arrhythmogenic effect.
T-wave morphology changes are very typical for Brugada syndrome. In a study of Batchvarov et al., 2009] the right ventricular repolarisation dispersion is evaluated by the method of PCA and the ratio of 2nd to 1st eigenvalue is used. Two different PCA values are obtained: from the standard V1 ÷ V3 leads (PCAstand) and from V1h ÷ V3h placed and recorded one intercostal
space higher (PCAhigh). The authors prove that during pharmacological test with Ajmaline for
suspected Brugada syndrome, the PCA increases sufficiently during positive test, compared to patients with negative tests. Two figures are illustrating these findings.
5 6 7 8 9
-2 -1.5 -1 -0.5 0 0.5
s
mV
x
y
z
3 2 1
-0.1 0 0.1 0.2 -0.1
-0.05
0
0.05
0.1
0.15
X
Y
3
2
1
Frontal plane
Fig. 115 Frank orthogonal leads (x, y, z) obtained from the 12 Standard leads. Two pre-extrasystolic T-waves are numbered
with “2” and “3”. The post-extrasystolic
T-wave is numbered with “1”.
Fig. 125 Vector T-loops in the frontal plane. The two pre-extrasystolic T-waves
are numbered with “2” and “3”,
and the post-extrasystolic T-wave
is numbered with “1”.
Fig. 13 presents an example of the dynamic changes in PCAstand and PCAhigh (mean ± standard
deviation (SD)) during a positive test in a 15-year-old girl with syncope and a family history of BS (top panel), and during a negative test in a 66-year-old asymptomatic man with family history of BS and SCD (bottom panel). X-axis is the time in minutes after the start of Ajmaline injection.
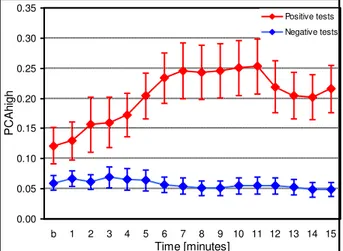
Fig. 14 presents the dynamic changes in PCAhigh during the pharmacological test in all
patients of the two groups.
5
0.0 0.2 0.4 0.6 0.8 1.0
B 1 2 3 4 5 6 7 8 9 10 11 12 13 14 15
Time [minutes]
P
C
A
V1,V2,V3
V1h,V2h,V3h
0.0 0.2 0.4 0.6 0.8 1.0
B 1 2 3 4 5 6 7 8 9 10 11 12 13 14 15
Time [minutes]
P
C
A
V1,V2,V3
V1h,V2h,V3h
Fig. 136 PCAstand and PCAhigh during a positive test (top panel), and during a negative test
(bottom panel). Data are presented as mean ± SD.
For more clear visibility and in order to avoid overlapping values, only SD+ for PCAstand and SD– for PCAhigh are shown.
0.00 0.05 0.10 0.15 0.20 0.25 0.30 0.35
b 1 2 3 4 5 6 7 8 9 10 11 12 13 14 15
Time [minutes]
PC
Ah
ig
h
Positive tests Negative tests
Fig. 146 Dynamic changes in PCAhigh during the Pharmacological tests in patients with
positive and negative tests. Data are presented as mean ± SD.
Batchvarov et al., 2008 have analysed the effect of heart rate and body position on the complexity of the QRS and T-wave quantified by the ratio of 2nd/1st eigenvalue from PCA. They have found that in healthy subjects, the linear correlation coefficient between the PCA parameters of the T-wave and the RR interval varies widely between different subjects in the supine position, and even more in standing position (Fig. 15).
In several studies, Simova et al., 2015a have proved that the T-wave amplitude change in standard 12-leads ECG, as well as the alteration of maximal vector of the T-loop in vectorcardiography [Simova et al., 2014] was inversely dependant to sodium (Na), and directly dependant to potassium (K) concentration in blood. That is why T-wave amplitude shift can be used as an indicator for electrolyte concentration.
Coustet et al., 2015 are investigating the ECG changes during exercise in acute hypoxia and susceptibility to severe high-altitude illnesses. They have found that the QRS and T-wave amplitudes and the Sokolow index [Sokolow and Lyon, 1949] decrease in hypoxia.
Load dependent changes of the T-wave have been studied in world-class athletes [Iellamo et
6
al., 2004]. A decrease of electrocardiographic T-wave voltage with increasing training loads has been reported and ascribed to training-related adaptation in sympathetic activity to the ventricles.
Subject 1
0 0.3 0.6 0.9
400 700 1000 1300 1600 RR interval [ms]
T-P
C
A
[ms
]
supine standing
Subject 2
0 0.3 0.6 0.9
400 700 1000 1300 1600 RR interval [ms]
T-P
C
A
[%]
supine
standing
Fig. 157 The figure presents an example of distinctly different change in the T-wave PCA and RR interval relationship with transition from supine to standing position in two subjects.
Christov et al., 2013 have analyzed the load dependent changes of cardiac repolarization during exercise ECG test. As it was mentioned before, 2 clusters have been assigned: homogeneous and heterogeneous. Statistical analysis of the classification of the trends of PCA index of the T-wave produced a significant difference considering the AS-CAD (yes/no) and PCI (yes/no, p < 0.05). In this case, it was interesting to observe a higher percentage of PCA_T homogeneous classification in groups 'with' vs. 'without' risk factors.
Load dependent changes of the T-wave have been studied in world-class athletes [Iellamo et al., 2004]. A decrease of electrocardiographic T-wave voltage with increasing training loads has been reported and ascribed to training-related adaptation in sympathetic activity to the ventricles.
Aeschbacher et al., 2016 claim that there exists relationship of T-wave amplitudes with ambulatory hypertension in young and healthy adults. According to their study the normotensive persons (n = 640) have smaller T-wave amplitudes than the hypertensive ones (n = 430). For lead V2 the mean values are 0.45 mV for normotensive vs. 0.64 mV for hypertensive, p < 0.0001.
CABG-induced T-wave amplitude decrease in our study [Simov et al., 2015] were not significant (0.34 ± 0.28 mV in pre-CABG vs. 0.24 ± 0.24 mV in post-CABG, p = 0.04). It means that there is no considerable change of electrolyte concentration, and especially of those electrolytes in the blood that are responsible for the T-wave change – sodium, and potassium [Simova et al., 2015a, Simova et al., 2014]. Significant decrease in post-CABG T-wave amplitude is shown in Figure 6, but it is rather an exception.
2.4. T-wave alternans
T-wave alternans (TWA) in ECG is an electrophysiological phenomenon and is a proven risk marker for occurrence of malignant arrhythmias, Torsade de Pointes, and cardiac death. TWA appears in ECG as a consistent fluctuation in repolarization morphology on every-other
7
beat basis. In most cases, TWA is in the microvolt range, invisible to the naked eye, and can be detected only by a specialized computer ECG analysis [Bortolan and Christov., 2012a]. It was found that TWA is more common among diabetics [Simova et al., 2015c; Christov et al., 2011] and patients who undergo CABG, and is predictor of postoperative atrial fibrillation [Khoueiry et al., 2014]. In a 2-year follow up, Bloomfield et al., 2004 prove that T-wave alternans distinguishes better than QRS duration between patients likely and patients not likely to benefit from implanted cardiac defibrillator therapy.
In patients with Brugada syndrome, both macroscopic [Tada et al., 2008; Takagi et al., 2002] and microscopic TWA [Ikeda et al., 2001; Kirchhof et al., 2004] have been described, although their value for prediction of the arrhythmic risk in BS is still unclear [Tada et al., 2008; Ikeda et al., 2001; Kirchhof et al., 2004].
Batchvarov et al., 2005 and Bortolan et al., 2009b report for irregular ST-T wave alternans on patients with positive Ajmaline test (i.e. likely carriers of mutations for Brugada syndrome) compared to those with negative tests. It is noteworthy that patients with positive tests and increased ST-T variability had more frequently symptoms than those with negative tests and low ST-T variability, which suggests a possible role of increased repolarization variability in arrhythmogenesis.
TWA episodes were detected 2.5 ± 2.8 times in the pre-operative group in our study on 20 patients [Simov et al., 2015], and 3.8 ± 343 times in the post-operative group (p = 0.08). Because of the small number of patients a significant statistical result was not obtained, but comparing TWA_pre with TWA_post there is a clear upward trend. The increase of TWA_post episodes compared to TWA_pre was associated neither with patients’ age, nor with the number of bypasses. A fading away effect – reduction of TWA_post episodes related to the days passed from the coronary artery bypass surgery, was not observed at a sufficient rate.
The increase of TWA episodes after coronary bypass surgery could be associated with an elevated risk of malignant arrhythmias. Possible explanation of the TWA_post increase could be the increased post- HR.
2.5. Negative T-waves
T-wave inversion (negative T-waves) is a common ECG abnormality of cardiomyopathies such as hypertrophic cardiomyopathy and arrhythmogenic right ventricular cardiomyopathy, which are leading causes of sudden cardiac death. The frequency of the inverted T-waves depends on the lead (remissive from V1 to V6) and on age. The prevalence of T-wave inversion decreases significantly after puberty [Migliore et al., 2012]. Walder and Spodick, 1991 report for a striking female T-wave inversion predominance’ – 82 women vs. 18 men,
p < 0.0005.
In their study on left ventricular hypertrophy in 20903 athletes, Singla et al., 2015 are highlighting that the increases of R- and S-wave voltages do not predict cardio vascular mortality and can be considered physiological. The risk associated with ECG-left ventricular hypertrophy is due to ST depression and T-wave inversion.
almost uniform distribution in the pre- and post-stage (2:3 respectively) does not give us the right to conclude about the influence of CABG on the T-wave inversion. The relation between TWA and the inverted T-wave, however, is of interest: mean of 5.0 ± 2.4 episodes of TWA in subjects with negative T-waves, vs. mean of 2.9 ± 3.2 episodes of TWA in those with normal T-waves.
2.6. QRS alternans
The clinical significance of QRS alternans (QRSA) however is less well studied. There is some data that this ECG parameter may be of some value determining the risk of SCD and the need for device therapy in selected patients [Das et al., 2010], although other clinical trials do not confirm these results [Morady et al., 1991].
In a study of 107 subjects undergoing stress ECG test, Christov et al., 2012 have found that TWA and QRSA were significantly higher in the percutaneous coronary intervention (PCI) group compared with the non-PCI one. Presence of diabetes attenuates the difference between PCI and non-PCI groups regarding TWA and QRSA values. The same authors [Christov et al., 2010], working with a smaller group of 57 patients report that individuals with positive stress ECG test had significantly higher TWA&QRSA values compared to patients with negative stress test (2.32 vs. 1.66, p < 0.001 for TWA and 1.77 vs. 1.11, p = 0.003, for QRS). Patients with AS_CAD had significantly higher QRSA, but not TWA, values (1.6 and 1.1, respectively; p = 0.017).
A study of QRSA has been performed in patients with suspected Brugada syndrome [Bortolan et al., 2009b]. Patients with positive pharmacological tests had increased QRS alternans. This has not been reported so far but is not unexpected in light of recent studies which demonstrated the role of depolarization abnormalities in the genesis of arrhythmias in Brugada syndrome [Lambiase et al., 2009].
In the study [Simov et al., 2015] QRSA episodes were detected 1.52 ± 2.27 times in the pre-operative group of our study and 1.66 ± 1.82 times in the post-operative group (p = n.s.).
2.7. QRS-T angle
A wide QRS-T angle between the maximal vectors of the QRS- and T-loops in vectorcardiogram has emerged as an abnormal electrocardiographic repolarization marker in stratifying cardiac risk in various study populations. Wide spatial and frontal QRS-T angle values have been shown to be predictive of cardiovascular events including incident heart failure, ventricular arrhythmias, and SCD. Wide QRS-T angle has also been found to be associated with cardiac mortality in the general population.
In an analysis of ‘Italian Longitudinal Study on Aging’ database, Bortolan and Christov, 2001
hypertension group; 101 ± 52° for males vs. 92 ± 55° for females (p = n.s.) in a group of cardiac diseases. All study of the ‘Italian Longitudinal Study on Aging’ database has been summarized in a review on the diagnostic potentials of the T-loop morphology in vectorcardiography [Bortolan et al., 2009a].
Among CABG patients, it was found that wide frontal QRS-T angle is an independent correlate of postoperative hospital length of stay and an independent predictor of vasopressor agent/IABP support requirement postoperatively [Kaya et al., 2015]. Kardys et al., 2003
specify 3 groups in relation to the QRS-T angle: normal (0 to 105°), borderline (105 to 135°),
and abnormal (135 to 180°). Karabacak et al., 2014 are claiming that the QRS-T angle in the
frontal plane can be a prognostic factor in the early postoperative period of patients CABG.
In our study [Simov et al., 2015] the QRS-T angle was decreased from 83.7 ± 53.8° in the pre-stage to 52.2 ± 54.0° in the post stage (p = 0.07).
2.8. ST segment elevation
Hemodialysis is often associated with a risk of cardiac dysfunction. In a paper of Nakamura et al., 2000, measurements and analysis of ST-elevation in pre- and post-HD patients are used for prediction of coronary artery disease. The authors report HD-induced ST-elevation
of ≥ 1 mV, in 18 out of 61 patients. During follow-up of 21 ± 2 months, all patients from the group with ST-elevation, as well as 21 from the rest of the study group experienced cardiac events. The authors explain this common manifestation of symptomatic and silent myocardial ischemia by reduced coronary artery oxygen delivery and increased myocardial oxygen demand during HD. Taki et al., 2006also report “oxidative stress” in HD patients.
Another reason for the ST-elevation increase during HD could be associated to the hemodynamic instability, and especially to the reduction in myocardial blood flow [McIntyre et al., 2007]. Blood flow reduction during HD was analyzed by serial measurements using positron emission tomography.
Simova et al., 2015a report for an increase (upward shift) in ST with 0.02 mV (p = 0.03) in their entire group of study on hemodialysis. According to Saravanan and Davidson, 2010
the HD causes sudden shifts in volume and electrolytes within a short time that alters the physiological milieu. This leads to reduced coronary artery oxygen delivery while increasing myocardial oxygen demand during HD [Nakamura et al., 2000], the so-called ‘oxidative
stress’ [Taki et al., 2006]. The HD-induced ‘silent ischemia’, expressed as a ST-deviation in
ECG, leads to sudden changes in the myocardial vulnerability to serious arrhythmias [Saravanan and Davidson, 2010,]. The ST-deviation can be used for prediction of coronary artery disease [Singh et al., 1994].
ST-segment elevation is common during the early postoperative period after CABG in patients without enzymatic or echocardiographic evidence of preoperative myocardial infarction (MI). There are studies proving that these changes are not associated with increased postoperative morbidity or mortality [Loeb et al., 2007], but probably their interpretation and prognostic value could be more precise in context of other precise ECG parameters.
0.1 0.2 0.3 0.4 0.5 0.6 -3
-2.5 -2 -1.5 -1 -0.5 0 0.5 1
pre-hemodialysis
STelev=0.17mV J
sec
mV
0.1 0.2 0.3 0.4 0.5 0.6
-3 -2.5 -2 -1.5 -1 -0.5 0 0.5 1
post-hemodialysis
STelev=0.29mV J
sec
mV
Fig. 168 P-QRS-T interval of one and the same individual, pre- and post-hemodialysis. The pre-HD ST-elevation = 0.17 mV, while the post-HD ST-elevation = 0.29 mV. The QRS amplitude increases with approximately 1.8 mV, while the T-wave amplitude
decreases with approximately 0.4 mV
The patients included in our study [Simov et al., 2015] underwent planed CABG surgery without symptoms of ST-elevation myocardial infarction (STEMI), where emergency is required. Their pre-CABG ST-elevation was low 0.05 ± 0.06 mV and became 0.06 ± 0.09 mV after surgery (p = n.s.). None of the patients showed significant ST elevation in the post-CABG stage, which contradicts the assertion that ST-segment changes are common during the early postoperative period after CABG [Loeb et al., 2007]. The reason for this controversy is probably our small database of 23 individuals, which we currently use.
2.9. Heart rate
In a study with more than 30 years follow-up, Kannel et al., 2015 have found that in both sexes, at all ages, all-cause, cardiovascular and coronary mortality rates increased progressively in relation to heart rate. Fox et al., 2008 compare a group with a heart rate of 70 bpm or greater, versus a group of less than 70 bpm. They have found significantly increased risk of cardiovascular death, hospital admissions due to heart failure or MI, and coronary revascularisation for the group of patients with heart rate ≥ 70 bpm. Furthermore, they declare that for every heart rate increase with 5 bpm, there is an increase in cardiovascular death (8%), heart failure admission (16%), MI admission (7%), and coronary revascularisation (8%).
Heart rate is the only parameter that demonstrates a significant change from pre-CABG (68.1 ± 9.2) to post-CABG (82.14 ± 10.5) in our study [Simov et al., 2015], p = 0.001. It should be noted, however, that there could be many factors potentially influencing post-operative HR, including inotropic medications, gradual up-titration of beta-blockers and pain.
2.10. QT dispersion
QT interval represents the time for both ventricular depolarization and repolarization and therefore roughly estimates the duration of an average ventricular action potential.
8
The QT interval dispersion (QTd) reflects the inhomogeneities of electrical activity in the different segments of the left ventricle. A majority of studies have shown increased QT dispersion in various cardiac diseases. In the Rotterdam Study [DeBruyne et al., 1998] including 5 812 adults > 55 years old followed up 4 years, it was demonstrated that subjects with QTc (QTd corrected for heart rate) > 60 ms had a twofold risk for cardiac death or sudden death and a 40% increased mortality risk when compared to those subjects with a QTc dispersion < 30 ms. This finding was confirmed by another large study – the Caerphilly one, comprising 2512 patients, for whom it was proved that QTd is an independent predictor of cardiac death [Sheehan et al., 2004].
Simov et al., 2007 report of 63 patients with multivessel coronary artery disease underwent CABG as part of their therapeutic work-up. The authors conclude that successful coronary revascularization in ischemic heart disease patients leads to a significant improvement in markers of ventricular repolarization, expressed as a decrease in the dispersion of the QT interval. Simova et al., 2007 have studied 152 patients (64 of them with myocardial infarction (MI)). They report that MI patients have significantly lower flow mediated dilatation (FMD) and higher QTd compared to no-MI patients.
Bortolan et al., 2004 examined the QT dispersion in three groups of individuals: 256 healthy, 98 with only cardiac diseases, and 472 with hypertension only. The authors have found that the QT dispersion was influenced in the healthy group by gender (p < 0.001), in the cardiopathy group by age (p < 0.001) and in the hypertension group by both age (p < 0.02) and gender (p < 0.01).
In our study [Simov et al., 2015] the QT dispersion showed not significant differences (p = 0.06) comparing QTd-pre (19.3 ± 6.1) vs. QTd-post (16.5 ± 4.3). This challenges the results obtained by Simov et al., 2007, where a significant improvement in markers of ventricular repolarization, expressed as a decrease in the dispersion of the QT interval, was found after CABG. Possible reasons for this divergence could be the small representative group of 20 patients in the current case, or the accompanying subjectivism in manual measurement of QTd in Simov et al., 2007, or both.
2.11. Cardiac autonomic innervations
An opinion has been formed that the assessment of cardiac autonomic regulation may be an independent marker of success of the cardiac surgery [Airaksinen et al., 1987; Bellwon et al., 1996; Hugue et al., 1994].
Indicators of heart rate variability (HRV) are used to assess the state of the mechanisms regulating the physiological functions of the body, including: the total activity of the regulatory contours; the neuro-humoral cardiac regulation; and the autonomic balance – the ratio between the sympathetic and parasympathetic part of the autonomic nervous system (ANS). According to many authors, HRV is an integral indicator of the functional state of the cardiovascular system and the body as a whole [Bellwon et al., 1996; Bayevskiy et al., 2002;
Dao et al., 2010; Matveev et al., 2006].
Gospodinova et al., 2015 have compared the HRV in two groups: 16 healthy subjects and 16 patients with congestive heart failure (CHF). The difference between the two groups is well illustrated in Figs. 17-18 (where RR-interval is plotted against beat number), and Figs. 19-20 (Poincaré plots). Bonaduce, 1999 is evaluating the predictive value of HRV and
Fig. 179 RR interval series of healthy subject Fig. 189 RR interval series of CHF patients
Fig. 199Poincaré plots for RR series of healthy subject
Fig. 209Poincaré plots for RR series of CHF patient
Task Force of the European Society of Cardiology and the North American Society of Pacing and Electrophysiology published HRV standards of measurement, physiological interpretation, and clinical use [Task Force 1996]. Following this publication, a number of articles have been published to describe new HRV methodologies and their application in different physiological and clinical studies. A publication of Sassi et al., 2015 presents a critical review of the new methods. The authors state that: While the novel approaches have contributed in the technical understanding of the signal character of HRV, their success in developing new clinical tools, such as those for the identification of high-risk patients, has been rather limited. Available results obtained in selected populations of patients by specialized laboratories are nevertheless of interest but new prospective studies are needed. The investigation of new parameters, descriptive of the complex regulation mechanisms of heart rate, has to be encouraged because not all information in the HRV signal is captured by traditional methods. The new technologies thus could provide after proper validation, additional physiological, and clinical meaning. Multidisciplinary dialogue and specialized courses in the combination of clinical cardiology and complex signal processing methods seem warranted for further advances in studies of cardiac oscillations and in the understanding normal and abnormal cardiac control processes.
9
Matveev and coauthors are paying attention to HRV, neuro-humoral cardiac regulation; and autonomic balance this topic in a number of books, journal papers and conference materials. Some of them are: Time-related heart autonomic balance characteristics in healthy subjects [Matveev et al., 2003]; Normal and abnormal circadian characteristics in autonomic cardiac control: new opportunities for cardiac risk prevention [Matveev et al., 2006]; Diagnostic value of the RR-variability indicators for mild hypertension [Matveev and Prokopova, 2002]; Prognostic value of the time related autonomic balance indicator for risk evaluation of cardiovascular events in patients with ischemic heart disease [Matveev and Prokopova, 2008]; Heart autonomic balance changes in mildly hypertensive subjects. Method of assessment, characteristics, treatment [Prokopova and Matveev, 2004]; Correlating changes in heart autonomic balance and ventricular arrhythmias reflecting the positive effect of treating heart failure with carvedilol [Prokopova et al., 2005]; Profile of autonomic cardiac control in patients who are not considered ready for weaning from mechanical ventilation [Matveev et al., 2012]; Assessment of autonomic cardiac control in women with cardiac syndrome X using Time Related Autonomic Balance Indicator [Matveev et al., 2010a]; Non-parametric criterion for estimation of the sensitivity of object's features to influences of a factor and its application in clinical practice [Matveev, 2010b]; Decision support system for prediction of the weaning outcome from mechanical ventilation [Jekova et al., 2013].
Our previous study on the same database [Simov et al., 2014] demonstrates increased activity of sympatico-adrenal and pituitary-adrenal systems to provide a higher adaptability of the organism in the post CABG period. Estimates of the tone of regulatory systems and the autonomous balance as the modified by us Indicator of the Activity of Regulatory Systems (IARS) values for each patient before and in the early period after CABG (see Bayevskiy et al., 2002) are presented in Figs. 21 and 22.
+IARSpreop -IARSpreop +IARSpostop -IARSpostop
1 2 3 4 5 6 7 8 9 10 11 12 13 14
Patients -1 0 1 2 3 4 5 6 7 8 ± IA RS pre - & pos tope ra ti on IARSpreop IARSpostop
1 2 3 4 5 6 7 8 9 10 11 12 13 14
Patients 2.5 3.0 3.5 4.0 4.5 5.0 5.5 6.0 6.5 7.0 7.5 IA R S p re - & p o st o p e ra ti o n
Fig. 21 +IARS and –IARS pre- and postoperative
Fig. 22 IARS pre- and postoperative
2.12. ECG criteria for left ventrical hypertrophy
Left ventricular hypertrophy (LVH) is the thickening of the myocardium of the left ventricle of the heart. It occurs naturally as a reaction to aerobic exercise and strength training, and is most frequently referred to as a pathological reaction to cardiovascular disease, or high blood pressure. While LVH itself is not a disease, it is usually a marker for disease involving the heart [Meijs et al., 2007].
The Sokolow-Lyon index: [Sokolov and Lyon, 1949; Okin et al., 1998]
S in V1 + R in V5 or V6 (whichever is larger) ≥ 35 mm
R in aVL ≥ 11 mm
The Cornell voltage criteria [Casale et al., 1987] involve measurement of the sum of the R-wave in lead aVL and the S-wave in lead V3.
S in V3 + R in aVL > 28 mm (men)
S in V3 + R in aVL > 20 mm (women)
The Romhilt-Estes point score system [Romhilt and Estes, 1968]. Points are summed if any of the down-listed criteria is fulfilled. Total of > 5 points means LVH "diagnostic", total = 4 points is for "probable" and total < 4 points is for no LVH).
ECG Criteria Points
Voltage Criteria (any of):
1. R or S in limb leads ≥ 20 mm
2. S in V1 or V2≥ 30 mm
3. R in V5 or V6≥ 30 mm
3
ST-T Abnormalities:
ST-T vector opposite to QRS without digitalis
ST-T vector opposite to QRS with digitalis
3 1
Negative terminal P mode in V1 1 mm in depth and 0.04 sec
in duration (indicates left atrial enlargement) 3
Left axis deviation (QRS of -30° or more) 2
QRS duration ≥ 0.09 sec 1
Delayed intrinsicoid deflection in V5 or V6 (> 0.05 sec) 1
Other voltage-based criteria for LVH include:
Lead I: R-wave > 14 mm
Lead aVR: S-wave > 15 mm
Lead aVL: R-wave > 12 mm
Lead aVF: R-wave > 21 mm
Lead V5: R-wave > 26 mm
Lead V6: R-wave > 20 mm.
3. Discussion
CABG-induced ECG changes obtained in Simov et al., 2014 and Simov et al., 2015 were analysed on the basis of the conclusions of the review whether the change of parameters lead to deterioration or improvement of the patient's condition. QRS amplitude, T amplitude, ST-segment deviation and QRS alternans showed non-significant changes. Two parameters
showed an improvement in the patients’ condition after CABG: QRS-T angle
The analysis of pre-surgery and post-surgery QRS amplitudes shows a good dehydration in course of time. The median difference between post- and pre-surgery QRS amplitude is predominantly negative at the 3rd and 4th days and increase to positive at the 7th day after CABG. It means that in the first postoperative days the fluid balance of a patient is positive with a gradual shift towards neutral values during later hospital stay.
The current broad review allows concluding that two important parameters for evaluation of the CABG impact were not measured in Simov et al., 2014 and Simov et al., 2015: heart rate variation and QRS duration.
4. Conclussion
Electrocardiographic changes in certain cardiovascular physiological and pathologies settings (aging, diagnostic tests for Brugada syndrome, diagnostic stress test, cardiac surgery, hemodialysis, diabetes, heart failure,etc) were reviewed. Alterations of ECG parameters (QRS amplitude, T-wave amplitude, T-wave morphology, QRS duration, QRS alternans, T-wave alternans, negative T-waves, 3D-space angle between maximal QRS and T vectors of the vectorcardiographic loops, ST-segment changes, QT-interval dispersion, cardiac autonomic innervation) were discussed in connection to their diagnostic information to risk of arrhythmias, incidental heart failure and sudden cardiac death. Emphasised in the discussion
is the effect of coronary atrial bypass grafting on the ECG parameters’ change.
Acknowledgments
This review is supported by the joint research project 2016-2018 between the Institute of Biophysics and Biomedical Engineering – Bulgarian Academy of Sciences and Institute of Neuroscience – CNR. The review is also supported by the Bulgarian Scientific Research Fund, grant T02/11.
References
1. Aeschbacher S, Metin F, Bossard M, et al. Relationships of electrocardiographic parameters with ambulatory hypertension in young and healthy adults. Int. J. Cardiol. 2016;202:300-4.
2. Airaksinen K, Juhani E, Markku J. Heart rate after coronary artery bypass grafting. Am. J. Cardiol. 1987;60:1395-7.
3. Astan R, Akpinar I, Karan A, Kacmaz F, Sokmen E, Baysal E, Ozeke O, and Selçuk MT. The effect of hemodialysis on electrocardiographic parameters. Ann Noninv Electrocardiol, 2015;20:253-7.
4. Bacharova L, Baum OV, Muromtseva GA, et al. The relation between QRS amplitude and left ventricular mass in patients with hypertension identified at screening. Anatol J Cardiol, 2007;S1:153-8.
5. Batchvarov V, Christov I, Bortolan G, Behr E. Principal component analysis of the QRS complex during diagnostic ajmaline test for suspected Brugada syndrome. Comp Cardiol. 2010;37:501-4.
6. Batchvarov VN, Christov II, Bortolan G, Govindan M, Behr ER. Automatic assessment of right ventricular repolarisation heterogeneity during diagnostic ajmaline test for suspected Brugada syndrome. Comput Cardiol. 2009;36:297-300.
7. Batchvarov VN, Bortolan G, Christov II. Effect of heart rate and body position on the complexity of the QRS and T wave in healthy subjects. Comp Cardiol. 2008;35:225-8. 8. Batchvarov VN, Christov II, Bortolan G et al. Post-extrasystolic changes of the
9. Batchvarov V, Behr, E, Hnatkova K, Malik M. Irregular ST-T Wave alternans with QT prolongation during ajmaline test for suspected Brugada syndrome. Heart Rhythm. 2005;5:S50 (abstract).
10. Bayevskiy R, Ivanov G, Chireikin L et al. Analysis of HRV with the use of various ECG systems. 2002, http://vestar.ru/article_print.jsp?id=1267.
11. Bellwon J, Siebert J, Rodowski J. Heart rate power analysis in patient before and 6 weeks after coronary artery bypass grafting. J. Clin. Sci (Colch). 1996;91Suppl.:19-21. 12. Berman JL, Wynne J, Cohn PF. Multiple-lead QRS changes with exercise testing.
Diagnostic value and hemodynamic implications Circ. 1980;61:53-61.
13. Bloomfield DM, Steinman RC, Namerow PB, et al. Microvolt T-wave alternans distinguishes between patients likely and patients not likely to benefit from implanted cardiac defibrillator therapy. A solution to the multicenter automatic defibrillator implantation trial (MADIT) II conundrum. Circ. 2004;110:1885-9.
14. Bonaduce D. Independent and incremental prognostic value of heart rate variability in patients with chronic heart failure. Am Heart J. 1999;138:273-84.
15. Bortolan G, Christov I. Noise processing in exercise ECG stress test for the analysis and the clinical characterization of QRS and T wave alternans. Biomed Sign Proc & Control 2015;18:378-85.
16. Bortolan G, Christov I. T-wave alternans detection by a combined method of principal component analysis and T-wave amplitude. Phys Meas. 2012;33:333-43.
17. Bortolan G, Christov I, Simova I, Dimitrov N. Clinical characterization of the QRS complex and T wave heterogeneity during stress test ECG. Proceedings of Europ Med Phys and Eng Conf. Sofia, 18-20 October, 2012:76-84.
18. Bortolan G, Bressan M, Christov I. Review on the diagnostic potentials of the T-loop morphology in VCG. Int J Bioautomation. 2009;13(4):55-71.
19. Bortolan G, Christov II, Batchvarov VN, Behr ER. QRS&T wave alternans and beat-to-beat ventricular repolarization variability assessed from 12-lead Holters in patients with suspected Brugada syndrome. Comp Cardiol. 2009;36:305-8.
20. Bortolan G, Bressan M, Golferini F. QT dispersion in the elderly. The ILSA study. Aging Clin Experim Res. 2004;16(5):342-8.
21. Bortolan G, Bressan M, Christov I. Gender and age influences in T-Loop morphology. Comp Card. 2003;30:513-6.
22. Bortolan G, Bressan M, Christov I. Longitudinal modifications of the T-loop morphology. Comp Card. 2002;29:685-8.
23. Bortolan G, Christov I. Myocardial infarction and ischemia characterization from T-loop morphology in VCG. Comp Card. 2001;28: 633-6.
24. Breslow MJ, Miller CF, Parker CD, et al. Changes in T-wave morphology following anesthesia and surgery: a common recovery-room phenomenon. Anastesiology. 1986;64(3):398-402.
25. Battler A, Froelicher V, Slutsky R, Ashburn W. Relationship of QRS amplitude changes during exercise to left ventricular function and volumes and the diagnosis of coronary artery disease. Circ. 1979;60:1004-13.
26. Casale PN, Devereux RB, Alonso DR, Campo E, Kligfield P. Improved sex-specific criteria of left ventricular hypertrophy for clinical and computer interpretation of electrocardiograms: validation with autopsy findings. Circul. 1987;75(3):565-72.
27. Christov I, Simov D, Dotsinsky I, Simova I. Increase of electrical impedance following hemodialysis is not the reason for QRS augmentation. Ann Noninv Electrocardiol, 2016;21(2):214.
29. Christov I, Bortolan G, Simova I, Katova T. T wave and QRS complex alternans during stress ECG testing according to the presence or absence of diabetes mellitus. J Endocrin Metabolism 2012;2(1):32-8.
30. Christov I, Bortolan G, Simova I, Katova T. Influence of diabetes mellitus on T wave and QRS complex alternans during stress ECG testing. Comp Cardiol 2011;38:49-52. 31. Christov I, Bortolan G, Simova I, Katova T. T wave and QRS complex alternans during
standard diagnostic stress ECG test. Comp Cardiol. 2010;37:1039-42.
32. Christov I, Simova I. Q-onset and T-end delineation: Assessment of the performance of an automated method with the use of a reference database. Physiol Meas. 2007; 28:213-21.
33. Christov I. Assessment of the performance of the adaptive thresholding algorithm for QRS detection with the use of AHA database. Int J Bioautomation. 2007;6:27-37. 34. Christov II, Simova II Fully Automated Method for QT Interval Measurement in ECG,
IEEE Comp Card. 2006;33:321-4.
35. Christov I, Daskalov IK. Filtering of electromyogram artifacts from the electrocardiogram. Med. Eng. & Phys. 1999;21:731-6.
36. Coustet B, Lhuissier FJ, Vincent R, Richalet J-P. Electrocardiographic changes during exercise in acute hypoxia and susceptibility to severe high-altitude illnesses. Circul. 2015;131:786-94.
37. Dao T, Youssev R Gopaldas R et al. Autonomic cardiovascular dysregulation as a potential mechanism under-lying depression and coronary artery bypass grafting surgery outcomes. J. Cardiothorac. Surg. 2010;13;36.
38. Das MK, El Masry H. Fragmented QRS and other depolarization abnormalities as a predictor of mor tality and sudden cardiac death. Curr Opin Cardiol 2010;25(1):59-64. 39. Daskalov IK, Dotsinsky IA, Christov II. Developments in ECG acquisition
preprocessing parameter measurement and recording. IEEE Eng. in Med. & Biol. 1998;17:50-8.
40. DeBruyne MC, Hoes AW, Kors JA, et al. QTc dispersion predicts cardiac mortality in the elderly: the Rotterdam Study. Circulation 1998;97(5):467-472.
41. Fox K, Ford I, Steg G. Heart rate as a prognostic risk factor in patients with coronary artery disease and left-ventricular systolic dysfunction (BEAUTIFUL): a subgroup analysis of a randomised controlled trial. Lancet 2008;372;817-21.
42. Gospodinova E, Gospodinov M, Dey N, Domuschiev I, Ashour A, Sifaki-Pistolla D. Analysis of heart rate variability by applying nonlinear methods with different approaches for graphical representation of results. Int J Advanced Comp Sci and Applic. 2015;6(8):38-45.
43. Hogue CW, Stein PK, Apostolidou I, et al. Alterations in temporal patterns of heart rate variability after coronary artery bypass graft surgery. Anesthesiology, 1994;81:1356-64. 44. Iellamo F, Pigozzi F, Spataro A, Lucini D, Pagani M. T-wave and heart rate variability changes to assess training in world-class athletes. Med Sci Sports Exerc. 2004; 36:1342-6.
45. Ikeda T, Sakurada H, Sakabe K, Sakata T, Takami M, Tezuka N, Nakae T, Noro M, Enjoji Y, Tejima T, Sugi K, Yamaguchi T. Assessment of noninvasive markers in identifying patients at risk in the Brugada syndrome: Insight into risk stratification. J Am Coll Cardiol 2001; 37:1628-34.
46. Iuliano S, Fisher S,Karasik P, et al. QRS duration and mortality in patients with congestive heart failure. Am Heart J. 2002;143(6):1085-91.
48. Kannel WB, Kannel C, Paffenbarger RS, Cupples LA. Heart rate and cardiovascular mortality: the Framingham Study. Am Heart J. 1987;113(6):1489-94.
49. Karabacak K, Celik M, Gokoglan Y, et al. Frontal planar QRS/T angle can be a prognostic factor in the early postoperative period of patients undergoing coronary bypass surgery. Heart Surg Forum. 2014;17(6):E288-92.
50. Kardys I, Kors JA, van der Meer IM, et al. Spatial QRS-T angle predicts cardiac death in a general population. Eur Heart J. 2003;24(14):1357-64.
51. Kashani A, Barold S. Significance of QRS complex duration in patients with heart failure. J Am Coll Cardiol. 2005;46(12):2183-92.
52. Kaya E, Karabacak K, Kadan M, et al. Preoperative frontal QRS-T angle is an independent correlate of hospital length of stay and predictor of haemodynamic support requirement following off-pump coronary artery bypass graft surgery. Interact Cardiovasc Thor Surg 2015:1-6, http://icvts.oxfordjournals.org/content/early/ 2015/04/29/icvts.ivv084.short?rss=1.
53. Khoueiry G, Abdallah M, Shariff M, Kowalski M, Lafferty J. Microvolt T-wave alternans in patients undergoing elective coronary artery bypass grafting: a pilot study. Heart, Lung and Vess 2014;6:3-10.
54. Kirchhof P, Eckardt L, Rolf S, Esperer HD, Paul M, Wichter T, Klein HU, Breithardt G,
Böcker D. T wave alternans does not assess arrhythmic risk in patients with Brugada
syndrome. Ann Noninvas Electrocardiol 2004; 9:162-5.
55. Levkov Ch, Mihov G, Ivanov R, Daskalov I, Christov I, Dotsinsky I. Removal of power-line interference from the ECG: A review of the subtraction procedure. Biomed. Eng. Online 2005;4(50), http://www.biomedical-engineering-online.com/content/ 4/1/50.
56. Lambiase PD, Ahmed AK, Ciaccio EJ, Brugada R, Lizotte E, Chaubey S, Ben-Simon R, Chow AW, Lowe MD, McKenna WJ. High-density substrate mapping in Brugada syndrome. Combined role of conduction and repolarization heterogeneities in arrhythmogenesis. Circ. 2009;120:106-17.
57. Loeb H, Gunnar W, Thomas D. Is new ST-segment elevation after coronary artery bypass of clinical importance in the absence of perioperative myocardial infarction? J Electrocardiol. 2007;40(3):276-81.
58. Madias JE, Narayan V. Augmentation of the amplitude of electrocardiographic QRS complexes immediately after hemodialysis: a study of 26 hemodialysis sessions of a single patient, aided by measurements of resistance, reactance, and impedance. J Electrocard. 2003:36;263-71.
59. Matveev M, Krasteva V, Jekova I et al. Profile of autonomic cardiac control in patients who are not considered ready for weaning from mechanical ventilation. Comp Card. 2012;39:625-8.
60. Matveev M, Tsonev SN, Prokopova R. Donova T. Assessment of autonomic cardiac control in women with cardiac syndrome X using Time Related Autonomic Balance Indicator. Comp Card. 2010;37:1047-50.
61. Matveev M. Non-parametric criterion for estimation of the sensitivity of object's features to influences of a factor and its application in clinical practice. Proceed 32nd Int. Conf. on Inform Techn Interfaces, 21-24 June, Cavtat, Croatia, 2010:569-72.
62. Matveev M, Prokopova R. Prognostic value of the time related autonomic balance indicator for risk evaluation of cardiovascular events in patients with ischemic heart disease. Comp Card. 2008;35:201-4.
64. Matveev M, Prokopova R. Diagnostic value of the RR-variability indicators for mild hypertension. Physiol Meas. 2002;23:671-82.
65. Matveev M, Prokopova R, Nachev Ch. Time-related heart autonomic balance characteristics in healthy subjects. Physiol Meas. 2003;24:727.
66. McIntyre C, Burton J, Selby N, Leccisotti L, Korsheed S, Baker C, Camici P. Hemodialysis-induced cardiac dysfunction is associated with an acute reduction in global and segmental myocardial blood flow. Clin J Amer Soc Nephr. 2007:3;19-26. 67. Meijs MF, Bots ML, Vonken EJ, et al. Rationale and design of the SMART Heart
study: A prediction model for left ventricular hypertrophy in hypertension. Neth Heart J. 2007;15(9): 295-8.
68. Michaelides AP et al. New coronary artery disease index based on exercise-induced QRS changes. Am Heart J. 1990;120:292-302.
69. Migliore F, Zorzi A, Michieli P et al. revalence of Cardiomyopathy in Italian Asymptomatic Children With Electrocardiographic T-Wave Inversion at Preparticipation Screening. Circ. 2012;125:529-38.
70. Morady F. Significance of QRS alternans during narrow QRS tachycardias. Pacing Clin Electrophysiol. 1991;14:2193-8.
71. Morin JF, Mistry B, Langlois Y, et al. Fluid overload after coronary artery bypass grafting surgery increases the incidence of post-operative complications. World J. of Cardiovasc. Surg. 2011;1(2): 18-23.
72. Nakamura S, Uzu T, Inenaga T, Kimura G. Prediction of coronary artery disease and cardiac events using electrocardiographic changes during hemodialysis. Am J Kidney Dis. 2000;36(3):592-9.
73. Ojanen S, Koobi T, Korhonen P, Mustonen J, Pasternack A. QRS amplitude and volume changes during hemodialysis. Am J Nephrol. 1999;19(3):423-7.
74. Okin PM, Roman MJ, Devereux RB, et al. Time-voltage QRS area of the 12-lead electrocardiogram. Detection of left ventricular hypertrophy. Hypertens. 1998; 31:973-42.
75. Pilhall M, Riha M, Jern S. Exercise-induced QRS changes in healthy men and women: a multivariate analysis on their relation to background data and exercise performance. Eur Heart J. 1992;13:1316-24.
76. Pradeep A, Rajagopalam S, Kolli HK, et al. High volumes of intravenous fluid during cardiac surgery are associated with increased mortality. HSR Proc. Intensive Care Cardiovasc. Anesth., 2010;2(4): 287-96.
77. Prokopova R, Matveev M, Nachev CH. Correlating changes in heart autonomic balance and ventricular arrhythmias reflecting the positive effect of treating heart failure with carvedilol. Eur J Heart. 2005;152:37-8.
78. Prokopova R, Matveev M. Heart autonomic balance changes in mildly hypertensive subjects. Method of assessment, characteristics, treatment. J Hyperten. 2004;22:2. 79. Romhilt DW, Estes EH. A point-score system for the ECG diagnosis of left ventricular
hypertrophy. Am. Heart J. 1968;75(6):752-8.
80. Saltykova M et al. Increased QRS voltage during dehydrating. Terapevticheskii arkhiv. 2006;794):18-23.
81. Saravanan S, Davidson N. Advances in arrhythmia and electrophysiology. Risk assessment for sudden cardiac death in dialysis patients. Circul: Arrhyth and Electrophys. 2010;3:553-9.
Society. Europace. 2015, http://europace.oxfordjournals.org/content/early/2015/07/14/ europace.euv015.full.
83. Sheehan J, Perry IJ, Reilly M, et al. QT dispersion, QT maximum and risk of cardiac death in the Caerphilly Heart Study. Eur J Cardiovasc Prev Rehabil. 2004;11(1):63-8. 84. Simov D, Milanova M, Matveev M, et al. Cardiac autonomic innervation following
aorto-coronary bypass evaluated by high resolution heart rate variability. Comp Card. 2014;41:1013-16.
85. Simov M, Christov I, Bortoan G, et al. Changes in the electrocardiogram induced by coronary artery bypass grafting. Comput Cardiol. 2015;42:1129-32.
86. Simov D, Simova I, Danov V, Christov I (2007) Effect of coronary artery bypass grafting on QT interval dispersion. The Internet Journal of Thoracic and Cardiovascular Surgery, 10 (1), https://ispub.com/IJTCVS/10/1/9964.
87. Simova I, Christov I, Bortolan G, Abächerli R, Kambova L. Jekova I. Hemodialysis
-induced ST-segment deviation. Comp. Card. 2015;42:1133-6.
88. Simova I, Bortoan G, Kambova L, Christov I, Katova T. Episodes of T-wave and QRS complex alternans in haemodialysis patients. EC Cardiol. 2015;2(1):60-7,
https://www.ecronicon.com/eccy/pdf/ECCY-02-00008.pdf.
89. Simova I,Christov I, Bortolan G. A review on electrocardiographic changes in diabetic patients. Curr Diab Rev 2015;11:102-6.
90. Simova I, Christov I, Kambova L, et al. QRS and T loops area changes during haemodialysis. Comput Cardiol. 2014;41:409-12.
91. Simova I, Christov I. Sources of variation in the QT readings: what should you be aware of? Int J Bioautomation, 2007;6:78-91.
92. Simova II, Denchev SV, Christov II, Matveev MG. Comparison of flow mediated dilatation and QT interval dispersion as noninvasive methods for evaluation of coronary artery disease. The Online Journal of Cardiology, Medical Teaching, McGill CME Cardiology. 2007 http://cme.med.mcgill.ca/php/hom.php?id=722.
93. Singh N., Langer A., et al. Myocardial alterations during hemodialysis: insights from new noninvasive technology. Am J Nephrol 1994;14:173-81.
94. Singla V, Jindal A, Pargaonkar V et al. Examining QRS amplitude criteria for electrocardiographic left ventricular hypertrophy in recommendations for screening criteria in athletes. J Elactrocardiol. 2015;48:368-372.
95. Sokolow M, Lyon TP. The ventricular complex in left ventricular hypertrophy as obtained by unipolar precordial and limb leads. Am Heart J. 1949;37:161-186.
96. Surawicz B, Childers R, Deal B., et al. Expert consensus document. AHA/ACCF/HRS recommendations for the standardization and interpretation of the electrocardiogram. Part III: Intraventricular Conduction Disturbances. J Am Coll Cardiol. 2009;53(11): 976-81.
97. Tada T, Kusano KF, Nagase S, Banba K, Miura D, Nishii N, Watanabe A, Nakamura K, Morita H, Ohe T. Clinical Significance of macroscopic T-wave alternans after sodium channel blocker administration in patients with Brugada syndrome. J Cardiovasc Electrophysiol 2008;19:56-61.
98. Takagi M, Doi A, Takeuchi K, Yoshikawa J. Pilsicanideinduced marked T wave alternans and ventricular fibrillation in a patient with Brugada syndrome. J Cardiovasc Electrophysiol 2002;13:837-8.
100. Task Force of the European Society of Cardiology and the North American Society of Pacing and Electrophysiology. Heart rate variability standards of measurement, physiological interpretation, and clinical use. Circul. 1996;93:1043-65.
101. Walder L, Spodick D. Global T wave inversion. J Am Coll Cardiol. 1991;17:1479-85. 102. Zabel M, Acar B, Klingenheben T, et al. Analysis of 12-lead T-wave morphology for
risk stratification after myocardial infarction. Circ. 2000;102(11):1252-7.
Dimitar Simov, MD, Ph.D. Student
E-mail: [email protected]