to Ankylosing Spondylitis in Chinese Han Patients: A
Case-Control Study
Wei Chai
1☯, Zijian Lian
2☯, Chao Chen
2, Jingyi Liu
3, Lewis L. Shi
4, Yan Wang
1,3*1 Department of Orthopaedics, Chinese People’s Liberation Army General Hospital, Beijing, China, 2 Department of Orthopaedics, Tianjin Hospital, Tianjin, China, 3 Medical School of Nankai University, Tianjin, China, 4 Department of Orthopaedics, University of Chicago Hospital, Chicago, Illinois, United States of America
Abstract
Susceptibility to ankylosing spondylitis (AS) is largely genetically determined. JARID1A, JMY and PTGER4 have recently been found to be associated with AS in patients of western European descent. We aim to examine the influence of JARID1A, JMY, and PTGER4 polymorphisms on the susceptibility to and the severity of ankylosing spondylitis in Chinese ethnic majority Han population. This work can lead the clinical doctors to intervene earlier. Blood samples were drawn from 396 AS patients and 404 unrelated healthy controls. Both the AS patients and the controls are Han Chinese. The AS patients are classified based on the severity of the disease. Thirteen tag single nucleotide polymorphisms (tagSNPs) in JARID1A, JMY and PTGER4 are selected and genotyped. Frequencies of different genotypes and alleles are analyzed among the different severity AS patients and the controls. The rs2284336 SNP in JARID1A, the rs16876619 and rs16876657 SNPs in JMY are associated with susceptibility of AS. The rs11062357 SNP in JARID1A, the rs2607142 SNP in JMY and rs10440635 in PTGER4 are related to severity of AS. Haplotype analyses indicate PTGER4 is related to susceptibility to AS; JARID1A and JMY are related to severity of AS.
Citation: Chai W, Lian Z, Chen C, Liu J, Shi LL, et al. (2013) JARID1A, JMY, and PTGER4 Polymorphisms Are Related to Ankylosing Spondylitis in Chinese Han Patients: A Case-Control Study. PLoS ONE 8(9): e74794. doi:10.1371/journal.pone.0074794
Editor: Graham R. Wallace, University of Birmingham, United Kingdom
Received February 27, 2013; Accepted August 7, 2013; Published September 19, 2013
Copyright: © 2013 Chai et al. This is an open-access article distributed under the terms of the Creative Commons Attribution License, which permits unrestricted use, distribution, and reproduction in any medium, provided the original author and source are credited.
Funding: This work was supported by the Natural Science Foundation of Beijing (7102146). The funders had no role in study design, data collection and analysis, decision to publish, or preparation of the manuscript.
Competing interests: The authors have declared that no competing interests exist. * E-mail: [email protected]
☯ These authors contributed equally to this work.
Introduction
Ankylosing spondylitis (AS) is a chronic inflammatory disease characterized by inflammation in the sacroiliac joints and spine which causes joint and bone erosion and even ankylosis [1]. Most AS patients develop first symptoms before they are 30 years old [2]. Radiographic progression during the first 10 years of disease is an important prognostic indicator of disease severity; some recent studies suggest early presentation of structural damage can be considered as a good predictor of further damage [3-5].
The severity of AS is largely genetically determined. Most genetic studies focus on disease susceptibility; however, the published literature lacks candidate gene association studies for disease severity of AS [6]. The goal of this study is to examine several previously identified gene polymorphisms, and their influence on susceptibility to AS and severity of disease,
all with the intention of earlier intervention leading to better outcome.
The genes studied in the present report include JARID1A,
JMY, and PTGER4. JARID1A (jumonji, AT-rich interactive
domain 1A) is also known as KDM5A (lysine-specific
demethylase 5A) and RBP2 (retinoblastoma-binding protein 2)
[7]. JARID1A encodes the JARID1A protein and regulates gene
JMY encodes for JMY (junction-mediating and regulatory protein), This protein is a transcription co-factor. It was originally identified as a p300-binding protein, and it can
augments the p53 tumor suppressor response [12]. PTGER4
encodes EP4R (prostaglandin E receptor 4) which is the antagonism to inhibit cell growth, proliferation, and metastasis of breast cancer cells; in particular, PTGER4 regulates the aggressive phenotypes of inflammatory breast cancer cells
[13]. Thus, higher level of PTGER4 and EP4R may lead tumor
cell to proliferate. A recent study supports the hypothesis that PTGER4 receptor antagonists may be an alternative approach to prevent tumor metastasis [14].
In genome-wide association studies, rs11062385 in
JARID1A, rs16876657 in JMY, and rs10440635 in PTGER4
are related to AS susceptibility in patients of western European descent [15-17]. We hypothesize that the relationship between
JARID1A, JMY, PTGER4 and AS exists in other populations;
additionally, particular single nucleotide polymorphisms (SNPs) of these genes may predict the severity of AS. This is a replication study, Chinese Han population is more than one billion. It is reasonable to support the western results using
Chinese Han population. In this study, we examined JARID1A,
JMY, and PTGER4 genes in patients of the Chinese ethnic majority Han population.
Methods
1: Study population
In this study, 396 AS patients and 404 unrelated healthy controls who are age and sex-matched are recruited. All AS patients and normal controls are Han Chinese. The Han ethnic group makes up 92% of the population in China and 20% of the global population, making it the largest ethnic group in the world. These samples are collected from PLA general hospital from 2010 to 2013. All AS patients are HLA-B27 positive and they are treated by non-steroidal anti-inflammatory drug routinely; no other treatments are used for patients. In the patient group, 354 male (89.4%) and 42 female (10.6%) are recruited; the average age is 29.6 years (range 16 to 60 years) (Table 1). In the control group, 370 male (91.6%) and 34 female (8.4%) are recruited; the average age is 30.0 years (range 16 to 60 years). Neither sex nor age distributions show significant differences between AS patients and control (p=0.291, 0.670 respectively). The average duration since AS diagnosis is 11.5 years (range 8 to 18 years). The diagnosis of AS has been made by experienced rheumatologists according to the modified New York criteria [18]. The diagnosis was reconfirmed by different rheumatologists. The diagnosis was made before the genetic information was genotyped. In another word, the phenotype was recorded by the rheumatologists blinded to the genetic information. Subjects with inflammatory bowel disease, psoriasis, rheumatoid arthritis, or other autoimmune diseases are excluded from both the AS and the control group.
2: Basic data acquisition
The Bath AS function index (BASFI) and Bath AS disease activity index (BASDAI) are administered to the patients using
questionnaires; these indexes are the most widely used tools for the assessment of AS functional status and activity [19,20]. The modified Stokes AS Spine Score (mSASSS) is a validated scoring system for spinal structural changes [21]. The lateral views of standard radiographs of the cervical and lumbar spine are used to derive a mSASSS score for each patient [22,23]. Three of the authors separately assigned the mSASSS scores, and we used the average.
3: Severity classification
How to classify AS severity is still a field of discussion[24]. . In this study, we define severe type of AS as the disease form in those patients within first ten years of diagnosis who satisfied the indications of surgery, which include inability to stand upright, inability to look straight ahead, or compression of the viscera due to kyphosis that manifests as pain [25]. Patients with the normal type of AS exhibit inflammation of sacroiliac joints, but their spine and other joints were relatively spared; these patients have required only medical treatment. By this definition, 82 AS patients were the severe type, and 314 AS patients were the normal type (Table 2).
Table 1. Demographic data of AS patients and controls.
Cases (396) Controls (404) p-value
Sex male 354 (89.4%) 370 (91.6%) 0.291 female 42 (10.6%) 34 (8.4%)
Age 29.6±8.5 30.0±9.4 0.670
Duration of diagnosis 11.5±2.1 N/A
BASFI 3.94±1.45 N/A
BASDAI 5.60±1.25 N/A
mSASSS 13.7±15.0 N/A
There is no significant difference in age and sex-distribution between AS patients and controls. Numerical values presented as mean±standard deviation. BASFI : Bath ankylosing spondylitis function index. BASDAI: Bath ankylosing spondylitis disease activity index. mSASSS: modified Stokes ankylosing spondylitis Spine Score.
doi: 10.1371/journal.pone.0074794.t001
Table 2. Clinical features comparing severe AS and normal AS.
severe AS (82) normal AS (314) p value
Sex male 76 (92.7%) 276 (87.9%) 0.220 female 6 (7.3%) 38 (12.1%)
Age 31.5±9.2 29.0±8.3 0.097
Duration of diagnosis 11.2±3.0 11.6±1.8 0.290
BASFI 6.07±2.00 3.38±0.37 <0.001
BASDAI 6.28±1.34 5.42±1.16 <0.001
mSASSS 36.4±20.7 7.71±1.86 <0.001
There is no difference between severe AS patients and normal patients in age and sex distribution; however, the BASFI, BASDAI and mSASSS are higher in severe AS patients.
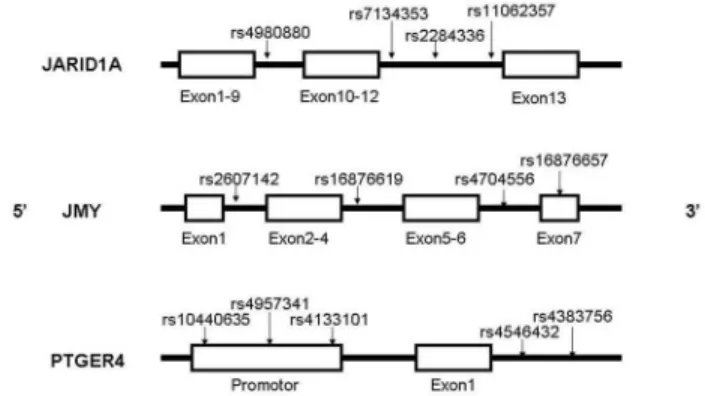
4: SNPs selection
The SNPs in this study included four in JARID1A, four in
JMY and five in PTGER4. JARID1A is on chromosome 12, and
JMY and PTGER4 are both on chromosome 5. These SNPs
are selected to serve as multi-marker tagging algorithm with criteria of r2 more than 0.8 and for all SNPs with minor allele
frequency more than 20%; population is set as CHB (Chinese Han Beijing). We use the data download from hapmap to select the tagSNPs randomly. Haploview 4.2 software (Broad Institute, Cambridge, Massachusetts, USA) is used to in this procedure. Figure 1 shows the positions of each tagSNP.
5: DNA extraction and genotyping analysis
We use AxyPrep Blood Genomic DNA Miniprep kit (Axygen Biosciences, Union City, CA, USA) to isolate DNA from 2ml whole blood samples. We employ the chip-based matrix-assisted laser desorption ionization time-of-flight (MALDI-TOF) mass spectrometry technology to detect SNPs [26]. MassARRAY system is used in this procedure (Sequenom, San Diego, CA, USA). All SNPs in the control groups are
successfully genotyped; rs7134353 and rs2284336 in JARID1A
and rs10440635 in PTGER4 in AS groups are 100%
genotyped. The other SNPs are genotyped in 394 of 396 patients.
6: Statistical analysis
The Hardy-Weinberg equilibrium is tested for all 13 tagSNPs. We use chi-squared test and independent-samples t-test to compare the differences in age and gender between cases and controls. Comparisons of the distributions of the genotype, allele and haplotype frequencies are carried out using the chi-squared test. The relative risks are estimated as an odds ratio (OR) with a 95% confidence interval (CI). The p-values, OR, and 95% CI indicate in the text are used to estimate the significance of the contribution of corresponding genotype to disease risk. The p-values of genotypes indicate in the result tables are used to estimate the significance of the distribution of genotype between cases and controls. Different subgroups in cases are compared to controls separately. Bonferroni correction is needed. Due to the number of SNPs selected in each gene, p-value less than 0.01 is considered statistically significant after Bonferroni correction. The last genotype of each SNP is the major genotype and the last allele is the major allele. They are the reference groups. All three genotypes of each SNP are compared, p-value for individual genotypes are shown only if significant at 0.05 level (Table 3, details are shown in Table S1, Table S2 and Table S3). We compared the severe AS group to the entirety of the control group and then normal AS group to the entirety control group. Pearson’s chi-squared test is used to compare the constructed haplotypes. The SNPs which show significant differences between AS patients and controls are considered to be related to susceptibility to AS. The SNPs which p-value are less than 0.01 both in severe AS groups and normal AS groups are considered related to severity of AS. Statistical analyses are carried out with SPSS v.17.0 software package (IBM, Armonk, New York, USA). All three genotypes of each SNP are compared, and p-values are shown in the first line of each
SNP. Additionally we compared the first two genotypes with the third one, showing the p-values if only they are significant (p<0.05) (Tables 3, S1, S2 and S3). We compare the severe AS group to the entirety of the control group and then normal AS group to the entirety of the control group.
7: Ethics statement
The blood samples of both AS patients and controls used in this study are part of samples taken for diagnostic tests. During the collection and use of DNA samples, clinical data guidelines, regulations of the local Ethics Committee and the Helsinki Declaration in 1975 are followed. Written informed consents were obtained from all the patients and subjects (or their parents in the case of two patients less than 18 years old). The study procedure is approved by our Institutional Review Board. The full name of the IRB is ethics committee of Chinese PLA general hospital.
Results
1: Clinical features
Among the 396 AS patients, the mean BASFI is 3.94±1.45 (mean±standard deviation). The mean BASDAI is 5.60±1.25. The mean mSASSS is 13.7±15.0. When comparing the severe AS to the normal AS patient groups, there is no significant difference in sex (p=0.220), age (p=0.097), and duration since diagnosis (p= 0.290) (Table 2). The BASFI is higher in severe AS group (6.07±2.00) than normal AS group (3.38±0.37) (p-value<0.001), reflecting poorer function of patients in the severe AS group. The BASDAI is similarly higher in the severe AS group (6.28±1.34) than normal AS group (5.42±1.16) (p-value<0.001), reflecting higher disease activity. The pattern holds for mSASSS (36.4±20.7 versus 7.71±1.86, p-value<0.001), signifying more radiographic changes in the severe AS patients.
Figure 1. Positions of each selected tagSNP on the genes. The SNP rs16876657 is in the exon 7 of JMY, the SNP rs10440635, rs4957341, rs4133101 are in the promoter of
PTGER4, other SNPs are all in introns.
2: Genotype and allele
The statistically significant SNPs of these three genes related to susceptibility to AS and severity of AS are summarized in Table 3. The details of genotype and allele
distributions for JARID1A, JMY and PTGER4 are summarized
in Table S1, Table S2 and Table S3 respectively. The genotype frequencies of these 13 tagSNPs are in Hardy-Weinberg
equilibrium case groups and control groups. SNPs in JARID1A
are compared between all AS patients, severe AS patients, and
Table 3. Positive SNPs in JARID1A JMY and PTGER4 which are related to susceptibility to AS or severity of AS comparing all AS patients, severe AS patients and normal AS patients to the controls.
SNP All AS subjects cases / controls
Severe AS subjects cases / controls
Normal AS subjects cases / controls
frequenciesOR(95% CI)c p frequenciesOR(95% CI) p frequenciesOR(95% CI) p
JARID1A rs2284336 Alla 0.001* 1.153E-6* 0.028#
Genotype TT 48/44 0.805(0.503~1.294) 4/44 0.243(0.083~0.718) 44/44 1.009(0.617~1.652) CT 180/236 0.559(0.413~0.757) 1.858E-4* 28/236 0.302(0.180~0.505) 1.217E-6* 152/236 0.663(0.478~0.918) 0.018#
CC 168/124 1b 50/124 1 118/124 1
Allele T 276/324 0.799(0.652~0.979) 0.030# 36/324 0.420(0.283~0.624) 1.144E-5* 240/324 0.924(0.746~1.144) 0.469
C 516/484 1 128/484 1 388/484 1
rs11062357 All 0.717 2.147E-8* 0.009*
Genotype CC 20/18 1.160(0.599~2.248) 18/18 7.546(3.584~15.890) 1.888E-9* 2/18 0.138(0.032~0.603) 0.002*
CT 116/110 1.097(0.797~1.511) 28/110 1.780(1.027~3.087) 88/110 0.999(0.712~1.403)
TT 258/274 1 36/274 1 222/274 1
Allele C 156/146 1.112(0.866~1.429) 0.405 64/146 2.884(2.010~4.140) 3.456E-9* 92/146 0.779(0.586~1.036) 0.086
T 632/658 1 100/658 1 532/658 1
JMY rs2607142 All 0.064 3.825E-4* 0.007*
genotype AA 80/58 1.478(0.961~2.273) 8/58 0.417(0.182~0.956) 0.018# 72/58 2.079(1.315~3.289) 0.003*
AG 200/230 0.892(0.647~1.229) 32/230 0.363(0.216~0.612) 1.809E-4* 168/230 1.187(0.832~1.696)
GG 114/116 1 42/116 1 72/116 1
allele A 360/346 1.123(0.922~1.369) 0.250 48/346 0.553(0.384~0.795) 0.001* 312/346 1.335(1.082~1.647) 0.007*
G 428/462 1 116/462 1 312/462 1
rs16876619 All 0.005* 0.017# 0.002*
genotype TT 46/22 2.257(1.297~3.925) 0.005* 6/22 1.120(0.427~2.941) 40/22 2.654(1.497~4.704) 0.001*
CT 170/197 0.914(0.681~1.227) 26/197 0.490(0.291~0.825) 0.005* 144/197 1.066(0.778~1.461)
CC 178/183 1 50/183 1 128/183 1
allele T 262/241 1.164(0.942~1.438) 0.160 38/241 0.232(0.161~0.335) 1.172E-16* 224/241 1.308(1.047~1.634) 0.018#
C 526/563 1 382/563 1 400/563 1
rs16876657 All 0.012# 0.006* 0.051
genotype GG 2/0 N/A 0/0 N/A 2/0 N/A
AG 52/81 0.609(0.416~0.891) 0.009* 6/81 0.311(0.130~0.742) 0.006* 46/81 0.692(0.465~1.030)
AA 340/321 1 76/321 1 264/321 1
allele G 56/81 0.683(0.478~0.975) 0.035# 6/81 0.339(0.145~0.791) 0.009* 50/81 0.778(0.538~1.125) 0.181
A 732/723 1 158/723 1 574/723 1
PTGER4 rs10440635 All 0.523 8.649E-6* 9.282E-5*
AA 20/28 0.677(0.369~1.244) 18/28 4.899(2.389~10.044) 1.126E-6* 2/28 0.079(0.018~0.335) 1.763E-5*
AG 148/148 0.973(0.723~1.310) 36/150 1.881(1.097~3.227) 0.014# 112/150 0.857(0.626~1.174)
GG 228/226 1 28/226 1 200/226 1
A 188/204 0.915(0.729~1.150) 0.448 72/204 2.302(1.627~3.256) 1.667E-6* 116/204 0.666(0.516~0.861) 0.002*
G 604/600 1 92/600 1 512/600 1
a: ”All” means the p value that we compare all the three genotypes using 3×2 chi squared method.
b: The last lines of genotypes or alleles are the major genotypes or the major alleles. The other genotypes or alleles are compared to them. p-value for individual genotypes are shown only if significant at 0.05 level. The relative risk associated with major genotypes and major alleles is estimated as an odds ratio (OR) with a 95% confidence interval (CI).
c: OR (95% CI) are adjusted by age and sex using binary logistic regression analysis.
# indicates p-value is less than 0.05 but cannot pass Bonferroni correction which shows marginal significant difference. *. indicates p-value is less than 0.01 which shows significant difference after Bonferroni correction.
normal AS patients versus the control subjects (Table S1). The rs7134353 SNP shows significant difference when comparing severe AS patients to controls, with AA genotype higher in
severe AS than in controls (p=2.241×10⁻⁴). The rs2284336 SNP
shows significant difference when comparing all AS patients to controls, with CT genotype lower in all AS than in controls (p=1.858×10⁻⁴); this SNP also shows significant difference
when comparing severe AS patients to controls, with CT genotype lower in severe AS patients than in controls (p=1.217×10⁻⁶), and T allele lower in severe AS than in controls
(p=1.144×10⁻⁵). The rs11062357 SNP shows significant
difference when comparing severe AS patients to controls, with CC genotype higher in severe AS than in controls (p=1.888×10⁻⁹) and C allele higher in severe AS than in
controls (p=3.456×10⁻⁹); this SNP also shows significant
difference when comparing normal AS to controls, with CC genotype lower in normal AS than in controls (p=0.002).
The SNPs in JMY are compared between all AS patients,
severe AS patients, and normal AS patients versus the control subjects (Table S2). The rs2607142 SNP shows significant difference when comparing severe AS patients to controls, with AG genotype lower in severe AS than in controls
(p=1.809×10⁻⁴) and A allele lower in severe AS than in controls
(p=0.001); This SNP also show significant difference when comparing normal AS to controls, with AA genotype higher in normal AS than in controls (p=0.003) and A allele higher in normal AS than in controls (p=0.007). The rs16876619 SNP shows significant difference when comparing all AS patients to controls, with TT genotype higher in all AS than in controls (p=0.005); this SNP also shows significant difference when comparing severe AS patients to controls, with CT genotype lower in severe AS than in controls (p=0.005), T allele lower in severe AS than in controls(p=1.172×10⁻¹⁶) ; and this SNP
shows significant difference when comparing normal AS patients to controls, with TT genotype higher in normal AS than in controls (p=0.001). Additionally CT genotype is lower than TT genotype (p=0.001). The rs4704556 SNP shows significant difference when comparing severe AS patients to controls, with CC genotype higher in severe AS than in controls (p=5.844×10⁻⁷), C allele is higher in severe AS than in controls
(p=2.249×10⁻⁷). The rs16876657 SNP shows significant
difference when comparing all AS patients to controls, with AG genotype lower in all AS than in controls (p=0.009); this SNP also shows significant difference when comparing severe AS patients to controls, with AG genotype lower in severe AS than in controls (p=0.006), G allele lower in severe AS than in controls (p=0.009)
The SNPs in PTGER4 are compared between all AS
patients, severe AS patients, and normal AS patients versus the control subjects (Table S3). The rs10440635 SNP shows significant difference when comparing severe AS patients to controls, with AA genotype higher in severe AS than in controls (p=1.126×10⁻⁶), A allele higher in severe AS than in controls
(p=1.667×10⁻⁶); this SNP also shows significant difference
when comparing normal AS to controls, with AA genotype lower in normal AS than in controls (p=1.763×10⁻⁵), A allele
lower in normal AS than in controls (p=0.002). The rs4957341 SNP shows significant difference when comparing severe AS
to controls, with AA genotype higher in severe AS than in controls (p=0.003).
Referring to the data from Hapmap: in JARID1A, rs2284336
is in 100% LD with rs11062385; in JMY, rs16876657 is related
to susceptibility of AS. These results can support the former
researches in western descendent. PTGER4 shows no
association with susceptibility of AS in Han Chinese. The
rs11062357 SNP in JARID1A, the rs2607142 SNP in JMY and
rs10440635 in PTGER4 are related to severity of AS.
3: Haplotype
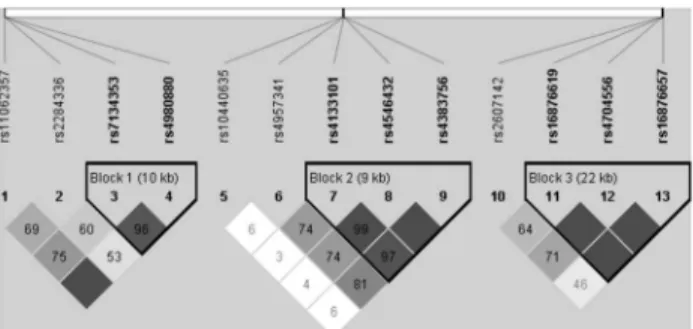
Linkage disequilibrium (LD) maps of the 13 tagSNPs of
JARID1A, JMY and PTGER4 comparing all AS patients, severe
AS patients, and normal AS patients to controls subjects are shown in Figure 2, Figure S1 and Figure S2, respectively. These figures have only a little difference, only Figure 2 is shown in the text comparing all AS patients to controls. Figure S1 and Figure S2 are shown in the appendices comparing severe patients and normal patients to controls separately. Analyses of constructed haplotypes are shown in Table S4, Table S5 and Table S6 in appendices. When comparing all AS to controls (Table S4), the rs4133101,rs4546432 and
rs4383756 SNPs in PTGER4 show significant difference, the
haplotype CTT frequency is higher than controls
(p=6.266×10⁻⁸). When comparing severe AS to controls (Table
S5), the rs7134353 and rs4980880 SNPs in JARID1A show
significant difference, the haplotype TT is lower than controls
(p=4.136×10⁻⁴). The rs16876619 and rs4704556 SNPs in JMY
show significant difference, the haplotype CC is higher than controls (p=2.682×10⁻⁷); the haplotype CT is lower than
controls (p=4.660×10⁻⁵). When comparing normal AS to
controls (Table S6), the rs16876619, rs4704556 and
rs16876657 SNPs in JMY shows marginal significant
difference, the haplotype TTA is marginal significant higher than controls but cannot pass Bonferroni correction (p=0.028).
In conclusion, PTGER4 is related to susceptibility to AS;
JARID1A and JMY are related to severity of AS.
Discussion
Three genes studied include JARID1A, JMY, and PTGER4.
JARID1A regulates gene expression and is involved in
tumorigenesis; it has been best studied in association with
breast cancer [8,10,11]. JMY encodes a transcription co-factor
that augments the p53 tumor suppressor response [12].
PTGER4 encodes a prostaglandin receptor, and its
down-regulation halts certain cell proliferation [13,14]. JARID1A,
JMY, and PTGER4 have been linked to AS in GWAS in
patients of western European descents [15-17]; we focus on particular SNPs of these genes in the Chinese Han population.
In comparing 396 AS patients and 404 healthy controls, we find that Frequencies of different genotypes and alleles are analyzed among the different severity AS patients and the
controls. The rs2284336 SNP in JARID1A, the rs16876619 and
rs16876657 SNPs in JMY are associated with susceptibility of
AS. The rs11062357 SNP in JARID1A, the rs2607142 SNP in
JMY and rs10440635 in PTGER4 are related to severity of AS.
susceptibility to AS; JARID1A and JMY are related to severity of AS.
JARID1A is recently found to interact physically and
functionally with the Polycomb complex. This protein can influence the differentiation of CD4+ T-cells [27]. Other research supports that JARID1A plays an important role in regulation of immune cells such as CD56+ NK cells, CD8+ T cells, dendritic cells and CD34+ cells [28]. In addition to
susceptibility to AS, the rs2284336 SNP in JARID1A may have
association with other autoimmune diseases.
With its influence on p53, JMY can affects apoptosis during
the DNA damage response [29]. PTGER4-encoded EP4R
signaling mediates ultraviolet induced immunosuppression through modulation of regulatory T cells and RANKL expression [30]; furthermore, EP4R can restrict the survival of immature B cells [31]. The exact mechanisms how JMY and
PTGER4-encoded EP4R’s effects on the immune system can
influence the AS disease processes remain to be elucidated. Histone demethylase JARID1A is found to be related to susceptibility to AS in the western descendent [17]. This mechanism should be investigated in Chinese Han population. The severe AS patient’s subgroup has 82 patients. This may be a low power data. However, these patients are in the nature course of the disease with only non-steroidal anti-inflammatory drugs treatments and have severe deformity, which may be impossible to be found in the western countries due to their regular treatments. We are the first to divide the AS patients into subgroups due to severity. Severity is related to prognosis of AS which is important for patients and therapeutic method choice.
Figure 2. Linkage disequilibrium (LD) map comparing all AS patients and controls. Darker color indicates higher linkage disequilibrium (LD), lighter color indicates less LD. Numbers in the squares indicate correlation coefficient (R2)
value. The left part of the picture contains 4 SNPs (from
rs11062357 to rs4980880). They are from JARID1A. The
middle part of the picture contains 5 SNPs (from rs10440635 to
rs4383756). They are from PTGER4. The right part of the
picture contains 4 SNPs (from rs2607142 to rs16876657). They
are from JMY. Haplotypes are constructed from the darker
blocks (high linkage disequilibrium). Haplotypes are constructed from each blocks, the details of haplotypes are summarized in Table S4. Block 2 contains rs4133101
rs4546432 and rs4383756 SNPs in PTGER4. CTT frequency is
higher than controls (p=6.266×10⁻⁸).
doi: 10.1371/journal.pone.0074794.g002
In conclusion, in Chinese patients, JARID1A, JMY and
PTGER4 are related to susceptibility to AS; JARID1A and JMY
are related to severity of AS. These findings may lead to full understanding of the genetic and molecular pathogenesis of AS. Of clinical relevance, the specific SNPs in these genes can be used to guide genetic analysis and counseling, medical and surgical treatment options, and ultimate prognosis. Further studies are needed to elucidate the molecular roles these genes play in AS.
Supporting Information
Figure S1. Linkage disequilibrium map comparing severe AS patients and controls. The distribution and position of SNPs are the same as Figure 2. Haplotypes are constructed from the darker blocks (high linkage disequilibrium). Haplotypes are constructed from each blocks, the details of haplotypes are summarized in Table S5. Block 1 contains rs7134353 and rs4980880 SNPs in JARID1A. TT is lower than
controls (p=4.136×10⁻⁴). Block 3 contains rs16876619 and
rs4704556 SNPs in JMY. CC is higher than controls
(p=2.682×10⁻⁷). CT is lower than controls (p=4.660×10⁻⁵).
(TIF)
Figure S2. Linkage disequilibrium map comparing normal AS patients and controls. The distribution and position of SNPs are the same as Figure 2. Haplotypes are constructed from each blocks, the details of haplotypes are summarized in Table S6. Block 3 contains rs16876619, rs4704556 and rs16876657 SNPs in JMY. TTA is marginal significant higher than controls but cannot pass Bonferroni correction.
(TIF)
Table S1. Genotype and allele frequencies of JARID1A SNPs among all AS patients, severe AS patients, normal AS patients versus controls. SNPs in JARID1A are compared between all AS patients, severe AS patients, and normal AS patients versus the control subjects. P-value for each SNP is shown, and p-value for individual genotypes are shown only if significant at 0.05 level. # indicates P-value is less than 0.05 but cannot pass Bonferroni correction which shows marginal significant difference. *indicates P-value is less than 0.01 which shows significant difference after Bonferroni correction. The rs7134353 SNP shows significant difference when comparing severe AS patients to controls, AA genotype is higher than controls (p=2.241×10⁻⁴). The rs2284336 SNP
shows significant difference when comparing all AS patients to controls, the CT genotype is lower than controls (p=1.858×10⁻⁴); this SNP also shows significant difference
when comparing severe AS patients to controls, CT genotype is lower than controls (p=1.217×10⁻⁶), and T allele is lower than
controls (p=1.144×10⁻⁵). The rs11062357 SNP shows
significant difference when comparing severe AS patients to controls, CC genotype is higher than controls (p=1.888×10⁻⁹)
and C allele is higher than controls (p=3.456×10⁻⁹); this SNP
(DOCX)
Table S2. Genotype and allele frequencies of JMY SNPs among all AS patients, severe AS patients, normal AS patients versus controls. SNPs in JMY are compared between all AS patients, severe AS patients, and normal AS patients versus the control subjects. The rs2607142 SNP shows significant difference when comparing severe AS patients to controls, AG genotype is lower than controls (p=1.809×10⁻⁴) and A allele is lower than controls (p=0.001);
This SNP also show significant difference when comparing normal AS to controls, AA genotype is higher than controls (p=0.003) and A allele is higher than controls (p=0.007). The rs16876619 SNP shows significant difference when comparing all AS patients to controls, TT genotype is higher than controls (p=0.005); this SNP also shows significant difference when comparing severe AS patients to controls, CT genotype is lower than controls (p=0.005), T allele is lower than
controls(p=1.172×10⁻¹⁶) ; And this SNP shows significant
difference when comparing normal AS patients to controls, TT genotype is higher than controls (p=0.001). Additionally CT genotype is lower than TT genotype (p=0.001). The rs4704556 SNP shows significant difference when comparing severe AS patients to controls, CC genotype is higher than controls (p=5.844×10⁻⁷), C allele is higher than controls (p=2.249×10⁻⁷).
The rs16876657 SNP shows significant difference when comparing all AS patients to controls, AG genotype is lower than controls (p=0.009); this SNP also shows significant difference when comparing severe AS patients to controls AG genotype is lower than controls (p=0.006), G allele is lower than controls (p=0.009).
(DOCX)
Table S3. Genotype and allele frequencies of PTGER4 SNPs among all AS patients, severe AS patients, normal AS patients versus controls. SNPs in PTGER4 are compared between all AS patients, severe AS patients, and normal AS patients versus the control subjects. The rs10440635 SNP shows significant difference when comparing severe AS patients to controls, AA genotype is higher than controls (p=1.126×10⁻⁶), A allele is higher than controls
(p=1.667×10⁻⁶); this SNP also shows significant difference
when comparing normal AS to controls, AA genotype is lower than controls (p=1.763×10⁻⁵), A allele is lower than controls
(p=0.002). The rs4957341 SNP shows significant difference when comparing severe AS to controls, AA genotype is higher than controls (p=0.003).
(DOCX)
Table S4. Haplotype analysis comparing all AS patients to controls. Haplotypes are constructed due to LD map (Figure 2). Case ratio means in the case group, the frequency of this kind of haplotype vs. other kinds of haplotype; control ratio means in the control group, the frequency of this kind of haplotype vs. other kinds of haplotype. Block 2 contains rs4133101 rs4546432 and rs4383756 SNPs in PTGER4. CTT frequency is higher than controls (p=6.266×10⁻⁸).
(DOCX)
Table S5. Haplotype analysis comparing severe AS patients to controls. Haplotypes are constructed due to Figure A1. Case ratio means in the severe AS group, the frequency of this kind of haplotype vs. other kinds of haplotype; control ratio means in the control group, the frequency of this kind of haplotype vs. other kinds of haplotype. Block 1 contains rs7134353 and rs4980880 SNPs in JARID1A. TT is lower than controls (p=4.136×10⁻⁴). Block 3 contains rs16876619 and rs4704556 SNPs in JMY. CC is higher than controls (p=2.682×10⁻⁷). CT is lower than controls (p=4.660×10⁻⁵). (DOCX)
Table S6. Haplotype analysis comparing severe AS patients to controls. Haplotypes are constructed. Case ratio means in the case group, the frequency of this kind of haplotype vs. other kinds of haplotype; control ratio means in the control group, the frequency of this kind of haplotype vs. other kinds of haplotype. Block 3 contains rs16876619, rs4704556 and rs16876657 SNPs in JMY. TTA is marginal significant higher than controls but cannot pass Bonferroni correction.
(DOCX)
Acknowledgements
The authors wish to thank all the patients and families that participated in this study, and all clinical doctors helped us in Chinese PLA general hospital.
Author Contributions
Conceived and designed the experiments: WC ZJL. Performed the experiments: WC ZJL CC. Analyzed the data: WC ZJL JYL YW. Contributed reagents/materials/analysis tools: WC CC. Wrote the manuscript: WC ZJL LLS YW. Constructed the haplotype: JYL.
References
1. Brown MA, Wordsworth BP, Reveille JD (2002) Genetics of ankylosing spondylitis. Clin Exp Rheumatol 20: S43–S49. PubMed: 12463446. 2. Braun J, Sieper J (2007) Ankylosing spondylitis. Lancet; 369:
1379-1390. doi:10.1016/S0140-6736(07)60635-7. PubMed: 17448825. 3. van der Heijde D (2004) Radiographic progression in ankylosing
spondylitis. Ann Rheum Dis 63 (suppl 1): 98–101. doi:10.1136/ard. 2003.006056. PubMed: 14672901.
4. Gran JT, Skomsvoll JF (1997) The outcome of ankylosing spondylitis: a study of 100 patients. Br J Rheumatol 36: 766-771. doi:10.1093/ rheumatology/36.7.766. PubMed: 9255111.
5. Carette S, Graham D, Little H, Rubenstein J, Rosen P (1983) The natural disease course of ankylosing spondylitis. Arthritis Rheum 26: 186-190. doi:10.1002/art.1780260210. PubMed: 6600615.
6. Hamersma J, Cardon LR, Bradbury L, Brophy S, van der Horst-Bruinsma I et al. (2001) Is disease severity in ankylosing spondylitis genetically determined? Arthritis Rheum Vol. 44, No. 6, June: 1396– 1400. doi:10.1002/1529-0131(200106)44:6. PubMed: 11407700. 7. Defeo-Jones D, Huang PS, Jones RE, Haskell KM, Vuocolo GA et al.
retinoblastoma gene product. Nature; 352: 251–254. doi: 10.1038/352251a0. PubMed: 1857421.
8. Zhou X, Sun H, Chen H, Zavadil J, Kluz T et al. (2010) Hypoxia Induces Trimethylated H3 Lysine 4 by Inhibition of JARID1A Demethylase. Cancer Res; 70: 4214-4221. doi: 10.1158/1538-7445.AM10-4214. PubMed: 20406991.
9. Baker LA, Allis CD, Wang GG (2008) PHD fingers in human diseases: Disorders arising from misinterpreting epigenetic marks. Mutat Res; 647: 3–12. doi:10.1016/j.mrfmmm.2008.07.004. PubMed: 18682256. 10. Chan SW, Hong W (2002) Retinoblastoma-binding protein 2 (RBP2)
potentiates nuclear receptor-mediated transcription. J Biol Chem 276: 28402-28412.
11. Catchpole S, Spencer-Dene B, Hall D, Santangelo S, Rosewell I et al. (2011) Ply-1/Jarid1B/Kdm5B is required for embryonic survival and contributes to cell proliferation in the mammary gland and in ER+ breast cancer cells. Int J Oncol 38: 1267-1277. PubMed: 21369698. 12. Shikama N, Lee CW, France S, Delavaine L, Lyon J et al. (1999) A
novel cofactor for p300 that regulates the p53 response. Mol Cell 4: 365–376. doi:10.1016/S1097-2765(00)80338-X. PubMed: 10518217. 13. Robertson FM, Simeone AM, Lucci A, McMurray JS, Ghosh S et al.
(2010) Differential Regulation of The Aggressive Phenotype of Inflammatory Breast Cancer Cells By Prostanoid Receptors EP3 and EP4. Cancer. 116(11 Suppl): 2806–2814. doi:10.1002/cncr.25167. PubMed: 20503412.
14. Ma X, Kundu N, Rifat S, Walser T, Fulton AM (2006) Prostaglandin E receptor EP4 antagonism inhibits breast cancer metastasis. Cancer Res 66: 2923–2927. doi:10.1158/0008-5472.CAN-05-4348. PubMed: 16540639.
15. WTCCC and TAST (2007) Association scan of 14,500 nsSNPs in four common diseases identifies variants involved in autoimmunity. Nat Genet 39(11) (1329–1337)
16. The Australo-Anglo-American Spondyloarthritis Consortium1 (TASC) & the Wellcome Trust Case Control Consortium (WTCCC) (2011). Interaction Between ERAP 1 and HLA-B27 in ankylosing spondylitis implicates peptide handling in the mechanism for HLA-B27 in disease susceptibility. Nature Genetics: 43 number 8 August
17. Pointon JJ, Harvey D, Karaderi T, Appleton LH, Farrar C et al. (2011) The histone demethylase JARID1A is associated with susceptibility to ankylosing spondylitis. Genes Immun 12: 395–398. doi:10.1038/gene. 2011.23. PubMed: 21562575.
18. van der Linden S, Valkenburg HA, Cats A (1984) Evaluation of diagnostic criteria for ankylosing spondylitis. A proposal for modification of the New York criteria. Arthritis Rheum 27: 361-368. doi:10.1002/art. 1780270401. PubMed: 6231933.
19. Calin A, Garrett S, Whitelock H, Kennedy LG, O’Hea J et al. (1994) A new approach to defining functional ability in ankylosing spondylitis: the
development of Bath ankylosing spondylitis disease functional index (BASFI). J Rheumatol 21: 2281–2285. PubMed: 7699629.
20. Garrett S, Jenkinson TR, Whitelock HC, Kennedy LG, Gaisford P et al. (1994) A new approach to defining disease status in AS: the Bath ankylosing spondylitis disease activity index (BASDAI). J Rheumatol 21: 2286–2291. PubMed: 7699630.
21. Baraliakos X, Listing J, von der Recke A, Braun J (2009) The natural course of radiographic progression in ankylosing spondylitis–evidence for major individual variations in a large proportion of patients. J Rheumatol; 36: 997-1002. doi:10.3899/jrheum.080871. PubMed: 19332632.
22. Creemers MC, Franssen MJ, van’t Hof MA, Gribnau FW, van de Putte LB et al. (2005) Assessment of outcome in ankylosing spondylitis: an extended radiographic scoring system. Ann Rheum Dis;64: 127–129. doi:10.1136/ard.2004.020503. PubMed: 15051621.
23. Sieper J, Rudwaleit M, Baraliakos X, Brandt J, Braun J et al. (2009) The Assessment of SpondyloArthritis international Society (ASAS) handbook: a guide to assess spondyloarthritis. Ann Rheum Dis; 68(Suppl II): 1–44. PubMed: 19088258.
24. Amor B, Santos RS, Nahal R, Listrat V, Dougados M (1994) Predictive factors for the longterm outcome of spondyloarthropathies. J Rheumatol; 21: 1883-1887. PubMed: 7837155.
25. Kiaer T, Gehrchen M (2010) Transpedicular closed wedge osteotomy in ankylosing spondylitis: results of surgical treatment and prospective outcome analysis. Eur Spine J 19: 57–64. doi:10.1007/ s00586-009-1104-8. PubMed: 19662442.
26. Tost J, Gut IG (2005) Genotyping single nucleotide polymorphisms by MALDI mass spectrometry in clinical applications. Clin Biochem 38: 335-350. doi:10.1016/j.clinbiochem.2004.12.005. PubMed: 15766735. 27. Wei G, Wei L, Zhu J, Zang C, Zhao K (2009) Global mapping of
H3K4me3 and H3K27me3 reveals specificity and plasticity in lineage fate determination of differentiating CD4+ T cells. Immunity; 30(1): 155–167. doi:10.1016/j.immuni.2008.12.009. PubMed: 19144320. 28. Su AI, Cooke MP, Ching KA, Hakak Y, Walker JR et al. (2002)
Large-scale analysis of the human and mouse transcriptomes. Proc Natl Acad Sci U S A; 99: 4465-4470. doi:10.1073/pnas.012025199. PubMed: 11904358.
29. Coutts AS, Boulahbel H, Graham A, La Thangue NB (2007) Mdm2 targets the p53 transcription cofactor JMY for degradation. EMBO Rep vol 8: 84–90 No 1. PubMed: 17170761
30. Soontrapa K, Honda T, Sakata D, Yao C, Hirata T et al. (2011) Prostaglandin E2-prostoglandin E receptor subtype 4 (EP4) signaling mediates UV irradiation-induced systemic immunosuppression. Proc Natl Acad Sci USA vol. 108, No. 16: 6668-6673. doi:10.1073/pnas. 1018625108. PubMed: 21460251.