Esophageal Cancer in a Chinese Population
Liming Wang1., Weifeng Tang2., Suocheng Chen2., Yangyong Sun2
, Yu Fan1, Yijun Shi2, Jingfeng Zhu2, Xu Wang2, Liang Zheng3, Aizhong Shao2, Guowen Ding2, Chao Liu2, Ruiping Liu4, Jun Yin2*,
Haiyong Gu2*
1Cancer institute, Department of Chemotherapy, People’s Hospital Affiliated to Jiangsu University, Zhenjiang, Jiangsu, China,2Department of Cardiothoracic Surgery, Affiliated People’s Hospital of Jiangsu University, Zhenjiang, China,3Department of Cardiothoracic Surgery, The First People’s Hospital of Changzhou and The Third Affiliated Hospital of Suzhou University, Changzhou, China,4Department of Orthopedics, Affiliated Hospital of Nanjing Medical University, Changzhou Second People’s Hospital, Changzhou, China
Abstract
Esophageal cancer was the fifth most commonly diagnosed cancer and the fourth leading cause of cancer-related death in China in 2009. Genetic factors might play an important role in the carcinogenesis of esophageal squamous cell carcinoma (ESCC). We conducted a hospital-based case-control study to evaluate tenNAT2tagging single nucleotide polymorphisms (SNPs) on the risk of ESCC. Six hundred and twenty-nine ESCC cases and 686 controls were recruited. Their genotypes were determined using the ligation detection reaction method. In the single locus analyses, there was a borderline statistically significant difference in genotype frequencies ofNAT2rs1565684 T.C SNP between the cases and the controls (p= 0.057). TheNAT2rs1565684 CC genotype was associated with a borderline significantly increased risk for ESCC (CCvs.TT: adjusted OR = 1.77, 95% CI = 0.97–3.21,p= 0.063 and CCvs.TT/TC: adjusted OR = 1.68, 95% CI = 0.93–3.04,p= 0.085). The association was evident among older patients and patients who never drunk. After the Bonferroni correction, in all comparison models, NAT2 rs1565684 T.C SNP was not associated with ESCC risk (p.0.05). For the other nine NAT2 SNPs, after Bonferroni correction, in all comparison models, the nine SNPs were also not associated with ESCC risk (p.0.05). Thus, nineNAT2 tagging SNPs were not associated with risk of ESCC.NAT2rs1565684 T.C SNP might play a slight role in ESCC etiology. Additional, larger studies and tissue-specific biological characterization are required to confirm the current findings.
Citation:Wang L, Tang W, Chen S, Sun Y, Fan Y, et al. (2014)N-acetyltransferase 2Polymorphisms and Risk of Esophageal Cancer in a Chinese Population. PLoS ONE 9(2): e87783. doi:10.1371/journal.pone.0087783
Editor:Qing-Yi Wei, Duke Cancer Institute, United States of America
ReceivedNovember 3, 2013;AcceptedJanuary 1, 2014;PublishedFebruary 19, 2014
Copyright:ß2014 Wang et al. This is an open-access article distributed under the terms of the Creative Commons Attribution License, which permits unrestricted use, distribution, and reproduction in any medium, provided the original author and source are credited.
Funding:This study was supported in part by National Natural Science Foundation of China (81370001, 81371927, 81101889, 81000028), Jiangsu Province Natural Science Foundation (BK2010333, BK2011481), Social Development Foundation of Zhenjiang (SH2010017), Changzhou Young Talents and Science-Technology Foundation of Health Bureau (QN201102), Affiliated People’s Hospital of Jiangsu University fund (Y200913) and Jiangsu University Clinical medicine science and technology development fund (JLY20120004). The funders had no role in study design, data collection and analysis, decision to publish, or preparation of the manuscript.
Competing Interests:The authors have declared that no competing interests exist. * E-mail: yin912@126.com (JY); haiyong_gu@hotmail.com (HG)
.These authors contributed equally to this work.
Introduction
Esophageal cancer was the fourth leading cause of cancer death and the fifth most commonly diagnosed cancer in China in 2009 [1]. Genetic factors, such as single nucleotide polymorphisms (SNPs), might play an important role in the carcinogenesis of esophageal squamous cell carcinoma (ESCC) [2].
N-acetyltransferase 2 (NAT2) is an enzyme that plays an essential role in the metabolism of various potential carcinogens. NAT2 is mainly expressed in the human liver and gastrointestinal tract. The NAT2gene is located on 8p21.3-23.1 and encodes a 290-amino acid protein, NAT2 [3].NAT2is polymorphic, and it was thought that NAT2 acetylation status alteration caused by
NAT polymorphisms decreased enzymatic activity and result in absence of detoxification efficiency, which could lead to an increase in cancer susceptibility [4]. It has been reported that
NAT2 polymorphisms and/or their interaction with smoking is associated with various types of malignancies.
Genetic variation ofNAT2may lead to differences in the rate of arylamine metabolism and consequently increase cancer risk [5]. The substrates for NAT2 that are involved in carcinogenesis, are represented mainly by heterocyclic amines and polycyclic aromatic hydrocarbon rings found in cooked or smoked meat [6] and cigarette smoke [7].
NAT2genetic variations may contribute to the development of ESCC. In a hospital-based case-control study, we performed genotyping analyses of tenNAT2tagging SNPs in 629 ESCC cases and 686 controls in a Chinese population.
Materials and Methods
Ethical approval of the study protocol
and/or animals. All subjects provided written, informed consent to be included in the study.
Patients and Controls
Six hundred and twenty-nine subjects with esophageal cancer were consecutively recruited from the Affiliated People’s Hospital of Jiangsu University and Affiliated Hospital of Jiangsu University (Zhenjiang, China) between October 2008 and December 2010. All cases of esophageal cancer were diagnosed as ESCC pathologically. The exclusion criteria were patients who had previously had: cancer; any metastasized cancer; radiotherapy or chemotherapy. The 686 controls were patients without cancer and were matched to the cases with regard to age (65 years) and sex. They were recruited from the two hospitals mentioned above during the same time period. Most of the controls were admitted to the hospitals for the treatment of trauma.
Trained interviewers, using a pre-tested questionnaire, ques-tioned each subject personally to obtain information on demo-graphic data (e.g., age, sex) and related risk factors (including tobacco smoking and alcohol consumption). After the interview, 2-mL samples of venous blood were collected from each subject. Individuals who smoked one cigarette per day for.1 year were defined as ‘‘smokers’’. Subjects who consumed more than three alcoholic drinks a week for .6 months were considered to be ‘‘alcohol drinkers’’.
Isolation of DNA, SNPs selection and genotyping by ligation detection reaction
Blood samples were collected from patients using Vacutainers and transferred to tubes lined with ethylenediamine tetra-acetic acid (EDTA). Genomic DNA was isolated from whole blood with the QIAamp DNA Blood Mini Kit (Qiagen, Berlin, Germany) [8]. We used a block-based tagging strategy to find tagging SNPs using Haploview 4.2 software, according to the HapMap database (http://www.hapmap.org/, phase II Nov08, on NCBI B36 assembly, dbSNP b126; population: Chinese Han population); minor allele frequency (MAF)$0.05, Hardy-Weinberg equilibri-um (HWE)p$0.05 and call rate$95%) on the basis of pairwise linkage disequilibrium r2 threshold of 0.8. Ten NAT2 tagging SNPs were thus selected. The samples were genotyped using the ligation detection reaction (LDR) method, with technical support from the Shanghai Biowing Applied Biotechnology Company [9,10]. For quality control, repeated analyses were done for 160 (12.17%) randomly selected samples with high DNA quality.
Statistical Analyses
Differences in the distributions of demographic characteristics, selected variables, and genotypes of the NAT2 variants between the cases and controls were evaluated using the x2 test. The
associations between the ten SNPs and risk of ESCC were estimated by computing the odds ratios (ORs) and their 95% confidence intervals (CIs) using logistic regression analyses for crude ORs and adjusted ORs when adjusting for age, sex, smoking and drinking status. The Bonferroni correction procedure was applied because of the number of comparisons. The HWE was tested by a goodness-of-fit x2 test to compare the observed
genotype frequencies to the expected frequencies among the control subjects. All statistical analyses were performed with SAS 9.1.3 (SAS Institute, Cary, NC, USA).
Results
Characteristics of the study population
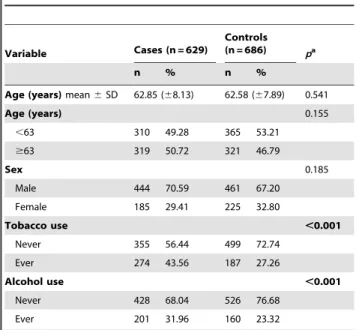
Characteristics of cases and controls included in the study are summarized in Table 1. The cases and controls appeared to be adequately matched on age and sex as suggested by thex2tests. As
shown in Table 1, significant difference was detected on smoking status between the cases and the controls, and drinking rate was higher in ESCC patients than in control subjects. The primary information for eight genotyped SNPs was in Table 2. The concordance rates of repeated analyses were 100% exceptNAT2
rs11996129 T.C (157/160, 98.13%), rs1565684 T.C (159/160, 99.38%) and rs1799930 G.A (159/160, 99.38%). MAF in our controls was similar to MAF for Chinese in database for all SNPs. The observed genotype frequencies for these ten polymorphisms in the controls were all in HWE except NAT2 rs4540438 A.C (p= 0.015) (Table 2).
Associations between NAT2 tagging polymorphisms and risk of ESCC
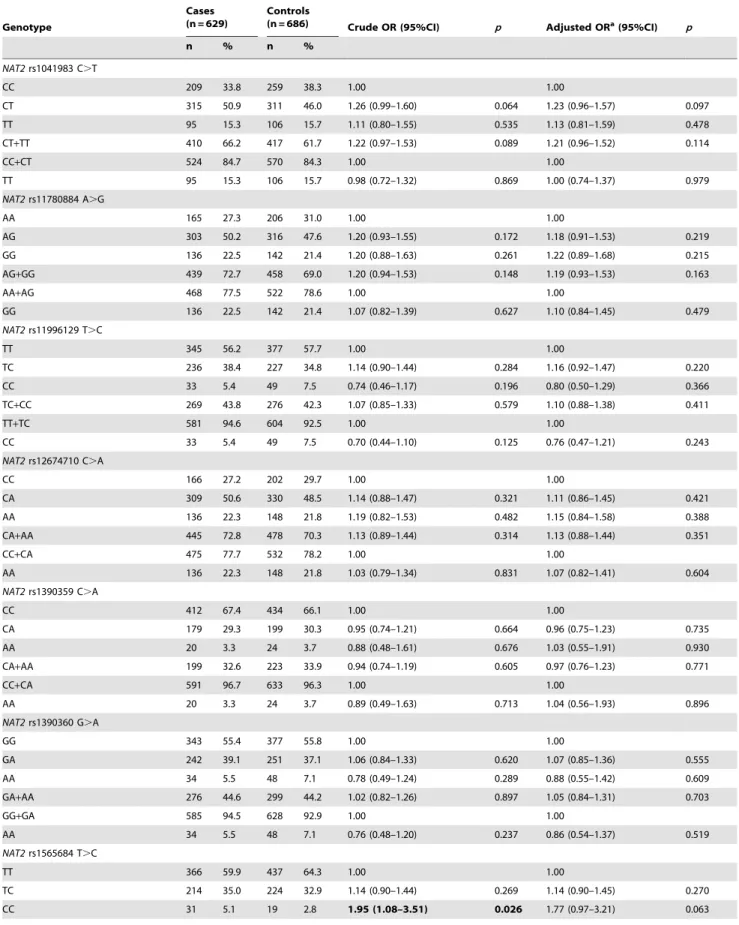
The genotype distributions of NAT2 rs1565684 T.C in the cases and the controls are shown in Table 3. In the single locus analyses, there was a borderline statistically significant difference in genotype frequencies ofNAT2rs1565684 T.C SNP between the cases and the controls (p= 0.057). When theNAT2rs1565684 TT homozygote genotype was used as the reference group, the TC genotype was not associated with the risk for ESCC (TC vs. TT: OR = 1.14, 95% CI = 0.90–1.44,p= 0.269); the CC genotype was associated with a significantly increased risk for ESCC (CC vs. TT: OR = 1.95, 95% CI = 1.08–3.51, p= 0.026). In the dominant model, theNAT2rs1565684 TC/CC variants were not associated with the risk of ESCC, compared with theNAT2rs1565684 TT genotype (TC/CC vs. TT: OR = 1.20, 95% CI = 0.96–1.51,
p= 0.107). In the recessive model, when theNAT2rs1565684 TT/ TC genotypes were used as the reference group, the CC homozygote genotype was associated with an 86% increased risk
Table 1.Distribution of selected demographic variables and risk factors in ESCC cases and controls.
Variable Cases (n = 629)
Controls (n = 686) pa
n % n %
Age (years)mean6SD 62.85 (68.13) 62.58 (67.89) 0.541
Age (years) 0.155
,63 310 49.28 365 53.21
$63 319 50.72 321 46.79
Sex 0.185
Male 444 70.59 461 67.20
Female 185 29.41 225 32.80
Tobacco use ,0.001
Never 355 56.44 499 72.74
Ever 274 43.56 187 27.26
Alcohol use ,0.001
Never 428 68.04 526 76.68
Ever 201 31.96 160 23.32
aTwo-sided
x2test and student t test; Bold values are statistically significant
(p,0.05).
doi:10.1371/journal.pone.0087783.t001
Polymorphisms ofNAT2and Esophageal Cancer Risk
rs1799931 G.A and rs4540438 A.C polymorphisms.
Genotyped SNPs
NAT2 rs1041983 C.T
NAT2 rs11780884 A.G
NAT2rs11996129 T.C
NAT2 rs12674710 C.A
NAT2 rs1390359 C.A
NAT2 rs1390360 G.A
NAT2 rs1565684T.C
NAT2 rs1799930 G.A
NAT2 rs1799931 G.A
NAT2 rs4540438 A.C
Chromosome 8 8 8 8 8 8 8 8 8 8
Gene Official Symbol NAT2 NAT2 NAT2 NAT2 NAT2 NAT2 NAT2 NAT2 NAT2 NAT2
Function cds-synon No Data intron region No Data No Data No Data No Data missense missense No Data
Chr Pos (Genome Build 36.3) 18302075 18290333 18298855 18307943 18305609 18305773 18290944 18302383 18302650 18307883
Regulome DB Scorea 5 No Data No Data No Data No Data No Data 4 6 No Data No Data
TFBSb — Y — — — — Y — — —
Splicing (ESE or ESS) — — — — — — — — — —
miRNA (miRanda) — — — — — — — — — —
miRNA (Sanger) — — — — — — — — — —
nsSNP — — — — — — — Y Y —
MAFcfor Chinese in database 0.366 0.453 0.276 0.471 0.163 0.244 0.188 0.207 0.159 0.058
MAF in our controls (n = 686) 0.387 0.452 0.249 0.460 0.188 0.257 0.193 0.227 0.153 0.067
pvalue for HWEdtest in our controls 0.432 0.317 0.073 0.544 0.841 0.484 0.124 0.328 0.201 0.015
Genotyping methode LDR LDR LDR LDR LDR LDR LDR LDR LDR LDR
% Genotyping value 98.48% 96.43% 96.35% 98.18% 96.43% 98.48% 98.18% 96.81% 95.29% 98.18%
ahttp://www.regulomedb.org/;
bTFBS: Transcription Factor Binding Site (http://snpinfo.niehs.nih.gov/snpinfo/snpfunc.htm);
cMAF: minor allele frequency,NAT2rs4540438 A
.C MAF is in CHB+JPT population;
dHWE: Hardy–Weinberg equilibrium;
eLDR: ligation detection reaction; Bold values are statistically significant (
p,0.05).
doi:10.1371/journal.pone.0087783.t002 Polymo
rphisms
of
NAT2
and
Esophagea
l
Cancer
ONE
|
www.ploson
e.org
3
February
2014
|
Volume
9
|
Issue
2
|
Table 3.Logistic regression analyses of associations betweenNAT2rs1041983 C.T, rs11780884 A.G, rs11996129 T.C, rs12674710 C.A, rs1390359 C.A, rs1390360 G.A, rs1565684 T.C, rs1799930 G.A, rs1799931 G.A and rs4540438 A.C polymorphisms and risk of ESCC.
Genotype
Cases (n = 629)
Controls
(n = 686) Crude OR (95%CI) p Adjusted ORa(95%CI) p
n % n %
NAT2rs1041983 C.T
CC 209 33.8 259 38.3 1.00 1.00
CT 315 50.9 311 46.0 1.26 (0.99–1.60) 0.064 1.23 (0.96–1.57) 0.097
TT 95 15.3 106 15.7 1.11 (0.80–1.55) 0.535 1.13 (0.81–1.59) 0.478
CT+TT 410 66.2 417 61.7 1.22 (0.97–1.53) 0.089 1.21 (0.96–1.52) 0.114
CC+CT 524 84.7 570 84.3 1.00 1.00
TT 95 15.3 106 15.7 0.98 (0.72–1.32) 0.869 1.00 (0.74–1.37) 0.979
NAT2rs11780884 A.G
AA 165 27.3 206 31.0 1.00 1.00
AG 303 50.2 316 47.6 1.20 (0.93–1.55) 0.172 1.18 (0.91–1.53) 0.219
GG 136 22.5 142 21.4 1.20 (0.88–1.63) 0.261 1.22 (0.89–1.68) 0.215
AG+GG 439 72.7 458 69.0 1.20 (0.94–1.53) 0.148 1.19 (0.93–1.53) 0.163
AA+AG 468 77.5 522 78.6 1.00 1.00
GG 136 22.5 142 21.4 1.07 (0.82–1.39) 0.627 1.10 (0.84–1.45) 0.479
NAT2rs11996129 T.C
TT 345 56.2 377 57.7 1.00 1.00
TC 236 38.4 227 34.8 1.14 (0.90–1.44) 0.284 1.16 (0.92–1.47) 0.220
CC 33 5.4 49 7.5 0.74 (0.46–1.17) 0.196 0.80 (0.50–1.29) 0.366
TC+CC 269 43.8 276 42.3 1.07 (0.85–1.33) 0.579 1.10 (0.88–1.38) 0.411
TT+TC 581 94.6 604 92.5 1.00 1.00
CC 33 5.4 49 7.5 0.70 (0.44–1.10) 0.125 0.76 (0.47–1.21) 0.243
NAT2rs12674710 C.A
CC 166 27.2 202 29.7 1.00 1.00
CA 309 50.6 330 48.5 1.14 (0.88–1.47) 0.321 1.11 (0.86–1.45) 0.421
AA 136 22.3 148 21.8 1.19 (0.82–1.53) 0.482 1.15 (0.84–1.58) 0.388
CA+AA 445 72.8 478 70.3 1.13 (0.89–1.44) 0.314 1.13 (0.88–1.44) 0.351
CC+CA 475 77.7 532 78.2 1.00 1.00
AA 136 22.3 148 21.8 1.03 (0.79–1.34) 0.831 1.07 (0.82–1.41) 0.604
NAT2rs1390359 C.A
CC 412 67.4 434 66.1 1.00 1.00
CA 179 29.3 199 30.3 0.95 (0.74–1.21) 0.664 0.96 (0.75–1.23) 0.735
AA 20 3.3 24 3.7 0.88 (0.48–1.61) 0.676 1.03 (0.55–1.91) 0.930
CA+AA 199 32.6 223 33.9 0.94 (0.74–1.19) 0.605 0.97 (0.76–1.23) 0.771
CC+CA 591 96.7 633 96.3 1.00 1.00
AA 20 3.3 24 3.7 0.89 (0.49–1.63) 0.713 1.04 (0.56–1.93) 0.896
NAT2rs1390360 G.A
GG 343 55.4 377 55.8 1.00 1.00
GA 242 39.1 251 37.1 1.06 (0.84–1.33) 0.620 1.07 (0.85–1.36) 0.555
AA 34 5.5 48 7.1 0.78 (0.49–1.24) 0.289 0.88 (0.55–1.42) 0.609
GA+AA 276 44.6 299 44.2 1.02 (0.82–1.26) 0.897 1.05 (0.84–1.31) 0.703
GG+GA 585 94.5 628 92.9 1.00 1.00
AA 34 5.5 48 7.1 0.76 (0.48–1.20) 0.237 0.86 (0.54–1.37) 0.519
NAT2rs1565684 T.C
TT 366 59.9 437 64.3 1.00 1.00
TC 214 35.0 224 32.9 1.14 (0.90–1.44) 0.269 1.14 (0.90–1.45) 0.270
CC 31 5.1 19 2.8 1.95 (1.08–3.51) 0.026 1.77 (0.97–3.21) 0.063
Polymorphisms ofNAT2and Esophageal Cancer Risk
of ESCC (CC vs. TT/TC: OR = 1.86, 95% CI = 1.04–3.33,
p= 0.037) (Table 3). After adjusted for age, sex, smoking and drinking status, the CC genotype was associated with a borderline significantly increased risk for ESCC (CC vs. TT: adjusted OR = 1.77, 95% CI = 0.97–3.21,p= 0.063 and CC vs. TT/TC: adjusted OR = 1.68, 95% CI = 0.93–3.04, p= 0.085). After the Bonferroni correction, in all comparison models,NAT2rs1565684 T.C SNP was not associated with ESCC risk (p.0.05).
For the other nine SNPs, in the single locus analyses, there was no statistically significant difference in genotype frequencies of these nine SNPs between the cases and the controls (p.0.05). Logistic regression analyses revealed that none of these nine polymorphic sites was associated with the susceptibility to ESCC. In all comparison models, the nine SNPs were not associated with ESCC risk (p.0.05) before and after the Bonferroni correction (Table 3).
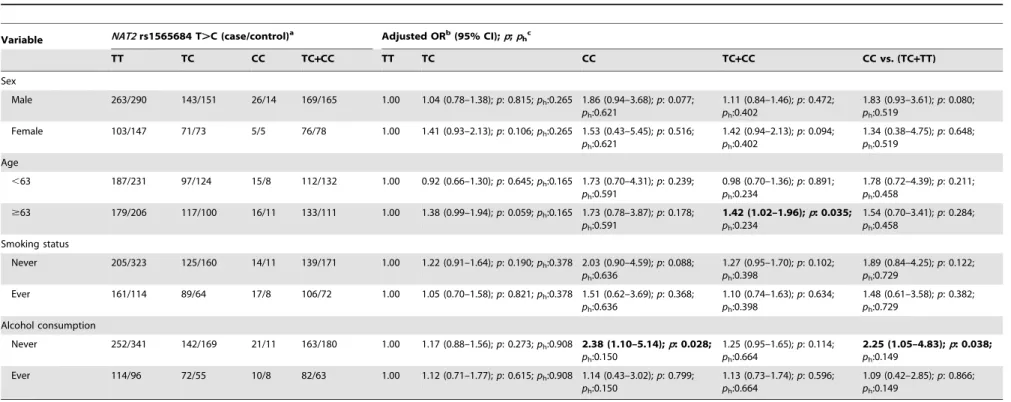
Stratification analyses of NAT2 rs1565684 T.C polymorphisms and risk of ESCC
To evaluate the effects ofNAT2rs1565684 T.C genotypes on ESCC risk according to different age, sex, smoking and alcohol drinking status; we performed the stratification analyses (Table 4). A significantly increased risk of ESCC associated with theNAT2
rs1565684 T.C polymorphism was evident among older patients and patients who never drunk (Table 4).
Discussion
In this hospital-based case-control study of ESCC, we found that ten selectedNAT2tagging SNPs were not associated with the risk of ESCC after the Bonferroni correction. NAT2 rs1565684 CC genotype was associated with a borderline significantly increased risk for ESCC. A significantly increased risk of ESCC associated with the NAT2 rs1565684 T.C polymorphism was evident among older patients and patients who never drunk. To the best of our knowledge, it’s the first positive finding ofNAT2
rs1565684 T.C polymorphism and ESCC risk.
NAT2 is involved in the metabolism of a major class of tobacco smoke carcinogens (the aromatic amines) andNAT2variant alleles result in slow clearance of aromatic amines. In humans, theNAT2
gene encodes a phase II enzyme that plays an essential role in aromatic, heterocyclic amines and hydrazines metabolism [11]. NAT2 influences the detoxification of aromatic and heterocyclic amine carcinogens (which are present in tobacco smoke) by two pathways: the metabolism reaction may result in the detoxification by N-acetylation, or bioactivation by O-acetylation often preceded by CYP450 hydroxylation [11].
Table 3.Cont.
Genotype
Cases (n = 629)
Controls
(n = 686) Crude OR (95%CI) p Adjusted ORa(95%CI) p
n % n %
TC+CC 245 40.1 243 35.7 1.20 (0.96–1.51) 0.107 1.19 (0.95–1.50) 0.130
TT+TC 580 94.9 661 97.2 1.00 1.00
CC 31 5.1 19 2.8 1.86 (1.04–3.33) 0.037 1.68 (0.93–3.04) 0.085
NAT2rs1799930 G.A
GG 375 62.5 407 60.5 1.00 1.00
GA 200 33.3 227 33.7 0.96 (0.76–1.21) 0.711 0.97 (0.76–1.23) 0.804
AA 25 4.2 39 5.8 0.70 (0.41–1.17) 0.173 0.78 (0.45–1.33) 0.353
GA+AA 225 37.5 266 39.5 0.92 (0.73–1.15) 0.459 0.94 (0.75–1.19) 0.620
GG+GA 575 95.8 634 94.2 1.00 1.00
AA 25 4.2 39 5.8 0.71 (0.42–1.18) 0.186 0.78 (0.46–1.33) 0.367
NAT2rs1799931 G.A
GG 406 67.3 462 71.1 1.00 1.00
GA 181 30.0 177 27.2 1.16 (0.91–1.49) 0.228 1.15 (0.89–1.47) 0.289
AA 16 2.7 11 1.7 1.66 (0.76–3.61) 0.205 1.35 (0.61–2.99) 0.465
GA+AA 197 32.7 188 28.9 1.19 (0.94–1.52) 0.151 1.16 (0.91–1.48) 0.240
GG+GA 587 97.3 639 98.3 1.00 1.00
AA 16 2.7 11 1.7 1.58 (0.73–3.44) 0.246 1.29 (0.59–2.86) 0.526
NAT2rs4540438 A.C
AA 522 85.4 596 87.6 1.00 1.00
AC 86 14.1 77 11.3 1.28 (0.92–1.77) 0.148 1.31 (0.93–1.83) 0.118
CC 3 0.5 7 1.0 0.49 (0.13–1.90) 0.302 0.52 (0.13–2.04) 0.344
AC+CC 89 14.6 84 12.4 1.21 (0.88–1.67) 0.243 1.24 (0.90–1.72) 0.195
AA+AC 608 99.5 673 99.0 1.00 1.00
CC 3 0.5 7 1.0 0.48 (0.12–1.84) 0.282 0.50 (0.13–1.97) 0.319
aAdjusted for age, sex, smoking status and alcohol consumption; Bonferroni correction was performed to correct thepvalue (p
correct); For the 10NAT2SNPs,
pcorrect.0.05 in all comparison models; Bold values are statistically significant (p,0.05).
Table 4.Stratified analyses betweenNAT2rs1565684 T.C polymorphism and ESCC risk by sex, age, smoking status and alcohol consumption.
Variable NAT2rs1565684 T.C (case/control)a Adjusted ORb(95% CI);p;p hc
TT TC CC TC+CC TT TC CC TC+CC CC vs. (TC+TT)
Sex
Male 263/290 143/151 26/14 169/165 1.00 1.04 (0.78–1.38);p: 0.815;ph:0.265 1.86 (0.94–3.68);p: 0.077;
ph:0.621
1.11 (0.84–1.46);p: 0.472; ph:0.402
1.83 (0.93–3.61);p: 0.080; ph:0.519
Female 103/147 71/73 5/5 76/78 1.00 1.41 (0.93–2.13);p: 0.106;ph:0.265 1.53 (0.43–5.45);p: 0.516;
ph:0.621
1.42 (0.94–2.13);p: 0.094; ph:0.402
1.34 (0.38–4.75);p: 0.648; ph:0.519
Age
,63 187/231 97/124 15/8 112/132 1.00 0.92 (0.66–1.30);p: 0.645;ph:0.165 1.73 (0.70–4.31);p: 0.239;
ph:0.591
0.98 (0.70–1.36);p: 0.891; ph:0.234
1.78 (0.72–4.39);p: 0.211; ph:0.458
$63 179/206 117/100 16/11 133/111 1.00 1.38 (0.99–1.94);p: 0.059;ph:0.165 1.73 (0.78–3.87);p: 0.178;
ph:0.591
1.42 (1.02–1.96);p: 0.035; ph:0.234
1.54 (0.70–3.41);p: 0.284; ph:0.458
Smoking status
Never 205/323 125/160 14/11 139/171 1.00 1.22 (0.91–1.64);p: 0.190;ph:0.378 2.03 (0.90–4.59);p: 0.088;
ph:0.636
1.27 (0.95–1.70);p: 0.102; ph:0.398
1.89 (0.84–4.25);p: 0.122; ph:0.729
Ever 161/114 89/64 17/8 106/72 1.00 1.05 (0.70–1.58);p: 0.821;ph:0.378 1.51 (0.62–3.69);p: 0.368;
ph:0.636
1.10 (0.74–1.63);p: 0.634; ph:0.398
1.48 (0.61–3.58);p: 0.382; ph:0.729
Alcohol consumption
Never 252/341 142/169 21/11 163/180 1.00 1.17 (0.88–1.56);p: 0.273;ph:0.908 2.38 (1.10–5.14);p: 0.028;
ph:0.150
1.25 (0.95–1.65);p: 0.114; ph:0.664
2.25 (1.05–4.83);p: 0.038; ph:0.149
Ever 114/96 72/55 10/8 82/63 1.00 1.12 (0.71–1.77);p: 0.615;ph:0.908 1.14 (0.43–3.02);p: 0.799;
ph:0.150
1.13 (0.73–1.74);p: 0.596; ph:0.664
1.09 (0.42–2.85);p: 0.866; ph:0.149
aThe genotyping was successful in 611 (97.1%) ESCC cases, and 680 (99.1%) controls forNAT2rs1565684 T .C;
bAdjusted for age, sex, smoking status and alcohol consumption (besides stratified factors accordingly) in a logistic regression model;
cp
hfor heterogeneity.
doi:10.1371/journal.pone.0087783.t004 Polymo
rphisms
of
NAT2
and
Esophagea
l
Cancer
Risk
PLOS
ONE
|
www.ploson
e.org
6
February
2014
|
Volume
9
|
Issue
2
|
Previous case-control reports have yielded inconsistent results regarding the association of NAT2 SNPs with cancers, possibly because of the small number of subjects, which would compromise the power of the statistical analyses in these studies. In the esophagus, the slow NAT2 acetylator genotype was more susceptible to esophageal cancer in Japan [12]. However, in another study in Taiwan,NAT2polymorphisms did not affect the risk of esophageal cancer, irrespective of environmental factors [13]. In a more recent study in India,NAT2acetylator genotypes did not influence susceptibility to esophageal cancer. NAT2
polymorphisms did not significantly modulate the cancer risk after interaction with environmental factors, such as tobacco, alcohol or occupational exposure [14]. In another study in the Kashmir Valley, none of the three NAT2 polymorphic alleles (rs1799929, rs1799930 and rs1799931) was found to be indepen-dently associated with risk of esophageal and gastric cancers [15], which was also in accordance with our results. Meta analysis also suggested thatNAT2genotypes are not associated with lung cancer [16], gastric cancer [17], breast cancer [18], prostate cancer [19] and oral cancer [20]. NAT2 rs1565684 T.C is in linkage disequilibrium with another important SNP NAT2 rs4345600 A.G (NS 12,29306 A.G) (r2= 0.845) in Chinese Han Beijing population. Although NAT2 rs1565684 T.C SNP is functional using SNP function prediction websites (http://snpinfo.niehs.nih. gov/snpinfo/snpfunc.htm and http://www.regulomedb.org/). The etiology of NAT2 rs1565684 T.C SNP is still not well known and need further investigation.
This case-control study had several limitations. First, the patients and controls were enrolled from hospitals; inherent bias may have resulted in spurious findings. Second, the statistical power of our study was limited because of the moderate sample size and absence of a validation cohort; further replication studies are needed. Third, the viral infections and immune parameters information were not available, which restricted the power of our analyses. Finally, we did not obtain detailed information on cancer metastasis and survival, which restricted further analyses of the roles of the NAT2 polymorphisms in ESCC progression and prognosis.
In conclusion, our study provides evidence thatNAT2tagging SNPs may not contribute to the risk of ESCC. Larger well-designed studies are required to confirm the current findings.
Acknowledgments
We appreciate all patients who participated in this study. We wish to thank Dr. Yiqun Chen (Biowing Applied Biotechnology Company, Shanghai, China) for technical support.
Author Contributions
Conceived and designed the experiments: HG LW WT YF Y. Shi Y. Sun SC JY. Performed the experiments: Y. Shi Y. Sun JZ XW LZ LW AS. Analyzed the data: HG LW JY YF SC. Contributed reagents/materials/ analysis tools: XW LW LZ GD CL RL. Wrote the paper: JY LW WT SC HG. Critical review of manuscript: Y. Shi Y. Sun SC HG LW.
References
1. Chen W, He Y, Zheng R, Zhang S, Zeng H, et al. (2013) Esophageal cancer incidence and mortality in China, 2009. J Thorac Dis 5: 19–26.
2. Gu H, Ding G, Zhang W, Liu C, Chen Y, et al. (2012) Replication study of PLCE1 and C20orf54 polymorphism and risk of esophageal cancer in a Chinese population. Mol Biol Rep 39: 9105–9111.
3. Blum M, Grant DM, McBride W, Heim M, Meyer UA (1990) Human arylamine N-acetyltransferase genes: isolation, chromosomal localization, and functional expression. DNA Cell Biol 9: 193–203.
4. Garcia-Martin E (2008) Interethnic and intraethnic variability of NAT2 single nucleotide polymorphisms. Curr Drug Metab 9: 487–497.
5. Walker K, Ginsberg G, Hattis D, Johns DO, Guyton KZ, et al. (2009) Genetic polymorphism in N-Acetyltransferase (NAT): Population distribution of NAT1 and NAT2 activity. J Toxicol Environ Health B Crit Rev 12: 440–472. 6. Layton DW, Bogen KT, Knize MG, Hatch FT, Johnson VM, et al. (1995)
Cancer risk of heterocyclic amines in cooked foods: an analysis and implications for research. Carcinogenesis 16: 39–52.
7. Manabe S, Tohyama K, Wada O, Aramaki T (1991) Detection of a carcinogen, 2-amino-1-methyl-6-phenylimidazo[4,5-b]pyridine (PhIP), in cigarette smoke condensate. Carcinogenesis 12: 1945–1947.
8. Wei J, Zheng L, Liu S, Yin J, Wang L, et al. (2013) MiR-196a2 rs11614913 T.C polymorphism and risk of esophageal cancer in a Chinese population. Hum Immunol 74: 1199–1205.
9. Chen ZJ, Zhao H, He L, Shi Y, Qin Y, et al. (2011) Genome-wide association study identifies susceptibility loci for polycystic ovary syndrome on chromosome 2p16.3, 2p21 and 9q33.3. Nat Genet 43: 55–59.
10. Yin J, Wang X, Zheng L, Shi Y, Wang L, et al. (2013) Hsa-miR-34b/c rs4938723 T.C and hsa-miR-423 rs6505162 C.A Polymorphisms Are Associated with the Risk of Esophageal Cancer in a Chinese Population. PLoS One 8: e80570.
11. Liu L, Wagner CR, Hanna PE (2009) Isoform-selective inactivation of human arylamine N-acetyltransferases by reactive metabolites of carcinogenic aryla-mines. Chem Res Toxicol 22: 1962–1974.
12. Morita S, Yano M, Tsujinaka T, Ogawa A, Taniguchi M, et al. (1998) Association between genetic polymorphisms of glutathione S-transferase P1 and N-acetyltransferase 2 and susceptibility to squamous-cell carcinoma of the esophagus. Int J Cancer 79: 517–520.
13. Lee JM, Lee YC, Yang SY, Shi WL, Lee CJ, et al. (2000) Genetic polymorphisms of p53 and GSTP1,but not NAT2,are associated with susceptibility to squamous-cell carcinoma of the esophagus. Int J Cancer 89: 458–464.
14. Jain M, Kumar S, Lal P, Tiwari A, Ghoshal UC, et al. (2007) Association of genetic polymorphisms of N-acetyltransferase 2 and susceptibility to esophageal cancer in north Indian population. Cancer Invest 25: 340–346.
15. Malik MA, Upadhyay R, Modi DR, Zargar SA, Mittal B (2009) Association of NAT2 gene polymorphisms with susceptibility to esophageal and gastric cancers in the Kashmir Valley. Arch Med Res 40: 416–423.
16. Cui D, Wang Z, Zhao E, Ma J, Lu W (2011) NAT2 polymorphism and lung cancer risk: a meta-analysis. Lung Cancer 73: 153–157.
17. Zhong X, Hui C, Xiao-Ling W, Yan L, Na L (2010) NAT2 polymorphism and gastric cancer susceptibility: a meta-analysis. Arch Med Res 41: 275–280. 18. Zhang J, Qiu LX, Wang ZH, Wang JL, He SS, et al. (2010) NAT2
polymorphisms combining with smoking associated with breast cancer susceptibility: a meta-analysis. Breast Cancer Res Treat 123: 877–883. 19. Gong C, Hu X, Gao Y, Cao Y, Gao F, et al. (2011) A meta-analysis of the NAT1
and NAT2 polymorphisms and prostate cancer: a huge review. Med Oncol 28: 365–376.